
APPENDIX
C
Predicting the Pace of Fertility Decline
In projecting fertility trends for developing countries with high to moderate fertility, one can usually assume that fertility will decline. The pace of decline, however, is difficult to specify. A common practice, as with the U.N. Population Division's projections, is to assign a year for fertility to reach replacement level in a given country and allow this to dictate the course of decline. Instead, this exercise attempts to directly predict the future pace of decline from variables measurable a priori, replicating some earlier analysis in Bos and Bulatao (1990).
Three stages in fertility transition are distinguished: the pretransition and early-transition stage, the midtransition stage, and the late transition stage (as replacement-level fertility is approached and possibly breached). Each stage may have its characteristic pace. The focus here is mainly on midtransition, but parallel analyses of earlier and later stages are also provided.
In pretransition, fertility in developing countries may rise or decline. The start of sustained fertility decline may depend on attaining lower mortality levels, as a necessary but not sufficient condition for the start of transition (Bulatao and Elwan, 1985). In midtransition, Bos and Bulatao (1990) describe fertility decline as reasonably linear in total fertility. The pace of previous decline predicted subsequent decline; socioeconomic indicators were at best poor predictors. For late transition, Bos and Bulatao argued that objective criteria did not exist to determine when transition had run its course. They observed that fertility decline appeared to slow down as replacement level was approached, so that on average the fall of total fertility from 3 births to around 2 took about 15 years.
METHOD
To attempt to verify some part of these observations, fertility estimates for 1950-1995 from the 1998 U.N. revision (United Nations, 1999) are used. These are given by 5-year periods, and an attempt is made to predict the change in estimated total fertility from one 5-year period to the next.
This change was estimated for all successive 5-year periods for all countries, and the estimated changes pooled across countries and periods. To allow for the possibility that the rate of change has varied over time, the initial date of the first 5-year period is included in some analyses. (For instance, for change in total fertility between 1970-1975 and 1975-1980, the date variable was coded as 70.)
To distinguish stages in transition, the fertility levels themselves will be used, assuming that total fertility above 5.0 is either pretransitional or early transitional and that total fertility below 2.5 is late transitional. Because fertility change is predicted from change in the preceding period, fertility within both the prediction period and the previous period must be no greater than 5.0 and no less than 2.5 at all points to be considered in midtransition. If any part (generally the first measure for the previous period) is greater than 5.0, the entire segment is considered pre- or early transitional. If any part (generally the last measure for the prediction period) is under 2.5, the entire segment is considered late transitional. (Bos and Bulatao instead attempted to date the start of fertility transition and conducted analysis by period beginning with this point, but this refinement is not attempted here.)
The number of cases available for analysis is shown in Table C-1. Because of missing data, analyses sometimes include fewer periods. Industrial and developing countries are distinguished in the table. The two groups were combined in the analysis, except for analysis of late-transition fertility change, for which only developing countries were used. Including industrial countries for late transition would require identifying the undefinable point at which transition ends. Additional analysis showed that excluding industrial countries would have made virtually no difference to the estimated coefficients for pretransition-early transition and midtransition stages, but including them, in the case of the late-transition (or posttransition) stage, would have altered results somewhat.
Three socioeconomic indicators are also used: infant mortality (United Nations, 1999), gross female secondary school enrollment, and the percentage of the population that is urban (World Bank, 1999). The latter data are less complete. Whereas the fertility and mortality data cover the period 1950-1995, the education and urbanization data start in 1960 and are missing for various countries and years. Both the initial level of each
TABLE C-1 Cases available for analysis of fertility transition
|
Stage |
To fall in this stage, total fertility must be: |
Developing countries |
Industrial countries |
|
Pretransition and early transition |
> 5 at the start |
828 |
5 |
|
Midtransition |
5 or less at the start and 2.5 or more at the end |
213 |
64 |
|
Late transition and posttransition |
< 2.5 at the end |
86 |
275 |
|
Note: Each case is two successive 5-year periods between which change in total fertility in one country can be calculated. Cases are dated using the initial year of the first 5-year period. With cases dated 1950 left out (because data are not provided on the prior trend in fertility), each country contributes eight cases to the analysis. Logically a case might be both pretransitional and late transitional, if total fertility is initially above 5.0 and declines to below 2.5. The one such case, however, is left out. |
|||
indicator and the change in the indicator over the preceding 5-year period are used as predictors.
RESULTS
Means and standard deviations for all the variables in the analysis are shown in Table C-2. Fertility decline is greatest in midtransition, being 0.31 points per 5-year period on average, or 0.06 points annually. It clearly slows in late transition. In pre- and early transition it also appears slower. However, the picture changes if one leaves out pretransitional developing countries. We assume countries are pretransitional if their total fertility is above 5.0 and they have not experienced a fall in total fertility of at least 0.5 points in any preceding 5-year period. Leaving out these countries shows that the pace of decline is actually faster in early transition than in midtransition (Figure C-1).
Because of how midtransition is defined, with a floor for the final estimate of fertility over three periods, some instances of rapid fertility decline at low-to-moderate fertility levels are probably excluded. Indeed, changing the definition—removing the floor, for instance, and requiring instead that initial fertility in any period be at least 3.0—would lower mean change in midtransition to between −.039 and −.033. However, this change would have essentially no effect on the regression results for midtransition to be reported shortly.
Consider the other variables in Table C-2. Midtransition cases center around 1974. Early-transition cases are somewhat earlier on average, and late-transition cases on average a decade later. As expected, infant mortal-
TABLE C-2 Means and standard deviations
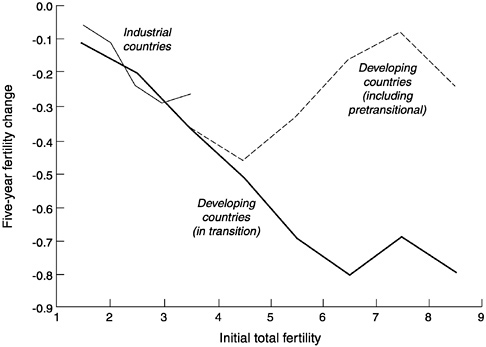
FIGURE C-1 Five-year change in total fertility as a function of initial level: Pooled data for developing and industrial countries for 1950-1995.
ity falls, female education rises, and urbanization increases as one moves from early transition to midtransition to late transition.
Correlations between fertility change in specific periods, for developing countries only, are shown in Table C-3. The rate of change in the immediately preceding period has the strongest relationship to subsequent fertility change. The rate of change two periods back still has a positive relationship to subsequent change, but, going further back, the relationships are essentially zero or even negative.
Table C-4 shows regressions to predict rate of fertility change in midtransition (including any industrial countries that, at the given point, were in this stage). Fertility change in the previous period is the best predictor, better than all the socioeconomic indicators combined. None of the socioeconomic indicators has a significant effect when previous fertility change is in the equation. A quadratic term for previous fertility change is not significant, nor does date appear to have any effect.
The estimated equation with fertility change alone indicates that, on average, the subsequent rate of fertility change is partly dependent on earlier change. This equation might be applied iteratively, predicting change in the second period from the first period, change in the third
TABLE C-3 Correlations between rates of fertility change by period: Developing countries
|
Period |
1955-1960 to 1960-1965 |
1960-1965 to 1965-1970 |
1965-1970 to 1970-1975 |
1970-1975 to 1975-198 |
1975-1980 to 1980-1985 |
1980-1985 to 1985-1990 |
1985-1990 to 1990-1995 |
1990-1995 to 1995-2000 |
|
1950-1955 to 1955-1960 |
0.20* |
0.11 |
−0.08 |
−0.08 |
−0.09 |
−0.19 |
−0.02 |
−0.04 |
|
1955-1960 to 1960-1965 |
0.34** |
0.22* |
0.10 |
0.05 |
−0.04 |
−0.17 |
−0.24* |
|
|
1960-1965 to 1965-1970 |
0.47** |
0.21* |
−0.01 |
−0.10 |
−0.27** |
−0.31** |
||
|
1965-1970 to 1970-1975 |
0.58** |
0.40** |
0.05 |
−0.12 |
−0.28** |
|||
|
1970-1975 to 1975-1980 |
0.30** |
0.10 |
0.00 |
−0.26** |
||||
|
1975-1980 to 1980-1985 |
0.42** |
0.16 |
−0.02 |
|||||
|
1980-1985 to 1985-1990 |
0.58** |
0.29** |
||||||
|
1985-1990 to 1990-1995 |
0.53** |
|||||||
|
*Significant at 0.01 (one–tailed). **Significant at 0.001 (one–tailed). |
||||||||
period from the second period, and so on. If this is done, the rate of change in total fertility, whatever its initial level in the first period, eventually reverts toward what might be considered an equilibrium rate of −0.06 points annually. That is, fertility in a country with a faster rate of change than this will on average see fertility change slow down, whereas a country with a slower rate will subsequently see it speed up.
Figure C-2 illustrates this for three hypothetical cases that each start with total fertility at 5.0 but then show different annual rates of fertility change, of −0.02 (i.e., −1.0 per 5-year period), −0.06, and −0.10. The equation gives annual rates of change in the following 5-year period ranging from −0.07 to −0.05, but successive applications of the equation lead rapidly to convergence in the rate of decline.
Similar regressions for pre- and early-transitional cases give more complex results (Table C-5). Previous fertility change is still the most important factor, but its effect is not linear. The effect of date is significant— indicating more rapid decline at later dates—until socioeconomic variables are added. Without socioeconomic variables, the estimated equation indicates equilibrium rates of change rising from −0.06 annually for 1960 to −0.12 annually for 1990. Including socioeconomic variables suggests that much of this change is due to falling infant mortality levels.
When infant mortality is 20 points per thousand lower—equivalent to the difference, say, between current infant mortality in Nigeria and Bolivia, or between Bolivia and China—fertility decline in pre- and early transition is 0.01 points per year faster. (A quadratic term for infant mortality was not significant.)
For late-transition cases, the results are less satisfactory (Table C-6). Previous fertility change does have an effect, but this disappears when date is added to the equation. The date effect, however, is a slowing of fertility decline over time, not a speeding up. Adding all the socioeconomic variables reduces the number of cases by more than half and leaves no significant effects. Therefore, only the regressions with infant mortality are shown. The unexpected effect of date again appears, and the effect of initial infant mortality level is also perverse, with higher infant mortality being related to faster fertility decline.
DISCUSSION
The central conclusion from the analysis of the midtransition is that the pace of fertility decline is in fact partly predictable from immediately preceding decline. Over time, however, after 10 or at most 15 years, one
TABLE C-4 Regressions for change in total fertility between 5–year periods during midtransition
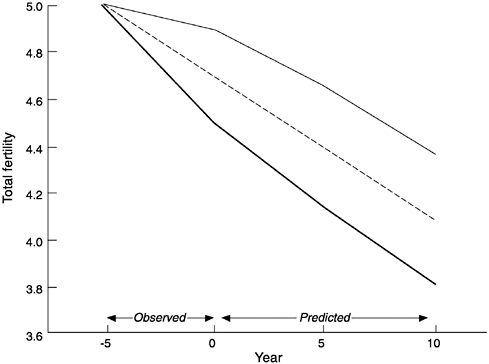
FIGURE C-2 Simulated trends in midtransition total fertility, assuming initial total fertility of 5 and varying observed rates of decline.
cannot predict the pace of decline. On these points, the analysis essentially confirms the earlier findings of Bos and Bulatao (1990).
Socioeconomic variables do not help to predict the pace of decline in midtransition, once the previous rate of decline is taken into account. This does not imply that socioeconomic factors are irrelevant to fertility transition. Rather the earlier rate of fertility decline already incorporates their effects, particularly the effect of infant mortality (which would be significant if previous fertility decline was not in the equation). In addition, the equations include only previous and not contemporaneous change in socioeconomic indicators, because contemporaneous change would not be known in advance and would itself have to be predicted.
Prediction of fertility change in pretransition and early transition has not been investigated thoroughly here. In particular, the pretransition and the early transition have not been distinguished, which would have required precise dating of the start of fertility transition. In addition, part of the prediction period covered in these regressions may actually fall in midtransition. What is being predicted for this stage, therefore, may be
TABLE C-5 Regressions for change in total fertility between 5-year periods during pre- and early transition
TABLE C-6 Regressions for change in total fertility between 5-year periods during late transition
partly how soon fertility transition starts and partly how fast it progresses in its early and possibly somewhat later stages. The two cannot be distinguished.
The fact that the level of infant mortality seems to predict fertility decline in this stage is interesting from two perspectives. It seems to support the use of a mortality threshold in projecting the start of fertility transition (e.g., Bulatao and Elwan, 1985). It also suggests an explanation for why fertility transition seems to have started more readily in the 1980s and 1990s—because infant mortality has declined substantially worldwide.
The analysis does not shed much light on fertility decline in late transition. Perhaps this is because the number of developing countries at this stage is too small to permit useful analysis. It may also result, however, from the fact that late transition trends are being predicted partly from midtransition trends; the distinction is difficult to make cleanly. In addition, no attempt was made to separate late transition from posttransition, a distinction increasingly difficult to make as more countries appear to continue their fertility declines below replacement level.
REFERENCES
Bos, E., and R.A. Bulatao 1990 Projecting Fertility for All Countries. Policy, Research, and External Affairs Working Paper 500. World Bank, Washington, D.C.
Bulatao, R.A., and A. Elwan 1985 Fertility and Mortality Transition: Patterns, Projections, and Interdependence . World Bank Staff Working Paper 681. World Bank, Washington, D.C.
United Nations (U.N.) 1999 World Population Prospects: The 1998 Revision, Vol. 1, Comprehensive Tables. New York: United Nations.
World Bank 1999 World Development Indicators 1999. Washington, D.C.: World Bank.


