
APPENDIX
E
Simulating Migration Projections
Three simple approaches to projecting international migration are evaluated. Each approach is used in simulated projections of migration since the 1950s, with the results assessed against U.N. historical estimates for the period.
Evaluating simulated projections, rather than actual projections, has three advantages. First, the approaches to be assessed can be precisely defined. Actual projections, in contrast, may involve complex, nonuniform procedures that are not always clear and for which full documentation no longer exists. Second, the assessments can cover a longer period. The projections evaluated in Appendix B, by contrast, cover half the period considered here. Third, the exercise provides a potential model for evaluating other approaches to projecting migration.
METHOD
The approaches are assessed against U.N. historical population estimates for 1950-1995. Net migration in these estimates may be calculated as the residual when natural increase (the birth rate minus the death rate) is subtracted from population growth. Since most net migration rates are close to zero, being on average proportionally smaller than crude birth or death rates, error in them may be proportionally larger. However, we are looking not at proportional error but at raw error. A handful of net migration rates are quite large. While three out of four annual rates are smaller, in the absolute, than 6 per thousand, some rates can go up to 100 or even 200 per thousand. We assume that the large rates—which carry much
more weight than other rates in most statistical analyses—are not simply residuals but must reflect some judgment.
The first approach to be evaluated is simply the assumption that future net migration is zero, for all countries in all periods. Simulating this is trivial; it involves creating a matrix of “future” net migration rates that is zero for each country for each period. The second approach is to assume that future net migration is constant at its “current ” level. This can be simulated by choosing a base date for projection —any period from 1950-1955 to 1985-1990—and keeping the net migration rate for each country constant for future periods. Simulated projections beginning later can be evaluated only for shorter-term results. (These simulations only involve projecting migration rates. Actual population trends are not projected. A third approach on which a simulation can be based will be defined later.)
The error in a “zero” projection (ez) is simply the inverse of the net migration rate n:
ez = 0 − n.
Both the rate and the error will be expressed per thousand annually. The error in a “constant” projection (ec) is not quite as simple. Projecting the net migration rate as constant would have the effect, in a global projection, of producing total net gains in immigrants across countries that would not exactly equal total net losses in emigrants. Instead, one has to project numbers of net migrants (m) as constant (assuming immigrants and emigrants are properly balanced across countries in the base year) and calculate the error in the net migration rate, given population P, as
ecy = (1000 * m0 / Py) − ny
for target year or period y.
RESULTS
Table E-1 shows the error if migration had been projected, over different projection horizons or projection lengths, as zero and as constant. Error is reported for the net migration rate and for net migrants, and absolute error is also reported. Mean error in a zero projection does vary slightly across projection lengths because the number of cases available at different projection lengths varies, but only means for the maximum number of cases are shown.
Whether zero or constant, the simulated projections understate the net migration rate, except for the longest projections. Zero projections also understate the number of net migrants, but constant projections overstate the number. Looking at absolute error permits comparisons of the
TABLE E-1 Mean error in migration projected in different ways, by projection length
|
Net migration rate (per 1,000) |
Net migrants (1,000s) |
||||
|
Projection type and length |
Error |
Absolute error |
Error |
Absolute error |
No. of cases |
|
Zero projection |
−0.68 |
5.87 |
−1.21 |
31.84 |
1,472 |
|
Constant projection |
|||||
|
5 years |
−0.55 |
4.38 |
0.38 |
26.16 |
1,472 |
|
10 years |
−0.81 |
5.74 |
1.18 |
34.42 |
1,288 |
|
15 years |
−0.85 |
6.33 |
1.90 |
37.58 |
1,104 |
|
20 years |
−0.77 |
6.50 |
3.04 |
42.71 |
920 |
|
25 years |
−0.64 |
6.25 |
3.81 |
45.01 |
736 |
|
30 years |
−0.35 |
5.76 |
3.81 |
44.75 |
552 |
|
35 years |
0.10 |
5.74 |
4.12 |
49.08 |
368 |
|
40 years |
0.37 |
6.38 |
3.05 |
58.45 |
184 |
precision of zero and constant projections. For 5- and 10-year projections, the constant assumption gives smaller absolute errors than the zero assumption, and therefore more precise net migration rates. For all longer projections, however, the zero assumption produces less absolute error than the constant assumption. In the majority of these comparisons, the mean levels of absolute error produced under these contrasting assumptions are significantly different by paired-sample t-tests.
Note: The error in zero projections varies slightly by projection length because the number of cases varies. The figures shown are for the maximum number of cases.
Table E-2 breaks down the results for absolute error in the projected net migration rate by target period and projection length. For instance, if 1960-1965 is the period for which a migration projection is to be made, one might simply assume migration is zero, or hold constant the preceding rate from 1955-1960 (which gives a projection 5 years long), or hold constant the rate from 1950-1955 (which gives a projection 10 years long). The accuracy of simulated migration projections clearly varies by target period; some periods seem to have been more difficult to project than others. The early 1990s, for instance, saw a substantial increase in number of net migrants over the previous decade, and error could be higher for this reason. Across periods, nevertheless, a consistent pattern still appears. Constant projections of 5-10 years, and sometimes 15 years, prove to be better than zero projections. However, longer constant projections are not as good as zero projections.
Perhaps these results are due to the failure to give proper weight to countries with large absolute numbers of net migrants but low net migra-
TABLE E-2 Mean absolute error in projected net migration rate, by projection length and target period
tion rates. To assess this possibility, one can look not at error in net migration rates but at error in net migrants. Table E-1 includes these results. On one hand, keeping migration constant tends to overestimate the number of net migrants, meaning that the average country has tended to receive fewer immigrants or send out more emigrants over time. The zero assumption, on the other hand, produces underestimates of net migrants. Projecting migrants as zero still appears better than projecting them as constant (absolute errors are smaller), except for short-term projections of 5 years.
Conceivably, period-to-period migration rates may be too variable to be useful for prediction, unlike averages for longer periods. This possibility was tested by taking averages over two successive periods (10 years) as well as over three successive periods (15 years), and holding these constant. Even with this refinement, however, the advantage of assuming zero migration persisted, except again for short projections of 5-10 years.
Individual country results are worth examining and are shown in Figure E-1. The x-axis shows net migrants (in thousands) averaged for each country across all comparisons involved in estimating error. (Note
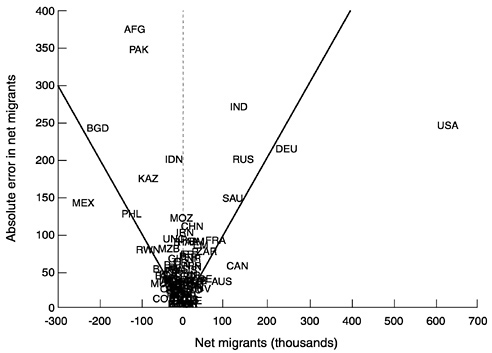
FIGURE E-1 Net migrants (thousands) and absolute error assuming constant net migrants (thousands), by country.
that this is not a simple historical average but tends to weight recent periods more heavily, because these periods are involved in a larger number of evaluations of simulated projections.) Plotted against these average net migrants is absolute net migrant error under the constant assumption, also averaged across all possible evaluations. In this diagram, all countries that fall outside the V are countries for which, on average, a constant-migration projection improves on a zero-migration projection, at least where error in net migrants rather than the net migration rate is concerned. For countries that fall within the V, a constant-migration projection is on average inferior.
For the United States (coded USA), a constant-migration assumption is decidedly superior to a zero-migration assumption. This is also true, though to a lesser extent, for Canada (CAN), Australia (AUS), and Germany (DEU), and on the other side of the ledger for Mexico (MEX). For a larger number of other countries, a constant-migration assumption produces substantial error, especially in South Asia. Some of these cases— one cannot tell whether they are the majority or not—probably involve refugee migration, which can neither be predicted in advance nor projected as constant for the future. Whatever the explanation, these and other unpredictable net migration streams appear important enough so that simply assuming zero migration is superior, except for short projections, to assuming constant migration.
One can, however, choose a more complex, differentiated approach to projection. One such approach might be to set migration as constant for industrial countries and simply distribute the migrants as net emigrants across developing countries in proportion to population. The results of this differentiated approach are intermediate between those of the constant projection and the zero projection, where absolute error in net migration rates is concerned (see Figure 6-4). Where absolute error in the number of net migrants is concerned, the differentiated projection produces essentially similar results to the zero projection (Figure E-2). (One could also try to double the number of net migrants into industrial countries, but since this also doubles those leaving the other countries, the overall absolute error increases slightly.)
Substantial error in projecting migration is due to crisis migration, sudden and unexpected waves of migrants produced by political, military, or economic crises. Assuming such crises are not predictable, one might attempt to eliminate certain countries from the evaluation, to see how well the simulated projections perform under “normal” conditions. A criterion that can be used for leaving out countries is a sudden change in the population growth rate, called a demographic quake, of at least 2.5 percentage points between 5-year periods.
Leaving out 28 countries that experienced a demographic quake be-
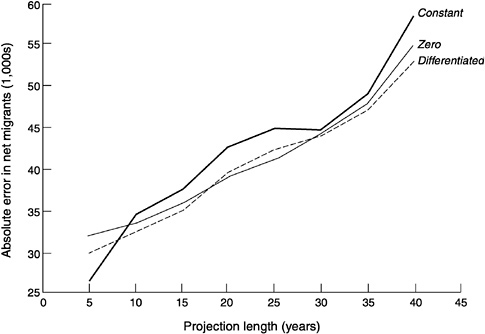
FIGURE E-2 Mean absolute error from projecting net migrants under zero, constant, or differentiated assumptions.
tween 1950 and 1995 makes the simulations look substantially more accurate (see Figure 6-4). Countries that did not experience such a quake have only 60 percent of the absolute error in net migration rates of all countries, in contrast to countries that did experience such a quake, which have three times the absolute error of the average country. The improvement from leaving out quake-hit countries is smaller where error in net migrants is concerned, because countries experiencing a quake tend to be smaller than average. The improvement holds for all three approaches: when migration is set to zero, when it is kept constant, and when a differentiated approach is adopted. The improvement therefore does not change the relative accuracy of the three approaches.
DISCUSSION
The results indicate that migration is so variable from period to period that projecting it as constant introduces more error than simply projecting zero migration, at least for projections longer than 10 years. This is true on average although not necessarily for specific countries. However, holding migration constant only for some countries introduces the prob
lem, in global projections, of determining where the net migrants come from or go to, and answers to this question may add to the error in projected migration for other countries.
A way to improve on the simple assumption that migration is zero is nevertheless suggested by the analysis. Differentiating countries, allowing constant migration for industrial countries and simply distributing the immigrants across other countries in proportion to population, appears to be an improvement over keeping migration constant everywhere. It is still slightly worse than the zero migration option, but this result nevertheless suggests that further improvement may be possible. For one thing, migration might be held constant for 5-10 years, which would certainly improve the simulation further. In addition, further distinctions among countries that separate those for which migration should be constant from those for which it should change could produce still further improvements.
Clearly, projections of migration will be more successful if countries avoid crisis migration. All the approaches considered would give better results under such conditions. Whether crisis migration can be predicted at all seems unlikely, and even the return migration after the initial crisis seems difficult to project. These results apply, of course, to the historical period from 1950 to 1995. Whether the results would be equally valid for projections into the 21st century is unknown.


