
2
The Accuracy of Past Projections
Accuracy is crucial in a population projection. It allows governments and other institutions to plan wisely and helps individuals comprehend the likely futures for their countries and the world. Yet there are no prizes for accuracy, and forecasters seldom have the satisfaction of appreciating their success. The projections we consider are so long term, covering several decades, that before they can come true—or be proven false—the forecasters themselves are likely to have been swallowed up by demographic processes: if not mortality or migration, then certainly job mobility.
The accuracy of recent forecasts is impossible to evaluate empirically. Instead, this chapter reaches back to older forecasts to see whether the predictions they contain are consistent with current evaluations of population history. The specific choices forecasters make change frequently, but if we assume that basic methodology remains the same, examination of the older record should throw some light on accuracy. The record examined is that of U.N. and World Bank projections, some from as far back as the 1950s, which are assessed against past population trends, also estimated by the U.N. (1999) in the course of making its forecasts.1
|
1 |
One U.S. Census Bureau forecast was also evaluated. Forecasts of the International Institute for Applied Systems Analysis do not cover specific countries and are too recent to evaluate. The criterion data from the U.N. may of course be modified in the future as historical estimates are updated, but the main features of this evaluation will probably not change much. |
Some point forecasts, as we shall see, appear quite accurate. A 4-percent error in a world projection from 40 years ago, which characterizes the longest projection we consider, might be considered quite satisfactory—no bigger than the possible undercount in some national censuses. But errors can be larger, especially in projections for individual countries, or for specific age groups, particularly the very young and the very old. Examining why some older projections have been more accurate than others, the chapter focuses on the way error grows as projections lengthen, on the consequences of error in the assumed initial size of the population, and on the contribution to error of misspecified trends in component rates.2
PROJECTED POPULATION SIZE
In 1998 the U.N. estimated that world population size will reach 6.06 billion in the year 2000. This figure is 220 million lower than the 6.28 billion projected by the U.N. in 1958. The error in this projection made 40 years earlier—assuming that the current estimate for the year 2000 is accurate—was therefore 3.6 percent. Figure 2-1 presents similar estimates of error for other U.N. world projections of recent decades. Errors range from 1 percent for the 1996 point forecast to 7 percent for the 1968 forecast, the latter being the only one with an error greater than 4 percent.
These errors are mostly quite modest, given that even the starting population for each projection was not known with exactitude. Modest errors are possible for several reasons. First, world projections are made by aggregating country projections. The positive and negative errors in country projections partly cancel one another, in all these cases, when world totals are calculated. Second, country projections themselves benefit from the fact that populations do not turn over quickly; at current life expectancy levels, most people alive at a given date are still alive three or four decades later.3 Finally, demographers have become reasonably proficient at predicting broad trends in fertility and mortality, the key determinants of future population size.
Despite this apparent accuracy, the fact that all these past projections of the 2000 world population are too high is somewhat surprising. A
|
2 |
In addition to drawing on the somewhat limited literature, this chapter reflects analyses conducted for the panel and summarized in Appendix B (at http://www.nap.edu), as well as some extension of the analysis in Keilman (1998). Where a specific citation is not provided, the data come from these analyses. No specific attention is paid to national projections by state statistical agencies, for which see Long (1995) and Keilman (1997). |
|
3 |
According to the World Bank 1998 projections, about half of the current world population will still be alive in 2050, constituting a third of the population at that date. |
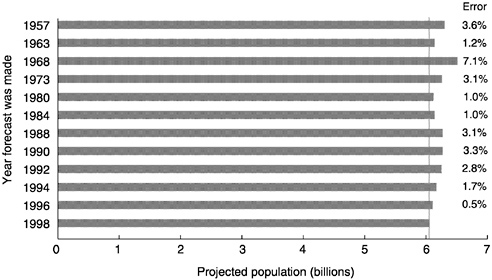
FIGURE 2-1 U.N. forecasts of world population in the year 2000 and their percentage error.
SOURCE: Data from various U.N. reports; see Appendix B.
major reason is that fertility in several countries has declined more rapidly than expected, and more rapidly than previous trends suggested, over the past decade (see Chapter 3).
Errors in population projections for individual countries are often substantially larger (in percentage terms) than errors for the world as a whole. In some instances, errors of over 50 percent occurred in past forecasts for a number of countries. Figure 2-2 plots absolute percentage error, averaged across country projections, in a set of past U.N. and World Bank point forecasts to 2000. The average falls from a high of 18 percent in a 1972 forecast to 4 percent in a 1994 forecast. In the calculation of this average, overprojection (positive error) counts as much as underprojection (negative error). This measure is therefore an indicator of average imprecision: it tells us how far off the projections are from current estimates, regardless of whether they are too high or too low.
An alternative summary measure can be calculated by averaging percentage errors, allowing positive errors and negative errors to cancel each other. The resulting average percentage error can be called bias: a positive value indicates that the projections were too high on average, and a negative one indicates they were too low.4 Estimates of the biases in past
|
4 |
The literature often applies the term “mean percentage error” (MPE) to averages of these error measures, or “mean absolute percentage error” (MAPE) to averages of their absolute values. |
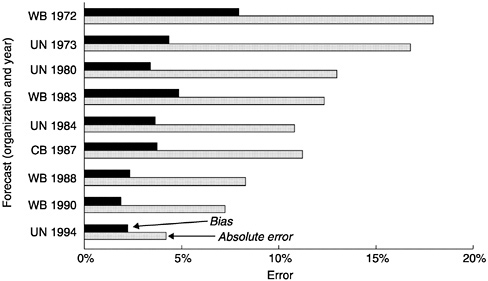
FIGURE 2-2 Mean bias and mean absolute error in country population projections for the year 2000, by source and date of forecast.
NOTE: See Appendix B for sources. WB stands for the World Bank, UN for the U.N. Population Division, and CB for the U.S. Census Bureau.
forecasts are also plotted in Figure 2-2. Bias declined from 8 percent in 1972 forecasts to 2 percent in 1994 forecasts. These bias estimates are similar in magnitude to the errors in the world totals plotted in Figure 2-1. The agreement between country biases and world errors would have been exact if every country had the same population size, but that is not the case.5 Error in world population projections is influenced less by error in small countries and more by error in large countries, such as China, India, and Nigeria. Bias, as calculated here, gives every country equal weight. (The population-weighted bias at the country level equals the error in the world total).
CORRELATES OF PROJECTION ERRORS
Projection error exists because our understanding of demographic behavior is not perfect (Keyfitz, 1982). Existing theories, which undergird projections, even when extensively tested may have limited validity in
|
5 |
In addition, small countries are sometimes included in world totals (which are used for Figure 2-1) even though projections for them are not reported. Furthermore, when averages are calculated, some countries are not included because they no longer exist as countries and cannot be reconstructed in current population projections. |
time and space, may be strongly conditional, or may not be applicable without the difficult prediction of nondemographic factors. In one view, the uncertainty of projections may be inherent, given the unpredictable choices individuals make regarding marriage and childbearing, health behavior, and migration. Any generalizations about human behavior would be narrowly restricted to specific institutional settings or particular historical epochs (Nagel, 1961; Boudon, 1986). In another view, imperfect understanding of demographic behavior is temporary and could be partly remedied eventually through improved insight and better theory (Willekens, 1990). Whichever view is correct, projection error can be shown to vary in systematic ways, being sensitive to specific factors.6
Projection Length
The mean absolute percentage errors for countries in Figure 2-2 indicate that more recent forecasts, which involve a shorter time horizon, have been more precise than those further in the past. A similar pattern of increasing precision can be observed if one compares projections to other years—1995, 1990, 1985, and so on. The obvious explanation for this is that the earlier projections covered a longer interval or time horizon than the more recent projections. The more years a projection covers, the greater the chance that unforeseen developments will produce unexpected changes in fertility, mortality, or migration. This loss of precision as projections lengthen is referred to as the length effect.
There could, however, be another explanation for this pattern. The magnitude of errors could have declined in more recent forecasts because demographers had more accurate current data and became better at making projections. Testing this hypothesis would require a comparison of projection errors in different forecasts of similar lengths. For example, if the projections made in the 1970s for 10 years into the future had errors larger than comparable 10-year projections made in the 1980s, this alternative explanation might possibly be correct.
Detailed comparisons of this type for a range of projection lengths found only weak support for this hypothesis.7 Forecasts made in the 1970s appear to have somewhat greater error, at each projection length,
|
6 |
Sources of error might be classified systematically into such categories as model misspecification, errors in parameter estimates, errors in expert judgment, and random variation (Alho, 1990). However, such categories are not always empirically distinguishable. |
|
7 |
Still another possible factor—that more recent periods may have become easier to project—is apparently not a significant source of variation in error either. See Appendix B for the analysis. |
than some forecasts made in the 1990s. But the differences, although significant, were small relative to those shown in Figure 2-2. Earlier research established that, in the 1950s and 1960s, forecasts improved over time. Keyfitz (1981:584) assessed the accuracy of population growth rates projected in U.N. forecasts made in 1958, 1963, and 1968 and concluded that “forecasts of the late 1960s showed only about two-thirds the error of those of the late 1950s” (see also Stoto, 1983:Figure 2; El-Badry and Kono, 1986). Improvements on this scale are not evident in subsequent forecasts, starting with those of the 1970s. We therefore conclude that the downward trend in the magnitude of error since 1970 is largely attributable to the length effect, i.e., to the fact that the earlier forecasts of world population size by the year 2000 were anticipating events further into the future.
Figure 2-3 plots mean absolute errors by projection length for all countries, as well as for countries in six world regions. As expected, the magnitude of these absolute percentage errors increases steadily as the projection interval lengthens. The mean error in country projections anticipating population size 5 years ahead is less than 5 percent. Error increases by about 2.5 percentage points each time a projection extends an additional 5 years, and the mean error for projections looking 30 years ahead is 17 percent.8
Baseline Error
A notable feature of these results is that, even in projections looking zero years ahead, errors are not negligible. This means that past projections often started off with an incorrect baseline population. The demographers who made these projections naturally used their best estimates of the “current” population size. But they were working with incomplete information—generally data a few years old, or even censuses or other estimates from earlier decades—and, in retrospect, their estimates turned out to be mistaken.
Over time, as information has accumulated from new censuses and other sources, the agencies making projections have retroactively revised their estimates of population size at given points in the past. For instance, the estimate of the world population in 1950 changed 17 times—13 times upward and 4 times downward—in U.N. Demographic Yearbooks published from 1951 to 1996. Revisions of this type can be large for particular countries. Historical demographic data are not fixed once and for all, because new findings and interpretations alter the picture we have of the past.
|
8 |
The means in Figure 2-3 were estimated across 10 projection exercises made between 1974 and 1992. Medians are somewhat lower, beginning at 2 percent for 5-year projections and increasing by 2 percentage points each time projections cover an additional 5 years. |
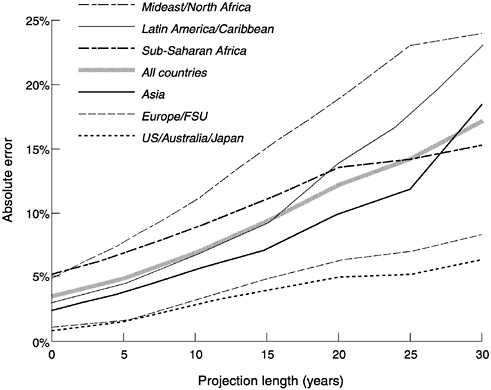
FIGURE 2-3 Mean absolute error in country population projections, by projection length and region.
SOURCE: See Appendix B.
Nevertheless, as Figure 2-3 shows, base population error is generally small: on average about 3 percent across countries. Moreover, the magnitude of base error is declining as the number and accuracy of censuses increases. Two recent forecasts (the 1990 World Bank and 1994 U.N. forecasts) had mean base population errors averaging just 2 percent across countries. In general, the contribution of baseline error to the total error declines as projection length increases, and in the long run the length effect dominates.9
|
9 |
Base population error accounts for most of the error in short projections. In a 5-year projection, at least 60 percent of the bias in the projected population can be explained by base population bias. In a 10-year projection, the variance explained by base population bias drops to about 40 percent, in a 20-year projection to about 20 percent, and in a 30-year projection, to about 10 percent. The declining importance of the base population is demonstrated mathematically for the general case in Cohen (1979). |
Geographic Area
Projection error also varies across regions (see Figure 2-3). Absolute error is smaller for industrial regions than for the four developing regions represented, and this is true at each projection length. Among developing regions, the error is greatest for countries in the Middle East and North Africa, for which 25-year projections are almost 25 percent off, on average, in either direction. Unpredicted flows of international migrants are an important part of the reason for this.
Some reasons why developing-country projections should be less precise are obvious. The demographic data for developing countries are often more limited and unreliable, and this was especially true at the time the earliest forecasts were conducted. In addition, fertility and mortality are higher in developing countries, so that projection assumptions have greater scope for being wrong.10
Figure 2-3 does not indicate the direction of projection errors. For most of these regions, projections have been too high rather than too low. As is the case for world projections, the bias in regional projections is smaller than the absolute error because country-level errors offset one another. Regional biases have mostly been no further away from currently estimated values than 5 percent on the high side or −2 percent on the low side. On the low side are projections for the Pacific Rim industrial countries (the United States and Canada, Australia and New Zealand, and Japan), the Middle East and North Africa (in shorter projections only), and Sub-Saharan Africa (in long projections of 30 years only). Notably large biases on the high side appear for Latin America and the Caribbean.
Population Size
Absolute error is inversely related to population size. Forecasters tend to pay less attention to, and even sometimes leave out, the smallest countries and take special care with the largest countries. As a result, projections are less precise for smaller than for larger countries. For instance, average absolute error in 20-year projections ranges from 19 percent for countries under 1 million to just 4 percent for huge countries of 100 million or more. Since these huge countries account for about 60 percent of world population, this relative accuracy contributes substantially to the accuracy of world projections.
|
10 |
This is shown in Appendix B, in which initially higher total fertility and lower life expectancy are associated with greater errors in projected component rates. |
PROJECTED AGE STRUCTURES
Much of the error in projected population is in projections of the very young and the very old. At intermediate ages, roughly between ages 15 and 64, projections of future numbers tend to be quite precise, with errors for major world regions that do not exceed 2 percent in either direction.11
U.N. population projections for Europe and Northern America combined illustrate the concentration of error at extreme ages (Figure 2-4). Forecasts dating back to 1965 have overprojected the number of children in these regions, and the upward bias has been greater the longer the projection. At the same time, these forecasts have underprojected the oldest age groups, and the downward bias has also been greater the longer the projection. In 15-year projections, for example, the population under age 5 have been overprojected by 12 percent, and the population aged 80 and older has been underprojected by 12 percent. 12
Among developing regions, a similar pattern of error appears, although it is less pronounced (Figure 2-5). The positive bias in projections of the youngest age groups is just slightly greater than the bias at other ages, while the negative bias is clearly marked at the oldest ages. In addition, a small positive error appears among young adults up to age 39 and an increasingly negative, but still small, error at ages 40 and older.
This pattern of overprojection of numbers of infants and young children and underprojection of numbers of older people is notably consistent when world regions are examined separately. It does not apply, however, to every country. In projections for large countries, China shows a reverse pattern, with a downward bias at the youngest ages and upward bias at the oldest. In projections for India and the United States, downward bias is evident at both ends of the age structure. In projections for Brazil, upward bias appears at both extremes. And in projections for Nigeria, positive bias is quite substantial at all ages (although especially at the youngest ages), given the large downward revisions in population estimates—almost 30 percent —dictated by the 1991 census.
|
11 |
This is illustrated for past U.N. projections in the next two figures. The intermediate age group with low error tends to be smaller in longer projections. In a 20-year projection, for instance, it would include those aged 20-64, in a 25-year projection those aged 25-64, and so on. |
|
12 |
This pattern of age-group errors has not been confined to international forecasts. A similar pattern appears in projections prepared by national statistical agencies in Canada, Denmark, the Netherlands, Norway, and the United Kingdom (Keilman, 1997). |
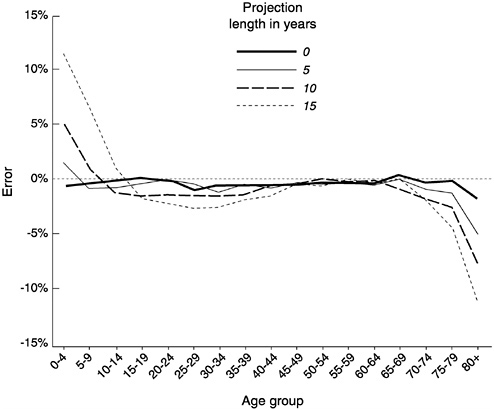
FIGURE 2-4 Mean percentage error by age group and projection length: Europe and Northern America combined.
SOURCE: Calculated for U.N. forecasts from 1965 to 1990, following Keilman (1998).
PROJECTED COMPONENT RATES
Besides being due to inaccurate baseline data, errors in projections of population size and age structure are also due to misspecified trends in fertility, mortality, and migration. Later chapters provide detailed discussion of trend errors in component rates. The main findings are as follows:
-
Fertility. Projections of total fertility for industrial countries have been somewhat too high, by 1.5 percent on average in 5-year projections and up to 4.5 percent in 20-year projections. Fertility projections for developing countries have been generally too high also, particularly for countries in the Middle East and North Africa. For Sub-Saharan Africa, however, shorter projections have been about right but longer projections somewhat low.
-
Mortality. Insufficient mortality decline has been projected for most
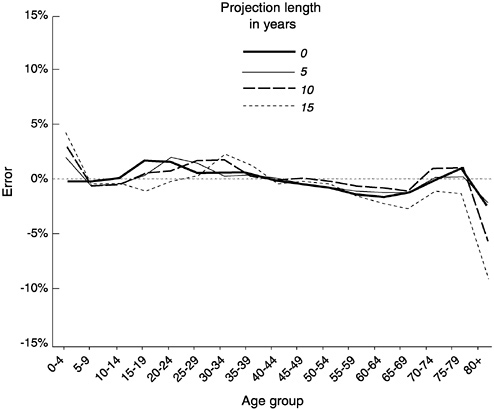
FIGURE 2-5 Mean percentage error by age group and projection length: Asia, Africa, and Latin America combined.
SOURCE: Calculated for U.N. forecasts from 1965 to 1990, following Keilman (1998). Because of the way regions are defined in various U.N. projections, the developing countries treated as a group in this figure do not include developing countries in Oceania and have added to them one industrial country, Japan.
-
regions. Life expectancy has improved more rapidly than the forecasters usually anticipated. The exception is Sub-Saharan Africa, for which projected life expectancies have been too high—almost 5 years too high in 20-year projections. In this region, weak economic growth, slow development of health systems, and the HIV/AIDS epidemic may all have contributed to slower than expected mortality decline.13
|
13 |
If the former Soviet Union were treated as a region, it would also be an exception. Life expectancy has stayed in a narrow range between 67.5 and 69.5 since 1970, instead of increasing, as all projections since then have assumed. |
-
Migration. Net migration has been poorly projected; its direction has been correct in only 60 percent of the cases, and even in these cases, the projected figure is often too high or too low. Nevertheless, net migration rates, for most countries in most periods, are small enough so that many of these errors do not much affect projected population growth. Some errors, however, have been quite large, such as failures to anticipate the relatively sudden flows of labor to the oil-rich countries, the explosive movements of migrants away from regions of conflict or natural disaster, and the difficult to anticipate return movements of such crisis migrants. Because of such crises, net immigration or net emigration rates have exceeded 5 percent annually in some periods over the past three decades in a few countries, mainly small ones, such as the United Arab Emirates and Liberia. Large-scale migrations in these instances have led to visible error in projected population, particularly in the Middle East and North Africa.
-
Relative importance. These errors in the projected components of population growth have varying impact on projected population. This impact and the impact of error in the base population are summarized in Figure 2-6, which partitions the variance in projection error across countries. 14 Base-population error contributes substantially to projection error in the short run, but its contribution declines with longer projections. The role of error in the components of growth increases with projection length and, in 30-year projections, accounts for more than 5 times as much variance as base-population error. Misspecification of fertility accounts for three to four times as much projection error as does misspecification of mortality. Migration error explains as much or more projection error as fertility error, although its effect is relatively constant across projection lengths, unlike the increasing effect of fertility error.15
Misspecified trends in fertility, mortality, and migration are visible as errors in different parts of the projected age structure. At the youngest ages, underprojection of fertility decline produces projected cohorts that are larger than the actual numbers (as does underprojection of reductions in infant mortality; see Figure 2-4 and Figure 2-5). At the oldest ages, underprojection of mortality improvements produces cohorts that are too small.
14
Mean bias (across all 5-year periods in the projection interval) in total fertility, life expectancy at birth, and the net migration rate is used in the regression analyses that produced this partitioning. Not all the variance is explained, because of the use of mean rates rather than the rates for each 5-year period within each interval, and also because age-specific rates and the age structure are not in the equations.
15
The importance of migration error is one reason why country projections appear worse than world projections. As long as net migrants in a forecast total zero across countries, as they should, the world projection has no migration error.
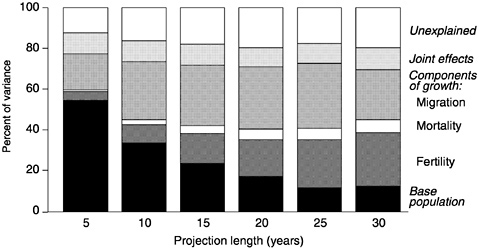
FIGURE 2-6 Variance of the error in projected population accounted for by different factors, by projection length.
NOTE: Based on calculations and data sources in Appendix B. Some variance is unaccounted for because the regressions on which this partitioning is based used component means across periods and did not include the initial age structure or the age structure of component rates.
-
At young adult ages, underestimates of international migration lead to slightly underprojected numbers in industrial countries and slightly overprojected numbers in developing regions. This is due to the fact that migrants tend to be young adults of working age.
-
Reasons for inaccurate component trends. Three general factors appear to explain errors in component trends. Base error is the first factor. A misspecified trend, whether in fertility, mortality, or migration, often begins with a mistaken estimate of the initial level. This accounts for half the explained variance in projected total fertility, as well as in projected life expectancy. Base error could have been reduced with better data and more precise methods of estimation. Component trends appear to have been more accurately specified when data were more available—when recent surveys were available to provide total fertility rates, or recent censuses from which one could estimate life expectancies.
A second factor is the level of the component rates in question. Higher fertility and mortality are related to more frequent misspecification of trends. This may be partly because the range for error is simply greater, but is probably also partly due to the existence of weaker statistical systems in countries with higher fertility and mortality. As fertility and mortality decline worldwide, the possible errors in specified trends could diminish and have less impact on projected population size.
A third factor in the misspecification of component trends is simply the period the projection covers. Component rates have been more difficult to predict for some periods than for others, and the 1990s have been particularly troublesome. As we show in later chapters, fertility has taken unexpected turns, and large, sudden flows of migrants, such as refugees, have become relatively more frequent.
CONCLUSIONS
Projection Error
From 1958 onward, the error in U.N. projections of the world population to 2000 has averaged 2.8 percent. Errors in country projections have typically been substantially larger. The greater accuracy of world projections over country projections stems in large part from the absence of migration error in world projections and the way other country errors cancel one another.
World projections have gained in accuracy from the care taken to separately project individual countries. Could they be just as accurate if they were directly calculated rather than constructed by summing up country projections? The data to answer this question are not available, because agencies do not normally make both types of projections simultaneously. To be equally accurate, however, such direct world projections would have to have substantially less proportional error than typical country projections, just as projections for the largest countries have less proportional error than projections for the smallest countries. Presumably, therefore, the base data for the world as a whole would have to be better, or the prediction of future trends in component rates more precise, than for the largest countries. Either of these is possible but does not seem likely,16 and since country forecasts are also important and need to be produced, the issue may be moot.
Projection error increases systematically as projections look further ahead. Absolute error has varied from 4.8 percent on average in 5-year projections to 17 percent in 30-year projections. Projection error has also been larger in developing than in industrial countries and has been inversely related to population size.
Error in projecting a country's population is generally the result of error in regard to particular age groups. Estimates for the youngest and the oldest age groups tend to be the least reliable. These errors in turn
|
16 |
For instance, component trends for an aggregate require complicated adjustment to allow for the fact that the more rapidly growing among the subpopulations will have increasing impact on component levels over time. |
have been the result of somewhat overprojected fertility, which produces too large numbers of infants and young children, and overprojected mortality, which produces too small numbers of the elderly.
Mistaken trends in fertility, mortality, and migration are the primary reasons for error in longer projections; they are considered in the following chapters. In shorter projections, however, errors in baseline estimates are much more important. To avoid baseline errors, forecasters need to use the best current data, analyzed as carefully as possible and updated as soon as possible when new information becomes available. Practice in this regard varies among international agencies making world projections,17 but continual updating does appear to be possible. The fastest possible updating schedule, consistent with thorough examination of reported data, is clearly to be preferred and should be coupled with rapid dissemination of basic results, perhaps over the Internet.
Research Priorities
These conclusions, derived from a comparison of past projections with the subsequent demographic record, may require modification as that record is extended into the 21st century. Periodic reassessments are clearly important. While the data contain hints that the 1990s forecasts improved on earlier ones, further research will be needed to establish this.
This chapter did not undertake detailed comparisons of projection results across agencies, which rely on slightly different and continually evolving procedures. (These procedures are described further for each component of population change in the following chapters.) Nor did it assess the relative advantages of projecting units versus aggregates: countries versus world regions, for instance, or versus the world as a whole, or subregions within countries versus countries. Such methodological issues require further research.
Future demographic conditions could in principle diverge substantially from conditions that prevailed during the periods covered by past forecasts. A statistical review of past accuracy is therefore an imperfect guide to future accuracy. An assessment is needed of the basis for past demographic trends—in fertility, mortality, and migration —and the con-
|
17 |
The U.S. Census Bureau and IIASA appear to update only after several years on somewhat indefinite schedules. The U.N. revises its estimates and projections on a 2-year cycle, which can be extended by publication delays. Thus projections that are given a particular date may not incorporate all the data that became available in that year and may not be published until the following year. The World Bank essentially updates continually, so that the country projections used in the organization always rely on the latest available data. However, only summary results are now published, and only on an annual basis. |
sequent likelihood that they will be duplicated in the future. This is the issue for the following chapters.
REFERENCES
Alho, J.M. 1990 Stochastic methods in population forecasting. International Journal of Forecasting 6:521-530.
Boudon, R. 1986 Theories of Social Change: A Critical Appraisal. Cambridge: Polity Press.
Cohen, J. 1979 Ergodic theorems in demography. Bulletin (New Series) of the American Mathematical Society 1(2):275-295.
El-Badry, M.A., and S. Kono 1986 Demographic estimates and projections. Population Bulletin of the United Nations 19/20:35-44.
Keilman, N. 1997 Ex-post errors in official population forecasts in industrialized countries. Journal of Official Statistics (Statistics Sweden) 13(3):245-277.
1998 How accurate are the United Nations world population projections? Population and Development Review 24(Supplement):15-41.
Keyfitz, N. 1981 The limits of population forecasting. Population and Development Review 7(4):579-593.
1982 Can knowledge improve forecasts? Population and Development Review 8(8):579-593.
Long, J.F. 1995 Complexity, accuracy, and utility of official population projections . Mathematical Population Studies 5(3):203-216.
Nagel, E. 1961 The Structure of Science: Problems in the Logic of Scientific Explanation . New York: Harcourt, Brace and World.
Stoto, M.A. 1983 The accuracy of population projections. Journal of the American Statistical Association 78(381):13-20.
United Nations (U.N.) 1999 World Population Prospects: The 1998 Revision, Vol. 1, Comprehensive Tables. New York: United Nations.
Willekens, F.J. 1990 Demographic forecasting: State-of-the-art and research needs. Pp. 9-66 in C.A. Hazeu and G.A.B. Frinking (eds.), Emerging Issues in Demographic Research. Amsterdam: Elsevier.


