
4
Posttransition Fertility
By 1995, half of the world's 5.7 billion people lived in low-fertility countries, in which fertility was under 2.5 children per woman. Most lived in countries in which fertility was at or below replacement level (i.e., approximately 2.1 children), and a large minority (15 percent of the world total) lived in countries in which fertility was well below replacement level (below 1.8 children). What will happen in the future? Do the lowest levels of contemporary fertility portend the future for most countries? Will fertility decline even further toward zero in the 21st century, driven by the same forces that produced the fertility transition? Or will homeostatic mechanisms raise fertility back toward replacement level, or even higher? Will countries now in transition stabilize at fertility levels well above two children per woman, or below? The answers to these questions are central to projecting future population trends.
We address these questions below and reach two broad conclusions:
-
Stabilization levels for countries now in fertility transition or not having started it will be similar to those observed in contemporary low-fertility countries, around or somewhat below two births per woman. Just as fertility varies by a fair amount across today's low-fertility countries, those countries currently in transition are also likely eventually to experience varying, albeit generally low, fertility levels.
-
In all countries, once low fertility levels are reached, further fertility change is largely indeterminate. For any given date in the future, fertility levels are quite unpredictable, and substantial variability is likely. Nevertheless, some limits to possible variation can be set, because low-
-
fertility countries are unlikely to experience sustained fertility well above two children per woman, and homeostatic mechanisms have the potential, with considerable lag, to counteract very low fertility.
FERTILITY LEVELS AND PAST TRENDS
For perspective, we begin with a description of recent (post-1950) fertility in posttransition countries, i.e., in countries in which fertility control is widespread and aggregate total fertility1 in 1995 was around two children per woman, more specifically under 2.5 children. Among these low-fertility countries were all the countries of Europe except Albania, as well as Northern America, Japan, Australia, and New Zealand. Combined, the 42 industrial, low-fertility countries contain 21 percent of world population. Two out of three of these countries actually had fertility levels under 1.8 children, or well below levels needed for population replacement (Table 4-1).
In the developing regions, low-fertility countries are geographically dispersed. China, with 22 percent of world population, is the largest country in this group. Eighteen other countries, from the Caribbean to Central Asia, add 9 percent of world population to the low-fertility group.2 Fertility was above 2.1 (but below 2.5) in more than half of these developing countries.
Figure 4-1 shows the path these countries have taken to these low levels. For the Asian low-fertility countries, fertility had to decline dramatically between 1950 and 1995 to reach low levels. For the current low-fertility countries of Latin America and the Caribbean, fertility declines were also sharp, although less dramatic.
For the industrial countries, fertility decline has been more moderate. These countries include the only 11 countries that had low fertility in 1950. In fact, most industrial countries have been at or somewhat close to low-fertility levels since that date.
|
1 |
To measure fertility levels and changes, we use the total fertility rate (TFR), calculated by summing age-specific rates for women aged 15-49 in a given time period. Attractive features of this measure include its wide availability, straightforward interpretation (i.e., the number of children a hypothetical group of women would bear if they experienced these rates over their reproductive lifespan), and standardization on the age structure of women of childbearing age. We later discuss the quantum and timing components of such period-fertility measures. The specific rates on which the discussion is based are, strictly speaking, for the period 1990-1995. |
|
2 |
Zeng (1996) argues that important Chinese data sources underestimate fertility. Nevertheless, after adjusting for underreporting, he estimates that Chinese fertility was still at about the replacement level in 1990-1992. |
TABLE 4-1 Low-fertility countries by region, their populations, and their shares of world population, by level of total fertility, 1990-1995
|
No. of countries |
Population (millions) |
Percent of world population |
|||||||
|
Total fertility: |
Total fertility: |
Total fertility: |
|||||||
|
Region |
<2.5 |
<2.1 |
<1.8 |
<2.5 |
<2.1 |
<1.8 |
<2.5 |
<2.1 |
<1.8 |
|
Industrial regions |
42 |
38 |
28 |
1,168 |
1,158 |
796 |
20.6 |
20.3 |
14.0 |
|
Eastern Europe |
10 |
9 |
7 |
310 |
306 |
262 |
5.5 |
5.4 |
4.6 |
|
Northern Europe |
10 |
9 |
5 |
93 |
93 |
71 |
1.6 |
1.6 |
1.3 |
|
Southern Europe |
10 |
9 |
7 |
140 |
138 |
127 |
2.5 |
2.4 |
2.2 |
|
Western Europe |
7 |
7 |
7 |
181 |
181 |
181 |
3.2 |
3.2 |
3.2 |
|
Northern America |
2 |
2 |
1 |
297 |
297 |
30 |
5.2 |
5.2 |
0.5 |
|
Australia/New Zealand |
2 |
1 |
0 |
22 |
18 |
0 |
0.4 |
0.3 |
0.0 |
|
Japan |
1 |
1 |
1 |
125 |
125 |
125 |
2.2 |
2.2 |
2.2 |
|
Developing regions |
19 |
9 |
5 |
1,711 |
1,346 |
60 |
30.2 |
23.7 |
1.1 |
|
China |
1 |
1 |
0 |
1,221 |
1,221 |
0 |
21.5 |
21.5 |
0.0 |
|
Other East Asia |
4 |
3 |
2 |
74 |
52 |
45 |
1.3 |
0.9 |
0.8 |
|
South Asia |
3 |
2 |
1 |
80 |
62 |
3 |
1.4 |
1.1 |
0.1 |
|
West Asia |
2 |
0 |
0 |
316 |
0 |
0 |
5.6 |
0.0 |
0.0 |
|
Caribbean |
7 |
3 |
2 |
17 |
12 |
11 |
0.3 |
0.2 |
0.2 |
|
South America |
2 |
0 |
0 |
4 |
0 |
0 |
0.1 |
0.0 |
0.0 |
|
Total |
61 |
47 |
33 |
2,879 |
2,503 |
856 |
50.8 |
44.0 |
15.1 |
|
Source: United Nations (1999). |
|||||||||
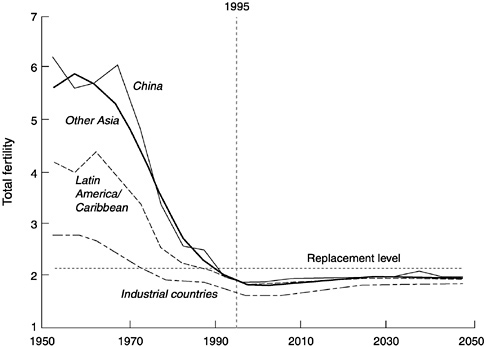
FIGURE 4-1 Past and projected total fertility in low-fertility countries, 1950-2050.
SOURCE: Data from United Nations (1999).
Nevertheless, the industrial countries also show relatively substantial fertility decline, as well as some heterogeneity. Total fertility for the group as a whole fell from 2.5 children in the 1950s to below 2.1 in the early 1970s to approximately 1.7 in the early 1990s.3 Declines were most dramatic in the late 1960s and early 1970s. These declines were pervasive, taking place in Northern America, Japan, Australia and New Zealand, and all subregions of Europe (United Nations, 1999:Table A-20). Most regional declines were over one birth. Somewhat smaller declines were registered only in regions that had lower fertility to begin with, particularly Northern and Western Europe. By 1990-1995, with all the industrial regions below levels needed for population replacement, fertility remained highest in Northern America (2.02), Australia and New Zealand (1.91), and Northern Europe (1.81).
|
3 |
For many of these countries, using 1950-1960 as a referent can be problematic because of what many see as the unique set of circumstances that produced fertility increases following World War II. This baby boom peaked around 1960. At this peak, fertility was higher, for a number of European countries, than it had been in the 1920s and 1930s. |
The particular countries with fertility levels above 2.0 are a heterogeneous group. In addition to Albania, they include Macedonia, Moldova, Sweden, Iceland, New Zealand, and the United States. Likewise, countries with the lowest fertility, below 1.5 children (as of 1990-1995), are not obviously similar: Germany (especially the former East Germany), Austria, Slovenia, Greece, Italy, and Spain. More recent evidence indicates that Russia and Japan have joined this group. We see little evidence that the richest countries in the industrial world have the lowest fertility, or the highest. Thus the experience of low-fertility countries over the last few decades has been heterogeneous and not necessarily easy to project.
Internally, fertility levels in these countries may also be heterogeneous. Ethnic and racial differences in fertility (which may partly account for fertility variation across societies) to some extent reflect the socioeconomic standing of different groups, but can also reflect long-standing differences. The contrasts in fertility in the United States between European-origin whites and African Americans, for example, have been relatively stable for three decades and are not entirely socioeconomic in origin (Swicegood and Morgan, 1994). These differences also reflect contrasts in gender relations and marriage and family institutions between ethnic groups. Many other examples exist of minority-majority group relations that involve fertility differences. These fertility differences may have a long history, as with the high fertility of ultraorthodox Jews in Israel (Friedlander and Feldmann, 1993), and may be rooted in distinctive cultures and promoted for political reasons, as with Malays, Chinese, and Indians in Malaysia (Govindasamy and DaVanzo, 1992).
PROJECTED FERTILITY TRENDS
Figure 4-1 also shows the trends the U.N. projects for future fertility in low-fertility countries. These trends are quite similar across countries. The similarity is produced by standard projection procedures that allow relatively minor variation.
Projection Methods
To project fertility where it is now at or below the level required for population replacement, the U.N. allows any trend in total fertility to continue for one 5-year period, and then requires fertility to change by 0.07 children every 5-year period until it reaches a predetermined level at which it is kept constant. This level is defined as 1.9 children, for countries in which fertility is between 1.5 and 2.1 children, or 1.7 children, for
countries in which fertility is under 1.5 children (Zlotnik, 1999). 4 In long-run projections to 2050, the distinction between stabilization levels of 1.9 and 1.7 produces the only meaningful country variation. 5
Countries that have not reached low levels of fertility are assumed to eventually stabilize at levels that would produce approximate replacement of the population (assumed by the U.N. to be 2.1 children per woman). How soon they reach that level is a complex question resolved subjectively, taking many factors into account (see Chapter 3).
Alternative projections from the World Bank are quite similar, although slightly simpler. Countries that have fertility below two children per woman are assumed to stay at their current levels for two 5-year periods, and then return to replacement level (around 2.1 children, but calculated exactly taking mortality into account), following a linear path, by the year 2030. Countries that are above the replacement level are assumed to reach it eventually, the timing depending on current level and the past pace of declines (see Chapter 3). In a few cases in which recent fertility declines have been particularly rapid, fertility is allowed to dip below the replacement level before returning to that level. Once the replacement level is reached, fertility stays at that level, although it continues to vary slightly as mortality changes.
Neither agency makes systematic use of time-series approaches in projecting fertility (e.g., Carter and Lee, 1986; Thompson et al., 1989; Alho, 1992). While something can be learned from such models, particularly with regard to the future variability of fertility (see Chapter 7), their broad application is limited by data needs and demanding procedures, and they do not obviate the need to exercise judgment.
The Assumption of Falling Fertility
The U.N. and World Bank approaches return us to two questions raised earlier: whether it is reasonable, as both assume, for high or moderate fertility always to decline to replacement level or below, and whether subsequent fertility should be kept constant, and if so at what level. The first issue is considered in this section, the second in the remainder of the chapter.
|
4 |
Cohort fertility may be taken into account in a limited manner. Where completed fertility is known for women born in 1962, the stabilization level is instead the average of this figure and either 1.9 or 1.7. What is described is the medium-variant U.N. projection. High and low variants assume stabilization levels that are 0.4 children higher or lower, but 0.5 children higher or lower for countries that have not reached replacement. |
|
5 |
The U.N. assumes an eventual return to replacement in all regions in its long-range projections, beyond 2050. This assumption acknowledges the likely operation of homeostatic mechanisms over the very long term. |
TABLE 4-2 Classification of countries by total fertility in 1950-1955 and 1990-1995
|
Total fertility 1950-1955 |
|||||
|
Total fertility 1990-1995 |
4.5+ |
3.5-4.4 |
2.5-3.4 |
Under 2.5 |
Total |
|
4.5+ |
66 |
1 |
0 |
0 |
67 |
|
3.5-4.4 |
20 |
0 |
0 |
0 |
20 |
|
2.5-3.4 |
28 |
3 |
1 |
0 |
32 |
|
Under 2.5 |
17 |
11 |
24 |
12 |
64 |
|
Total |
131 |
15 |
25 |
12 |
183 |
|
Source: United Nations (1999). |
|||||
The assumption that fertility, in high-fertility countries, will eventually fall close to two children per woman is generally supported by previous experience. In few countries has fertility decline, once started, paused for more than a few years at intermediate levels. Once past these levels and down close to replacement level, fertility has never moved back up and stabilized at substantially higher levels. Countries currently in transition give no indication either of fertility stabilizing at high or intermediate levels.
Table 4-2 illustrates these points, showing how fertility changed from 1950-1955 to 1990-1995. Of the 12 countries with low fertility (under 2.5 children) in the 1950s, all still had low fertility in the 1990s. The same point could be made if other periods had been selected. For instance, of the 32 countries in 1970-1975 with low fertility, all still had low fertility in 1990-1995. Thus no precedent exists for a low-fertility country to return to persistent fertility levels well above two children per woman.
Consider next the 25 countries with intermediate fertility (2.5-3.4) in 1950-1955. Of these, 24 had low fertility by 1990-1995. Only Argentina did not achieve low fertility: its total fertility was 3.2 in 1950-1955, 3.1 in 1970-1975, and 2.8 in 1990-1995. The reasons for Argentina 's apparent stabilization at this intermediate level (or at least very slow decline) are unclear. Such apparent stabilization above two children per woman must be characterized as rare.
Of the 15 countries with moderately high levels of fertility (3.5-4.4) in 1950-1955, all but one moved to lower fertility, with most achieving low fertility under 2.5 by 1990-1995.6 The one exception was Gabon, where
|
6 |
The three countries whose fertility declined only into the intermediate range (2.5-3.4) were Israel, the Bahamas, and Jamaica. All three show clear evidence of recent fertility decline, suggesting that fertility in these countries has not yet reached a stable level. |
fertility in the 1950s and 1960s had been substantially depressed by pathological subfecundity and infertility. Even the countries with high fertility (4.5 or higher) in 1950-1955 had substantially lower levels by 1990-1995. For these countries, much of the transition remains unobserved, but its inevitability, based on the experience of other countries, seems clear. Except possibly in rare cases, fertility will not stabilize at levels well above two children per woman. Instead, it will continue to decline, although at an uncertain pace, until levels close to two children per woman are reached.7
Projection Accuracy
While the general trend therefore appears well established, specific future levels are difficult to predict. Figure 4-2 shows the error in projected total fertility, beginning with periods when total fertility was below 2.5. The “combined” error is averaged across all countries with these low levels of fertility in eight separate U.N. and World Bank forecasts.
Fertility has on average been overprojected. Forecasters have anticipated less fertility decline than took place, even at these low levels. Projected fertility decline has fallen short of actual decline to a greater degree, in fact, than for developing countries earlier in fertility transition. In 20-year projections, for instance, projected total fertility has been on average 0.39 children too high, whereas in cases in which initial total fertility was above 2.5, projected total fertility was on average 0.27 children too high (see Table 3-1). The overprojection has been greater, however, when fertility was closer to 2.5 than when it had already declined further.8
While forecasters therefore have had a good understanding of the general downward trend in fertility, they have not had a precise grasp of the pace of decline. Current projections presumably also incorporate some uncertainty. This can be estimated from the results of past forecasts using
|
7 |
For additional evidence of persistent decline once a transition is under way, see Bongaarts and Watkins (1996). A counterargument is that countries currently with high fertility are predisposed in that direction and fundamentally different from those that have completed the transition. The same argument about the imperviousness of high-fertility levels has been made in the past, in the 1950s, for instance, about South Korea, and in the 1970s about Bangladesh. The argument has not held up. The pace of decline in countries starting transition later could be slower, as suggested in Chapter 3, but all the evidence suggests that, eventually, low fertility will be reached. |
|
8 |
This upward bias does go together with greater precision, given that fertility at low levels varies within a narrower range. Absolute error in projected total fertility averages 0.29 in 10-year projections and 0.41 in 20-year projections, as contrasted with 0.57 and 0.79 at higher initial fertility levels (see Table 3-1). |
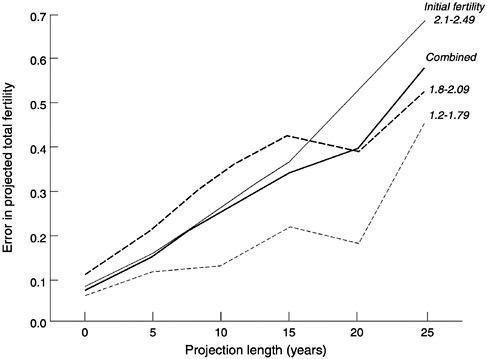
FIGURE 4-2 Error in projected total fertility averaged across countries and forecasts, for cases in which the initial level was under 2.5.
SOURCE: See Appendix B. Error is defined as the difference between projected total fertility and the current estimate.
ex post methods, as illustrated in Chapter 7 (see Figure 7-4). At least as important for improving projections, however, is understanding the characteristics of fertility trends and the reasons for them.
INTERPRETING FERTILITY TRENDS
At low fertility levels, fertility trends have had three important characteristics.
First, in the main they are best characterized as period trends as opposed to cohort ones. That is, they have not reflected the changes in fertility due to one cohort or generation of women with different tendencies succeeding another. Instead, they have reflected contemporaneous changes in fertility, in given periods, by women of all ages. Different cohorts do end up with different numbers of births, spaced differently, but period factors can generally explain these contrasts.
Second, fertility trends have involved both reductions in the total
numbers of births that women have and changes in the timing of these births.
Third, the births reduced in number have been mainly third, fourth, and higher-order births rather than first or second births. Much of the apparent decline in first and second births can be attributed to delay or postponement.
We discuss these characteristics specifically with reference to industrial countries. Although we anticipate that fertility in demographically advanced developing countries will have similar characteristics, these countries have not been at such levels long, so relevant data are limited.
Period Versus Cohort Effects
Changes in post-1950 fertility in industrial countries were largely period-driven. In calendar years when fertility increased, it did so for all age groups; when it declined, the decline was pervasive (Ni Bhrolchain, 1992; also see Brass, 1974; Page, 1977; Namboodiri, 1981; Pullum, 1980; Rindfuss and Sweet, 1977; Sweet and Rindfuss, 1983; Rindfuss et al., 1988; Foster, 1990). The pattern of change suggests that the unique experiences of birth cohorts were not highly relevant for fertility change.9
Highly plausible arguments for cohort influences on fertility have been made by Ryder.10 Surely the shared experience of each generation of parents should shape their fertility. For example, a war should have a distinct and lasting impact on the generation at the age of enlistment. In addition, it is argued, people of different ages react differently to contemporaneous events. While younger people may adopt innovations aggressively, older people are less able and willing to change. Their past experience and their investments in the status quo reinforce their inertia.
Despite the appeal of these arguments, attention to cohort processes generally does not help clarify aggregate fertility trends. Fertility change can be so rapid that it cannot be accounted for by the replacement of one cohort by another. More parsimonious explanation usually comes from positing powerful period effects that produce pervasive changes across all cohorts simultaneously.
|
9 |
Likewise, demographic models of cohort-specific age patterns of behavior have not provided accurate predictions of cohort levels of childlessness and nonmarriage (see Chen and Morgan, 1991; Rodgers and Thornton, 1985). |
|
10 |
Ryder argues that a cohort perspective is crucial not only to understand fertility (Ryder, 1964, 1986) but also to understand social change generally (Ryder, 1965). Demographers' bias toward cohort approaches may account for their consistent tendency (see Freedman, 1986a, 1986b) to underestimate the speed of social change. |
Could fertility intentions reflect a cohort dimension that could bring more certainty to future predictions? A brief review of the use of data on fertility intentions provides little optimism. In the 1960s, U.S. researchers investigated women's future fertility intentions as indicators of completed cohort fertility. For instance, if a 25-year-old woman had one child and responded that she intended to have two more children, then demographers projected her completed family size as three. Her intentions could reflect relatively stable cohort-based plans that, in time, would be acted on. Initially, the predictions worked. Despite substantial errors at the individual level, for a series of birth cohorts such errors canceled each other, leaving aggregate cohort predictions on target. However, beginning with cohorts born in the 1940s and 1950s, errors at the individual level cumulated to produce estimates of fertility that were much too high (Westoff and Ryder, 1977b).
A plausible explanation for this failure of prediction is that those asked whether they wanted another child assumed that social conditions would not change radically. Answering this question in the 1960s and early 1970s, most did not anticipate how antinatalist forces would dominate in the following years. Their fertility intentions, therefore, were no more predictive than their concurrent fertility behavior (Westoff and Ryder, 1977a, 1977b). One cannot tell if fertility postponed will be realized (a timing shift) or forgone (a quantum shift).11 Further, the life-course perspective suggests that delay may allow period influences to operate, as couples accumulate experience that leads first to uncertainty about additional children and eventually to a decision to revise future fertility downward. Thus, if one must use fertility-intention data to provide guidelines to future fertility, one must do so with great care. Certainly, the assumption that such responses reliably predict cohort reproductive behavior is not consistent with available evidence.
Despite this evidence, many forecast agencies in industrial countries, while acknowledging the importance of period effects, also monitor cohort fertility. For instance, some extrapolate completed cohort fertility, in addition to total fertility. They assume that a smooth time series for completed cohort fertility reflects long-term structural changes, and that total fertility fluctuates around that long-term trend. Whether this added indicator is useful for long-term forecasts remains an open question.
|
11 |
Bongaarts (2000:Figure 3) shows that, for a set of 14 low-fertility countries, the current period fertility is well below reports of desired family size. It is unclear whether fertility will be made up in the future (i.e., at older ages) or if individuals will have fewer children in their life than they desired at a younger age. |
Effects of Changes in the Timing of Childbearing
Period changes in fertility have reflected changes both in the total number of children per women (the quantum component) and the timing of childbearing (the tempo component). Most attention has been focused on the quantum component, but the tempo component has also had a large role in fertility trends. Tempo effects can produce change in total fertility even if the quantum component is held constant, i.e., if the number of children born to each cohort of women does not change—as long as age at childbearing changes. Couples make a series of sequential fertility decisions: Do we try (or try not) to have a child? A decision to postpone childbearing has the same effect on current fertility as a decision to forgo further childbearing: it reduces period fertility.
Whether an observed decline in total fertility is due to a quantum or a tempo effect is crucial. A tempo effect is temporary; fertility will increase once postponement ends. In contrast, a quantum effect, a change in the total number of children couples are having, will not be offset later on and could mean a permanent change in family sizes.
For industrial countries with relevant data, shifts toward later ages at childbearing have been pervasive since the 1960s. These shifts have contributed to lower fertility, but determining their exact contribution requires strong assumptions. Building on the seminal work of Ryder (1980), Bongaarts and Feeney (1998) propose a straightforward approach to adjusting total fertility for timing shifts. They argue that, if women postpone births to an extent that raises the average age at which they have a first child by 0.1 years annually (and similarly raises the average age at having second, third, and all higher-order children by 0.1 years), then total fertility is reduced by 10 percent below its previous level. Mathematically removing this timing effect gives an “adjusted” total fertility rate that reflects only the quantum effect and thus provides a better indication of the current propensity to bear children.12
|
12 |
In this method, adjusted total fertility (TFR') equals the sum of the adjusted, order-specific total fertility rates (TFRi'), which are, in turn, equal to the observed, order-specific total fertility rates divided by (1−ri), where ri is the annualized change in the mean age at childbearing at order i. TFR' is interpreted as the value of total fertility in the absence of any timing changes and is viewed as an indirect estimate of the quantum of fertility implied by current period rates. This procedure assumes that a change in period fertility can leave cohort fertility unchanged if the two changes are suitably matched. For example, suppose that, from a time t onward, all period age-specific rates for a particular birth order are multiplied by (1−ri) and that this schedule of period age-specific rates is gradually shifted at a rate of ri years per calendar year, so that at time (t+s) fertility at age x is (1−ri) times fertility at age (x−sri) at time t. The completed cohort fertility for order i then remains unchanged for all cohorts. An upward translation of the period fertility schedule (i.e., ri>0) implies that the mean age of childbearing increases at a rate of ri per year. Therefore, if a change in the period mean age of childbearing of ri years per calendar year is observed at order i, one would expect the corresponding period total fertility rate to be multiplied by (1−ri) if only a timing (or tempo) shift in the fertility schedule was involved. Any other change can be interpreted as a quantum change. The Bongaarts-Feeney method depends on two assumptions: that age-specific fertility changes are period-driven, and cohort effects can be ignored; and that fertility rates by age and birth order, computed as births of that order relative to all women of a given age, irrespective of their achieved parities, are suitable quantum indicators for the period. For further critical discussion of this issue, see Van Imhoff and Keilman (2000) and Bongaarts and Feeney (2000). |
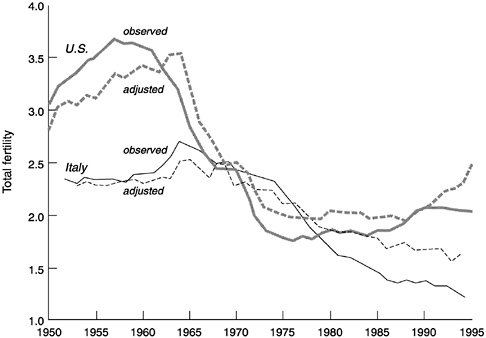
FIGURE 4-3 Observed total fertility and total fertility adjusted for the tempo effect: Italy and the United States, 1950-1995.
SOURCE: Data from Kohler and Philipov (1999) and Bongaarts and Feeney (1998).
Figure 4-3 shows observed and adjusted total fertility for Italy and the United States, two industrial countries with contrasting (relatively low and relatively high) fertility. Tempo effects have depressed fertility in Italy since the mid-1970s, and by the early 1990s this effect had become quite large. The observed total fertility of 1.30 in the early 1990s would have been 1.64 in the absence of the tempo effect, i.e., if the childbearing
age had been constant. In the United States, the reverse was true in the 1950s and early 1960s. Women were having their children at younger ages, and total fertility was pushed upward. Beginning in the mid-1960s, however, fertility in the United States began to be delayed, as in Italy. In the early 1990s, tempo effects depressed observed total fertility to 2.06, while adjusted total fertility stood at 2.18. This pattern, common for industrial countries in the 1990s, indicates that a significant part of the recent declines in fertility can be attributed to timing shifts, i.e., temporary declines resulting from a rising age at childbearing. Nevertheless, in both these countries and in other cases as well, quantum changes have also taken place.
Fertility by Birth Order
Changes in fertility have been reflected primarily in reductions in higher-order births. Third births, fourth births, and still higher-order births have become less frequent, while first and second births have been reduced much less. Couples may feel strong normative pressure to have a first and second child but be less constrained in regard to later births. Decisions on later births can depend on their own experiences with childbearing, the competing opportunities, and the available resources (Namboodiri, 1972).
To see how later births differ from first and second births, one can calculate fertility rates by birth order, as shown in Table 4-3 for Italy and the United States. These rates sum up to total fertility. For example, the rates shown in the table for birth orders from first to fourth and higher in Italy in 1955-1959 total 2.34, exactly the total fertility rate reported.
Between 1955-1959 and 1990-1994, total fertility in Italy declined from 2.34 to 1.29. Two-thirds of this change was due to declines in third and higher-order births. In the United States, the decline in total fertility was greater, from 3.61 to 2.06, and the proportion due to third and higher-order births was also greater, at almost three-fourths.
In addition, most of the changes in higher-order births, in both countries, were quantum changes and therefore likely to be permanent. By contrast, the smaller changes in first and second births involved minimal quantum effects and were mainly tempo changes, meaning these births were being postponed. The last column of Table 4-3 presents the estimated proportion of the fertility decline between 1955-1959 and 1990-1994 that is attributable to tempo changes in Italy and the United States. The contrast between third and higher-order births, on one hand, and first and second births, on the other, is stark. In Italy, the proportion of fertility change due to postponement declines from 89 to 7 percent be-
TABLE 4-3 Change in average total fertility by birth order, and the amount of change due to tempo effects: Italy and the United States, 1955-1959 to 1990-1994
|
Observed total fertility |
% of change due to tempo changesa |
|||
|
Birth order |
1955-1959 |
1990-1994 |
Change |
|
|
Italy |
||||
|
All |
2.34 |
1.29 |
−1.04 |
36.0 |
|
1st |
0.85 |
0.64 |
−0.21 |
88.7 |
|
2nd |
0.63 |
0.46 |
−0.17 |
71.1 |
|
3rd |
0.35 |
0.15 |
−0.20 |
17.2 |
|
4th and higher |
0.51 |
0.05 |
−0.46 |
7.0 |
|
United States |
||||
|
All |
3.61 |
2.06 |
−1.55 |
27.7 |
|
1st |
1.00 |
0.87 |
−0.13 |
76.9 |
|
2nd |
0.95 |
0.65 |
−0.30 |
56.7 |
|
3rd |
0.70 |
0.33 |
−0.38 |
23.7 |
|
4th and higher |
0.97 |
0.21 |
−0.75 |
9.3 |
|
aEstimated as one minus the ratio of the change between 1955-1959 and 1990-1994 in adjusted total fertility to the corresponding change in observed total fertility. Sources: Kohler and Philipov (1999); Bongaarts and Feeney (1998). |
||||
tween birth orders 1 and 4 and higher. The contrast between birth orders is only slightly less extreme in the United States.
The reduction in higher-order births is pervasive and essentially universal. It can be demonstrated for all other industrial countries with such data (and has also been an important component of fertility declines in East and Southeast Asia—Leete, 1987). First and second births now account for over 75 percent of U.S. fertility and for a higher percentage than that in Italy and most other industrial countries. The trend is unlikely to be reversed. Adequate rationales for large families in modern settings no longer exist, and the costs of large families are prohibitive (Morgan, 1996). Relatively few women have reason to want three, and especially four or more births. First and second births, therefore, have become critical in determining fertility levels, which now largely depend on the behavior of childless women and women with one child.
EXPLAINING FERTILITY TRENDS
The previous section has interpreted fertility trends but not really explained them. We still need to know why higher-order births are increasingly rare and why first and second births are increasingly post-
poned. We discuss the socioeconomic and cultural changes that are partly responsible, and then expand on the social institutions through which their effect on fertility is mediated.
Socioeconomic Change and Destabilization
Fertility reductions to low levels are partly a continuation of the fertility transition and are attributable to the same factors that produced the transition: increased chances of child survival, the rising direct and opportunity costs of children, and the growing acceptability of fertility control and smaller families (see Chapter 3). While the factors may be the same, at low fertility levels, calculations of the costs and benefits of children may have a specific cast. For instance, the opportunities that parents forgo when they have large families, and the opportunities and comforts their children may lose out on, become paramount considerations (see Mincer, 1963; Becker 1960, 1981; Becker and Lewis, 1973; Willis, 1973, 1974; Bulatao, 1979; Schultz, 1981). The psychosocial satisfactions that parents seek from childbearing, such as increased self-realization, also become tied to having just one or two children (Namboodiri, 1972; Bulatao, 1981; Lesthaeghe and Surkyn, 1988).
Fertility reductions may also be traced to specific historical factors. Harsh economic conditions, for instance, can lead to the postponement of marriage and fertility. Such conditions unmistakably caused the postponement of family formation in the United States in the 1930s. Likewise, combined high unemployment and inflation in the late 1960s and early 1970s in the United States contributed to marriage and fertility delay. In Japan, the oil embargo of 1973 and its economic consequences were strongly implicated in a subsequent sharp drop in fertility. In most societies, family formation is linked to the couple's ability or potential to support a family. When economic circumstances make such support difficult or uncertain, postponement is a rational strategy and one generally considered normative.
Major destabilizing events, including war, have played major roles in 20th-century fertility. U.S. first-birth probabilities dropped sharply with enlistment for World War I and II and increased dramatically when these wars ended (Rindfuss et al., 1988:Figure 10). Even greater and longer-lasting effects are visible for countries devastated by these wars. The imprint of war is indelibly etched into historical fertility trends in Russia (Avdeev and Monnier, 1995:Figure 2). Other dramatic historical events, such as the economic restructuring of Eastern European economies in the 1990s, have also produced dramatic fertility responses. German reunification apparently produced one of the lowest total fertility rates ever recorded: 0.7 in the former East Germany in 1994, a classic “demographic
shock” (as Conrad et al., 1996, label it) in its speed, its extent, and the “accompanying pessimism.” This dramatic short-term response may be the first step in a transition to West German fertility patterns.
Institutional Change
While destabilization and economic difficulty can produce wide fertility swings, low industrial-country fertility is also linked to enduring change in social institutions, especially marriage and gender roles.
Marriage
Marriage is central to fertility because, for most groups, births generally occur within marriage. A wedding is considered a normative license for parenthood and signals the onset of regular, sanctioned sexual relations. Women who postpone marriage postpone fertility, and those who never marry are very likely to remain childless.
Marriage patterns have changed in industrial countries. All countries for which we could find data exhibit a “retreat from marriage”: a clear decline in first marriage rates and unmistakable increases in the proportions of marriages that end in separation and divorce. Credible explanations link declines in marriage and increases in divorce to declining economic incentives to marry (Becker et al., 1977; Becker, 1981). This has direct and powerful effects on childbearing.
The universality of the retreat from marriage may be mitigated, however, by increasing numbers of nonmarital unions, virtually inevitable if large proportions of sexually active adults remain unmarried. The crucial question is whether these unions also result in nonmarital births. Some argue that levels and increases in nonmarital childbearing will be greatest when women's incomes are high and “marriageable” men are rare (Wilson, 1987; Willis, 1995; Willis and Haaga, 1996). Stigma against nonmarital births can also play a role. In some countries, as in Japan, strong norms against nonmarital cohabitation and nonmarital births have endured; in others, the stigma of cohabitation and nonmarital births is fading or has virtually disappeared. While the likelihood of nonmarital births remains lower than that of marital births, it has increased and could increase further.
Italy and the United States illustrate these changes in marriage institutions. Both countries exhibit a retreat from marriage. In Italy, residential pressures may contribute to this, as many young adults continue to reside with their parents. Perhaps partly for the same reason, nonmarital births are still rare. In the United States, the stigma attached to nonmarital unions
and nonmarital births has declined, at the same time as their frequency has increased (Pagnini and Rindfuss, 1993; Bumpass et al., 1991).
Gender Roles
The retreat from marriage and motherhood has been due not only to changes in the institution itself but to the development, in all industrial countries, of competing opportunities for women outside the home. Women are increasingly well educated and can consider a growing variety of options for employment, often in jobs that lead to careers (Rindfuss et al., 1996). This raises the opportunity costs of marriage and motherhood, leading some to adopt nonmarriage and childlessness instead, where this option has gained acceptability.
Many women, however, still try to reconcile family roles with outside roles. How easy this is to do may have a substantial effect on fertility trends. If women have increasing opportunities in education and employment but find these opportunities severely limited by parenthood, then fertility levels may drop substantially (McDonald, 2000). Contemporary Italy and Spain provide examples of countries where women's education and employment have increased dramatically in the past two decades. These changes have met with resistance of “society as a whole and especially of men, who have insisted that women continue to fulfill their traditional role of mothers and homemakers” (Reher, 1997:277). Italian and Spanish women—in contrast, say, to women in the Nordic countries—have resolved the substantial conflict between homemaker roles and roles outside the home by postponing childbearing. Similarly, in Japan, the retreat from marriage has resulted not from changes in the institution itself but from its inflexibility: husbands' and families' expectations about women's behavior have remained very traditional (Yoshizumi, 1995:184-185), and women, in embracing their new opportunities, have put off marriage and families. Because opportunities for women have grown rapidly, their impact has been greater. Institutions and individuals have had little opportunity to adjust, to accept and accommodate multiple roles for women (Perez and Livi-Bacci, 1992).
Adjustment may involve not only change in the public's views of women's proper roles but also public policies and practices that allow women greater opportunity simultaneously to have children and to pursue advanced education and good jobs. For instance, programs that improve the availability and quality of day care may reduce the incompatibility between childbearing and career pursuits (Rindfuss, 1991).
Where social adjustments and policy adjustments have taken place, and gender equality is greater, higher fertility levels are often observed (McDonald, 2000; Chesnais, 1996). Some statistical evidence of this can be
found in comparisons across industrial countries. Between 1970 and 1995, the correlation across countries between fertility and female labor force participation changed from strongly negative to strongly positive (i.e., from −0.5 to 0.5; Rindfuss and Brewster, 1996:Figure 1; Ahn and Mira, 1998). For Rindfuss et al. (2000), this indicates that, given rising women's aspirations and career pursuits, societal adjustments that make these compatible with childbearing have kept fertility, in some societies, from declining more than it might have.
POSSIBLE POLICY RESPONSES
At these low fertility levels, public policy has not played a deliberate role in fertility trends, but it could have an important role in the future. The effects of low fertility may eventually become sufficiently compelling for societies to attempt to take action. Such action could have some fertility effect, although it would probably be constrained. The potential rationale for societal intervention in fertility, and the possible effects, are the subject of this section.
Rationale
If fertility persists at fairly low levels, the small declines in population size now observed in parts of Eastern Europe will grow and spread to other industrial countries. In Italy, for instance, the population has barely begun to decline but is now projected to fall from 57.3 million in 2000 to 41.2 million in 2050. This projection assumes that total fertility will rise from 1.2 to 1.7 over this half century. If instead fertility stays in the range of 1.1-1.2 children, the Italian population will fall by 2050 to 36.8 million (United Nations, 1999). Changes in the age structure will be more evident, more quickly than changes in total population. In 2000, fewer than one in five Italians is 65 or older. By 2025, they will be one in four, and by 2050, more than one in three.
In most industrial countries, such prospects as these have not so far been enough to convert the variety of social programs that benefit parents and children into major initiatives to increase childbearing (nor have such prospects led to programs to increase immigration). Instead, childbearing continues to be treated as a private, individual decision, regardless of what relevance it may have to long-term social concerns. The sphere of such personal decisions has expanded historically in most modern, democratic societies. But in individual cases, the situation could change.
Childbearing could come to be considered a “social act” (Preston, 1987) and a focus of public policy concern, if a substantial gap can be shown between its public benefits and costs. Estimating such public ben
efits and costs of children is difficult. In one accounting, children provide large positive externalities, contributing to fiscal health in an industrial welfare society (Lee and Miller, 1990; National Research Council, 1997: Chapter 7 ). This is in stark contrast to their impact on public finances in developing countries, where rapid population growth can produce large negative externalities (Lee and Miller, 1990). In industrial countries, current pay-as-you-go systems for social security and welfare depend on economic transfers between generations, generally from workers to the elderly. A new birth means a potential worker and a stream of future income to support such systems. This contrasts sharply with the problems of developing countries, which depend much less on such systems for old age support and are burdened much more with the costs of educating and caring for large younger generations.
Transfer payments in industrial countries, which already account for up to 50 percent of gross national product, may therefore flow more often toward older than younger generations. Nevertheless, the proportional stream of these transfer payments reaching younger generations may still affect the cost-benefit balance of children to parents. This proportion, and the rules governing such payments, vary across countries and may help explain fertility trends and differentials. If it does, this proportion could in principle be deliberately modified to produce some fertility effect.
We do not intend to evaluate the arguments about the benefits and costs of children here, merely to note the possibility that these arguments may lead to future policy initiatives in demographically advanced countries that seek to raise fertility, or at least set a floor under fertility levels. Could such initiatives, were they instituted on a sufficient scale, succeed? No definitive evidence exists to date, but at least modest impact seems quite possible.
Potential Impact
A variety of previous efforts to raise fertility had little effect. Attempts to restrict access to contraception and abortion, for instance, have a long history and do show temporary effects that are substantially moderated over time. One extreme example is the Romanian antiabortion decree of 1966, part of a government plan to sustain rapid economic development. In the absence of effective contraceptives, the antiabortion decree increased fertility dramatically in the short run (Teitelbaum, 1972; Berelson, 1979). In the long run, however, the decree had weaker fertility effects, as illegal abortions became institutionalized. The costs of the policy were immense in terms of women's and children 's health, human rights, and the legitimacy of the political regime (Kligman, 1998). In democratic
societies, such drastic policies are not likely either now or in the future.13 Other initiatives to support childbearing have been reviewed by Demeny (1986; see also Teitelbaum and Winter, 1985), who describes their consequences as “nil or negligible.”
Some programs, nevertheless, have had at least modest effects. For instance, in 1976 East Germany introduced a set of targeted subsidies that apparently increased the proportion of women having a third child (Buttner and Lutz, 1990).
At least as important is evidence that public policies that are not deliberately pronatalist can have the unintended consequence of increasing fertility. The evidence includes the positive effects of the U.S. program of Aid to Families with Dependent Children (AFDC) on the fertility of poor women (National Research Council, 1998); the modest positive effects on the fertility of poor women of restrictions on public funding for abortion (Cook et al., 1996); the modest positive effects on marital fertility of increasing the U.S. income tax deduction for dependents (see Whittington, 1992); and the effects on Swedish fertility in the late 1980s and early 1990s of maternal leave policies that encouraged closely spaced births (Hoem, 1990).
Policies such as these contribute to a social setting that supports multiple roles for women and reduces the conflict they feel between raising a family and pursuing other interests. As argued earlier, such a setting appears to facilitate slightly higher fertility, closer to two children per woman, in some industrial countries. Although the link between a favorable setting and specific public policies is not always clear, policy can certainly contribute in various ways. Free or subsidized child care, reduced taxes for families with children, paid parental leaves, subsidized housing for families with children, etc., all reduce the economic costs of childrearing and could collectively have some fertility effect.
The public discussion of such issues could be as important as the enactment of policy. Public debate could be seen as reaffirming or reconstructing an ideology supportive of parenthood. The enactment of such policies could signal that the society acknowledges the social value of parenthood and assigns a high status to parents. Such ideas, if they were supported by influential elites, could play a role in stabilizing fertility,
|
13 |
More limited decisions regarding access can also have subtle effects. In the United States, abortion restrictions, such as the Hyde Amendment, have severely limited federal funding for poor women's abortions. More generally, the antiabortion movement has sought to stigmatize abortion providers and patients, reducing the number of health facilities that perform abortions. The result has been slightly higher fertility, particularly among poor women. These efforts were aimed not at increasing fertility but at reducing abortion. |
just as other ideas were influential in the timing and pace of fertility transition (Chapter 3). Thus, the indirect effects of policy debates may be as important as the direct effect of economic relief for parents.
A basic reason why policy could have some effect is that, in most contemporary low-fertility settings, young women on average still say they expect to have two children (Bongaarts, 2000). Their expectations may be socially determined, and the realization of these expectations may become constrained by various factors; in any case, actual fertility eventually falls short. To some extent policy and programs can help relax constraints: allowing institutional flexibility through family leave, for instance, or encouraging institutional innovation by way of workplace child care centers. Policy that removes obstacles to achieving fertility desires could raise actual fertility, although presumably no higher than desired levels, which are now close to replacement level.
A somewhat different kind of policy impact may be important in other countries, such as China. China's state policy has obstructed the achievement of fertility desires, and the problem then becomes one of assessing the possible impact of a withdrawal of this aggressive policy. The future of the policy is substantially uncertain. Concerns are increasingly being raised about the rapid increase of the elderly population and the unavailability of children to care for them. In addition, the one-child policy may become increasingly difficult to implement because socioeconomic policies have vastly increased the mobility of the Chinese population. Such mobility not only loosens the ties between children and parents but also reduces the ability of the state to monitor and control individual fertility.
FUTURE TECHNOLOGICAL DEVELOPMENTS
Besides the potential role of new policies, several technological developments may, in the future, help couples more closely approximate their fertility desires:
-
Contraception. Over the last few decades, improvements in techniques of contraception and abortion have facilitated fertility declines, particularly in developing countries. Further improvements are possible, given that current methods have side effects, allow for imperfect use, and leave many unwanted and mistimed pregnancies. Improvements may have significant benefits for women and possible fertility effects.
-
Proception. A potentially more significant issue for fertility levels in industrial countries, however, is the technology of proception (Miller, 1986), which helps people have babies. Such simple proceptive techniques as more frequent intercourse and selecting the right time for intercourse
-
could have some effect. More important, in the long run, may be techniques of hormone therapy and in vitro fertilization, which should become more effective. With childbearing being increasingly delayed to later ages, when fecundity is lower—it decreases dramatically between ages 35 and 45—developments in proceptive technology could prevent fertility levels from dropping more sharply than they might.14
-
Sex selection. Another likely technological development, expectable within a decade or so, involves more efficient and effective methods for determining the sex of one's offspring. Sex selection is relevant for fertility levels in such low-fertility developing countries as China and South Korea and could become important elsewhere. In the absence of sex selection, a strong preference for sons or daughters can increase fertility substantially, as couples have more children in order to reach their desired quota (Bongaarts and Potter, 1983:Chapter 9). This effect could be reduced or eliminated if new techniques become available.
At present, only selective abortion is a viable sex-selection technique. This procedure is expensive, invasive, and for some morally problematic. In addition, the procedure does not guarantee another birth of the desired sex. Couples who desire sons (or daughters) may require multiple abortions to achieve a desired sex composition. Alternative methods that are also effective could dramatically lower the costs of realizing sex preferences. Effective methods would mean that fewer children would be needed to obtain the desired number of sons. This would produce unbalanced sex ratios (Park and Cho, 1995), with various fertility effects. Unbalanced sex ratios in favor of males result in increases in the level of fertility required for replacement. The preference for boys over girls does vary across societies and over time and could change if undesirable social consequences ensue. While ignoring sex preferences seems unwise, projecting unbalanced sex ratios far into the future carries considerable uncertainty.
-
Genetic selection. Whereas the 20th century has given people control over the number of children they have, the 21st century could bring control not only over the sex but also over the entire genetic makeup of children (Gill et al., 1992). Gene therapy may lower the risk of certain diseases in one's offspring and thus reduce uncertainty about their health. Technology that would allow cloning of humans may become available.
14
Data from the 1995 U.S. National Survey of Family Growth (NSFG) indicate that 2 percent of all women aged 15-44 report a visit for medical help to get pregnant or to prevent miscarriage in the 12 months prior to the survey; an additional 13 percent report a visit in previous years (Abma et al., 1997:Table 56).
-
Some might find the biological closeness of such children as an advantage. More distant possibilities allow selection of desired characteristics from different individuals, via genetic engineering, in order to give one's child maximum genetic potential. Or it may be possible to have much of the period of gestation take place outside the womb, reducing the costs, and pleasures, of pregnancy. The effects of such technological developments are difficult to assess. If one could define precisely the kind of child one wants, perhaps one child would be enough. If multiple types of parenthood become possible, having children might become more appealing to diverse individuals with varying lifestyles. The fertility impact of such technology is not easily assessed.
CONCLUSIONS
Future Levels and Trends
We began by asking where fertility is headed in the 21st century, both among developing countries as they complete their fertility transitions and among industrial countries. Our conclusion has two parts. First, fertility in countries that have not completed transition should eventually reach levels similar to those now observed in low-fertility countries—around or somewhat below two births per woman, but with substantial variation across countries. Second, specific levels for these countries, and ultimate levels for industrial countries, are largely indeterminate for a variety of reasons. Nevertheless, these ultimate or long-term levels are unlikely to be either well above, or well below, two children per woman.
Our first conclusion relies heavily on interpreting the experience of the diverse set of countries that have made the transition to low fertility. In hardly any of these countries has fertility stabilized at rates well above two children per woman. Such an event would be dependent on substantial proportions of higher-order births, but higher-order births are largely anachronistic in industrial-country settings. Parents in such settings find sufficient emotional, psychological, and social rewards from having one or two children, and only occasionally three. Since they also bear most of the economic and emotional costs of childrearing, only massive societal transfers could conceivably compensate them for the trouble and the lost opportunities of raising a large family. This is true for the majority in most industrial countries, but the countries are otherwise diverse, and the specific levels of fertility they have reached, although all close to or below 2.0, still differ. These countries therefore provide a spectrum of fertility experience within which countries still in transition will probably fall.
Where fertility will fall, within this spectrum, will depend on decisions relating to first and second births. Fertility is unlikely to rebound significantly, given the increasing irrelevance of higher-order births. But fertility could fluctuate, for many reasons. Idiosyncratic economic and political events could dramatically change the social environment and the way it is viewed. This happened in the 1950s and 1960s with the unanticipated postwar baby boom. Even with current demographic expertise, that event would not have been anticipated, and other similar events could certainly occur in the future.
Further steep falls in fertility to very low levels are possible but unlikely to be sustained. Homeostatic mechanisms may begin to operate, although possibly with considerable lags. Societies have the capability to encourage and reward childbearing, by providing incentives or by removing disincentives for behavior that has social benefits (Blake, 1972, 1994). In various ways, industrial societies already provide various rewards, but using them to deliberately manipulate fertility is a sensitive issue, potentially involving substantial economic transfers, and likely to be contested. Whether such policies will be adopted in specific countries depends on the indeterminate outcome of political struggles that are difficult even to visualize at this time.
Even if such policies were adopted, the fertility response would not be fully predictable. The fertility response depends partly on fertility preferences, since policies that facilitate the achievement of preferences are much more likely to be successful than policies that attempt to reshape preferences. The importance of preferences is likely to grow in the future, given improvements in contraceptive and proceptive technology. The preference for two children is still extremely common even in low-fertility countries, but the future course of such preferences is difficult to predict. These preferences change in response to societal evolution and economic conditions. They do not appear to be stable cohort characteristics. Some now argue that changes in fertility preferences are tied to changes in values, but how values themselves will change in the future is unknown. The ultimate trend in fertility at low levels, therefore, remains largely indeterminate.
This discussion has few implications for changing the way posttransition fertility is currently projected. Fertility projection strategies generally build on the fundamental insight of the inevitable and irreversible decline in fertility to low levels and the expected long-term maintenance of fertility close to or below two children per woman. This strategy does not appear to have any fundamental flaw and, despite its failure to provide much differentiation in trends across countries, is difficult to improve on.
Research Priorities
Any future improvement will require new research. Studies are needed of countries in transition in order to assess our conclusion that they will move to fertility levels approximating two children per woman. As noted above but argued at length in Chapter 3, developing countries that now have low fertility are a select group. Are those still in transition fundamentally different in ways that could perhaps produce fertility stabilization well above levels required for population replacement?
Despite the substantial record of research on the determinants of posttransitional fertility, some issues have been relatively ignored but are important for predicting future trends. We particularly need to know more about what socioeconomic and biological factors are most predictive of very late and very low childbearing. For example, the causes of childlessness—a key factor for fertility projections —are not well understood. Is it largely a matter of choice, or are the difficulties of getting pregnant and carrying a pregnancy to term major obstacles to childbearing for women aged 35 and older? Will the age at childbearing continue to rise, and will this trend be accompanied by increasing childlessness? A closely related issue, the formation of sexual unions, has been understudied. Given the increasing importance of sequential unions, we need to know more about the possibly offsetting effects of fertility reduction due to time spent outside unions and fertility increase due to the desire for additional children in new unions.
Studies are needed to assess the impact and costs of various fertility-enhancing mechanisms that governments could consider if they become concerned about the adverse consequences of low fertility. Given that future policies are likely to be national in scope, comparative national studies and internationally comparable data on this issue become increasingly important. While high fertility will become increasingly isolated geographically and within societal subgroups, studies of groups that maintain high fertility could identify conditions that can raise levels of very low fertility closer to two children per woman. Descriptions of such groups could provide a valuable comparative perspective on the dominant, low-fertility pattern.
REFERENCES
Abma, J.C., A. Chandra, W.D. Mosher, L. Peterson, and L. Piccinino 1997 Fertility, family planning, and women's health: New data from the 1995 National Survey of Family Growth . Vital Health Statistics (National Center for Health Statistics) 23(19).
Ahn, N., and P. Mira 1998 A Note on the Changing Relationship Between Fertility and Female Employment Rates in Developed Countries. Centro de Estudios Monetarios y Financieros (CEMFI), Madrid.
Alho, J. 1992 Population forecasting theory, methods and assessments of accuracy: The magnitude of error due to different vital processes in population forecasts. International Journal of Forecasting 8:301-314.
Avdeev, A., and A. Monnier 1995 A survey of modern Russian fertility. Population: An English Selection 7:1-38.
Becker, G. 1960 An economic analysis of fertility. In Demographic and Economic Change in Developed Countries, Universities-National Bureau Conference Series 11. Princeton, N.J.: Princeton University Press.
1981 A Treatise on the Family. Cambridge, Mass.: Harvard University Press.
Becker, G., and H.G. Lewis 1973 On the interaction between the quantity and quality of children. Journal of Political Economy 81:S279-S288.
Becker, G.S., E. Landes, and R. Michael 1977 An economic analysis of marital instability. Journal of Political Economy 85:1141-1187.
Berelson, B. 1979 Romania's 1966 anti-abortion decree: The demographic experience of the first decade. Population Studies 33:209-222.
Blake, J. 1972 Coercive pronatalism and American population policy. Pp. 81-109 in R. Parke and C.F. Westoff, eds., Aspects of Population Growth Policy. Vol. 6 of The Commission on Population Growth and the American Future Research Reports . Washington, D.C.: U.S. Government Printing Office.
1994 Judith Blake on fertility control and the problem of voluntarism. Population and Development Review 20:167-177.
Bongaarts, J. 2000 Fertility and reproductive preferences in post-transition societies . Population and Development Review, forthcoming.
Bongaarts, J., and G. Feeney 1998 On the quantum and tempo of fertility. Population and Development Review 24:271-292.
2000 On the quantum and tempo of fertility: Reply. Population and Development Review, forthcoming.
Bongaarts, J., and R.G. Potter 1983 Fertility, Biology and Behavior. New York: Academic Press.
Bongaarts, J., and S. Watkins 1996 Social interactions and contemporary fertility transitions. Population and Development Review 22:639-682.
Brass, W. 1974 Perspectives in population prediction: Illustrated by the statistics of England and Wales. Journal of the Royal Statistical Society 137:532-582.
Bulatao, R.A. 1979 On the Nature of the Transition in the Value of Children. Paper No. 60-A. Honolulu: East-West Population Institute.
1981 Values and disvalues of children in successive childbearing decisions . Demography 18:1-25.
Bumpass, L.L., J.A. Sweet, and A. Cherlin 1991 The role of cohabitation in declining rates of marriage. Journal of Marriage and the Family 53:913-927.
Buttner, T., and W. Lutz 1990 Estimating fertility responses to policy measures in the German Democratic Republic. Population and Development Review 16:539-555.
Carter, L., and R.D. Lee 1986 Joint forecasts of U.S. marital fertility, nuptiality, births, and marriages using time-series models. Journal of the American Statistical Association 81:902-911.
Chen, R., and S.P. Morgan 1991 Recent trends in the timing of first births in the United States. Demography 28:513-533.
Chesnais, J.-C. 1996 Fertility, family, and social policy in contemporary Western Europe . Population and Development Review 22(4):729-739.
Conrad, C., M. Lechner, and W. Werner 1996 East German fertility after unification: Crisis or adaptation. Population and Development Review 22:311-358.
Cook, P.J., A.M. Parnell, M.J. Moore, and D. Pagnini 1996 The Effects of Short-term Variation in Abortion Funding on Pregnancy Outcomes. NBER Working Paper 5843. (Forthcoming in Journal of Health Economics.)
Demeny, P. 1986 Pronatalist policies in low-fertility countries: Patterns, performance and prospects. Population and Development Review 12(Supplement):335-359.
Foster, A. 1990 Cohort analysis and demographic translation. Population Studies 44:287-315.
Freedman, R. 1986a On underestimating the rate of social change. Population and Development Review 12:529-532.
1986b Policy options after the demographic transition. Population and Development Review 12:77-100.
Friedlander, D., and C. Feldmann 1993 The modern shift to below-replacement fertility: Has Israel's population joined the process? Population Studies 47:295-306.
Gill, R.T., N. Glazer, and S. Thernstrom 1992 Our Changing Population. London: Prentice-Hall.
Govindasamy, P., and J. DaVanzo 1992 Ethnicity and fertility differentials in peninsular Malaysia: Do policies matter? Population and Development Review 18:243-267.
Hoem, J.M. 1990 Social policy and recent fertility change in Sweden. Population and Development Review 16:735-748.
Kligman, G. 1998 The Politics of Duplicity. Berkeley: University of California Press.
Kohler, H.-P., and D. Philipov 1999 Variance Effects and Nonlinearities in the [Bongaarts-Feeney] Formula . Working Paper #1999-001. Max Planck Institute for Demographic Research, Rostock, Germany.
Lee, R., and T. Miller 1990 Population policy and externalities to childbearing. The Annals of the American Academy of Political and Social Science 510:17-32.
Leete, R. 1987 The post-demographic transition in East and South East Asia: Similarities and contrasts with Europe. Population Studies 47:187-206.
Lesthaeghe, R., and J. Surkyn 1988 Cultural dynamics and economic theories of fertility change. Population and Development Review 14(1):1-45.
McDonald, P. 2000 Gender equity, social institutions, and the future of fertility. Journal of Population Research 17, forthcoming.
Miller, W.B. 1986 Proception: An important fertility behavior. Demography 23:579-594.
Mincer, J. 1963 Market prices, opportunity costs, and income effects. In C. Christ et al., eds., Measurement in Economics: Studies in Mathematical Economics and Econometrics in Memory of Yehuda Grunfeld. Stanford, Calif.: Stanford University Press.
Morgan, S.P. 1996 Characteristic features of modern American fertility: A description of late twentieth century U.S. fertility trends and differentials . Population and Development Review 22(Supplement):19-63.
Namboodiri, N.K. 1972 Some observations on the economic framework for fertility analysis . Population Studies 26:185-206.
1981 On factors affecting fertility and different stages in the reproductive history: An exercise in cohort analysis. Social Forces 59:1114-1129.
National Research Council 1997 The New Americans: Economic, Demographic and Fiscal Effects of Immigration . Panel on the Demographic and Economic Impacts of Immigration. J.P. Smith and B.Edmonston, eds. Committee on Population and Committee on National Statistics, Commission on Behavioral and Social Sciences and Education. Washington, D.C.: National Academy Press.
1998 Welfare, the Family, and Reproductive Behavior: Research Perspectives . Committee on Population. R.A. Moffitt, ed. Commission on Behavioral and Social Sciences and Education. Washington, D.C.: National Academy Press.
Ni Bhrolchain, M. 1992 Period paramount? A critique of the cohort approach to fertility. Population and Development Review 18:599-629.
Page, H.J. 1977 Patterns underlying fertility schedules: A decomposition by both age and marriage duration. Population Studies 30:85-106.
Pagnini, D.L., and R.R. Rindfuss 1993 The divorce of marriage and childbearing: Changing attitudes and behavior in the United States. Population and Development Review 19:331-348.
Park, C.B., and N.-H. Cho 1995 Consequences of son preference in a low-fertility society: Imbalance of the sex ratio at birth in Korea. Population and Development Review 21:59-84.
Perez, M., and M. Livi-Bacci 1992 Fertility in Italy and Spain: The lowest in the world. Family Planning Perspectives 24:162-171.
Preston, S. 1987 Changing values and falling birth rates. Population and Development Review 12(Supplement):176-195.
Pullum, T.W. 1980 Separating age, period and cohort effects in white U.S. fertility, 1920-1970. Social Science Research 9:225-244.
Reher, D.S. 1997 Perspectives on the Family in Spain, Past and Present. Oxford, Eng.: Clarendon Press.
Rindfuss, R.R. 1991 The young adult years: Diversity, structural change and fertility . Demography 28:493-512.
Rindfuss, R.R., and K.L. Brewster 1996 Childrearing and fertility. Pp. 258-289 in J. B. Casterline, R.D. Lee, and K.A. Foote, eds., Fertility in the United States. New York: Population Council.
Rindfuss, R.R., and J.A. Sweet 1977 Postwar Fertility Trends and Differentials in the United States. New York: Academic Press.
Rindfuss, R.R., K.N. Benjamin, and S.P. Morgan 2000 How do marriage and female labor force participation affect fertility in low fertility countries? Paper prepared for the Annual Meetings of the Population Association of America, Los Angeles, Calif., March 23-25.
Rindfuss, R.R., S.P. Morgan, and K. Offutt 1996 Education and the changing age pattern of American fertility: 1963-89 . Demography 33:277-290.
Rindfuss, R.R., S.P. Morgan, and G. Swicegood 1988 First Births in America: Changes in the Timing of Parenthood. Berkeley: University of California Press.
Rodgers, W.L., and A. Thornton 1985 Changing patterns of first marriage in the U.S. Demography 22:265-279.
Ryder, N.B. 1964 The process of demographic translation. Demography 1:74-82.
1965 The cohort as a concept in the study of social change. American Sociological Review 30:843-861.
1980 Components of temporal variations in American fertility. In R.W. Hiorns, ed., Demographic Patterns in Developed Societies. London: Taylor and Francis Ltd.
1986 Observations on the history of cohort fertility in the United States . Population and Development Review 12:617-643.
Schultz, T.P. 1981 Economics of Population. Reading: Addison-Wesley.
Sweet, J.A., and R.R. Rindfuss 1983 Those ubiquitous fertility trends: United States 1945-79. Social Biology 30:127-139.
Swicegood, G., and S.P. Morgan 1994 Racial and Ethnic Fertility Differentials in the United States. Paper prepared for the 13th Albany Conference, American Diversity: A Demographic Challenge for the Twenty-First Century, April 15-16 , State University of New York at Albany.
Teitelbaum, M.S. 1972 Fertility effects of the abolition of legal abortion in Romania. Population Studies 26(3):405-417.
Teitelbaum, M.S., and J.M. Winter 1985 The Fear of Population Decline. Orlando and London: Academic Press.
Thompson, P.A., W.R. Bell, J.F. Long, and R.B. Miller 1989 Multivariate time-series projections of parameterized age-specific fertility rates. Journal of the American Statistical Association 84:689-699.
United Nations (U.N.) 1999 World Population Prospects: The 1998 Revision, Vol. I, Comprehensive Tables. New York: United Nations.
Van Imhoff, E., and N. Keilman 2000 On the quantum and tempo of fertility: Comment. Population and Development Review, forthcoming.
Westoff, C.F., and N.B. Ryder 1977a The Contraceptive Revolution. Princeton, N.J.: Princeton University Press.
1977b The predictive validity of reproductive intentions. Demography 14:431-453.
Whittington, L.A. 1992 Taxes and the family: The impact of the tax exemption of dependents on marital fertility. Demography 29:215-226.
Willis, R.J. 1973 A new approach to the economic theory of fertility behavior. Journal of Political Economy 81:S14-S64.
1974 A new approach to the economic theory of fertility behavior. Pp. 14-25 in T.W. Schultz, ed., The Economics of the Family. Chicago: University of Chicago Press.
1995 A Theory of Out-of-Wedlock Childbearing. Paper presented at a Symposium on the Economic Analysis of Social Behavior, convened by the Fraser Institute on the Occasion of Gary Becker's 65th Birthday, Department of Economics, University of Chicago.
Willis, R.J., and J.J. Haaga 1996 Economic approaches to understanding nonmarital fertility. In J.B. Casterline, R.D. Lee, and K.A. Foote, eds., Fertility in the United States. New York: Population Council.
Wilson, W.J. 1987 The Truly Disadvantaged. Chicago: University of Chicago Press.
Yoshizumi, K. 1995 Marriage and family: Past and present. Pp. 183-197 in K. Fujimura-Fanselow and A. Kameda, eds., Japanese Women: New Feminist Perspectives on the Past, Present and Future. New York: Feminist Press.
Zeng, Y. 1996 Is fertility in China in 1991-92 far below replacement level? Population Studies 50:27-34.
Zlotnik, H. 1999 World Population Prospects: The 1998 Revision. Paper prepared for the Joint ECE-Eurostat Work Session on Demographic Projections, Perugia, Italy, May 3-7.


