
3
What Are the Potential Costs to VA Health Care Associated with the National Formulary for Drugs?
INTRODUCTION
The VHA is one of the largest purchasers of pharmaceuticals in the United States. Under a decentralized system where VA facilities made local formulary decisions, the VHA was unable to take advantage of its potential bargaining power with manufacturers, particularly for classes of drugs used commonly by the vet-eran population. Among the stated objectives of the VA National Formulary are standardization of the pharmacy benefit and increased portability across the coun-try. In addition, the National Formulary should help to consolidate the bargaining power of the VHA with pharmaceutical manufacturers, with one result being lower prices and reduced pharmaceutical spending relative to what spending would have been in the absence of this policy intervention. This chapter examines the effect of the National Formulary on pharmaceutical costs for the VHA.
The National Acquisition Center (NAC) negotiates and administers con-tracts for pharmaceuticals (in addition to other items used by the VHA). The NAC reports substantial savings resulting from implementation of the National Formulary and all its other contracting responsibilities for the VHA over the past 4 years. As of February 11, 2000, total pharmaceutical savings (including sav-ings on pharmaceutical supplies) associated with the full range of NAC activi-ties are estimated by the NAC to be at least $572,521,352 for the period FY 1996 to FY 2000. The NAC defines savings as the difference between its esti-mate of actual spending and what it estimates would have been spent on the af-fected pharmaceuticals in the absence of these activities.1
|
1 |
This estimate includes savings achieved from generic drug contracts but does not include savings achieved through all blanket purchase agreements (BPAs). Only savings accruing from BPAs for alpha blockers and for selective serotonin reuptake inhibitors are included. The estimate is calculated by multiplying the price change for a given item resulting from NAC contracting activities by the quantity of that item in the previous year. |
The estimate includes savings accruing to the VHA for a variety of items including drugs in closed and preferred classes on the National Formulary; blanket purchase agreements (BPAs) (described below) for selective serotonin re-uptake inhibitors (SSRIs) and alpha blockers; exclusive contracts for generic drugs (that is, a contract purchasing all units of a generic drug from a single manufacturer); and bulk purchase of pharmacy-related supplies (for example, vials, sponges). The NAC estimate also captures any savings from the expiration of patents and subsequent generic competition. Although each of these items may have generated reductions in prices for the VHA, many (for example, brand patent expirations) are not attributable to the implementation of the National Formulary. In examining the cost impact of the VA National Formulary, this IOM analysis focuses narrowly on savings associated with prices negotiated for closed and preferred drug classes. As a result, this analysis produces a conservative estimate of the effects of VHA bargaining power associated with the National Formulary and national purchasing.
In this chapter, VA National Formulary savings in pharmaceutical expenditures are estimated as any reductions in pharmaceutical expenditures attributable to the National Formulary using a pre-/post-design that controls for changes in the size and characteristics of the veteran user population over time and across VISNs. This analytical approach allows an accounting of changes in both price and quantity resulting from adoption of the National Formulary. It focuses on the cost effects of the closed and preferred classes, the heart of the VA National Formulary. Because BPAs are sometimes used to forestall class closure (as described below), savings on selected BPAs could arguably also be attributed to the National Formulary. In part because the IOM committee could not assess the effect of BPAs on the decision to close classes, the committee's estimate represents an underestimate of the savings resulting from the National Formulary.
The committee addressed four primary questions in assessing the effect of the VA National Formulary on VHA costs: (1) How does the National Formulary affect prices for closed and preferred classes? (2) How does the National Formulary affect prescribing patterns within closed and preferred classes (that is, what is the level of compliance with the National Formulary for closed and preferred classes)? (3) How does the National Formulary affect pharmaceutical spending per veteran user for closed and preferred classes? and (4) Is there evidence that changes in formulary policy result in increased utilization elsewhere in the VHA system?
THE VHA NATIONAL FORMULARY AS IT AFFECTS COSTS
Background
The VA National Formulary uses a combination of formulary and contracting approaches, including closed, open, preferred, committed-use, and other contracts, and blanket purchase agreements. These different approaches can be considered along a continuum with respect to their influence over pharmaceutical decision making, with open classes exerting the least influence and closed the greatest. For open classes, the formulary places few restrictions on which drugs are preferred for VHA users. The vast majority of pharmaceutical classes on the National Formulary, 248 out of 254, are currently open (see Chapter 1 of this report). Prices for drugs in open classes are taken from the Federal Supply Schedule (FSS), a standard negotiated price schedule administered by the NAC and available for use by all federal agencies (unless a BPA offering a discounted price is in place, as described below).
In contrast, for closed classes, only a limited number of drugs in a class are included in the National Formulary. Other drugs in the class may not be listed on VISN or local formularies, and committed-use contracts are signed with the manufacturers that produce the selected National Formulary drugs. These class members must be used systemwide. Committed-use contracts are 1 year in duration with four optional 1-year renewals. As of February 2000, 4 of the 254 pharmaceutical classes on the National Formulary were closed (HMG CoA RIs, LHRHs, PPIs, ACEIs).2 Two other classes were closed in the past but have since been reclassified. H2R blockers were designated as open in August 1998, and alpha-blockers were designated as preferred in June 1998. Although the four closed classes represent a small fraction (<2%) of the total number of drug classes on the National Formulary, they account for 13% of all VHA pharmaceutical expenditures (GAO, 1999). In closing a drug class, the Medical Advisory Panel (MAP) decides that drugs within the class should be considered therapeutic alternates permitting therapeutic interchanges. Nevertheless, as described elsewhere in this report, a nonformulary exceptions process is administered at each VA medical facility to permit the use of nonformulary agents in closed classes if medically necessary.
In preferred classes, a limited number of drugs within a class are listed as preferred agents on the National Formulary. However, other agents in the class are available for use depending on VISN or local decisions. In designating a class as preferred, the MAP decides that drugs in the class are therapeutically interchangeable for the majority of patients. Typically, there is a significant
|
2 |
The MAP has recommended closing two additional classes, but these closures had not been implemented as of February 28, 2000. A closed-class contract is expected to be awarded for the oral 5-hydroxytryptamine agents imminently. Although the MAP recommended closing the nonsedating antihistamines, a legal challenge from the manufacturer of one of the agents has delayed the awarding of contracts. |
price differential across agents in classes considered for preferred status. In exchange for preferred status on the National Formulary, which in theory could change prescribing behavior, manufacturers have been willing to negotiate prices below the FSS. Currently, two classes, alpha blockers and calcium channel blockers (CCBs), use preferred contracting arrangements.
The VHA uses special contracting vehicles referred to as BPAs for a number of drug classes. Under BPAs, the NAC is able to extract some benefit beyond that derived from using the FSS (usually a lower price). Unlike committed-use contracts, BPAs can be terminated by the manufacturer at any time with 30 days notice. BPAs are desirable to manufacturers because they may lead to greater market share and, in fact, often link VHA market share and price. For example, the NAC uses a tiered contracting arrangement for felodipine, a CCB. The price paid by the VHA drops as the market share for this CCB increases.
Manufacturers may also sign a BPA in an attempt to prevent class closure or other threats to market share of their drug. One example is the case of Coumadin, an anticoagulant commonly used in the treatment of atrial fibrillation to prevent emboli. Although Coumadin was no longer under patent protection, the generic pharmaceutical equivalents, even though officially bioequivalent, were considered unsuitable for substitution by the VHA due to the narrow therapeutic index of the drug, despite Food and Drug Administration (FDA) findings of their suitability for substitution (FDA, 1999a). As a result, Coumadin was the dominant drug product in its class used by the VHA. Because of significant price differentials between the brand and generics, the VA PBM restudied this drug, considered a change to generic competition, and proposed an award to the lowest-price generic manufacturer. In response, the manufacturer of Coumadin (DuPont) agreed to a significantly lower price through a BPA, thereby fore-stalling this contracting shift.
In addition to BPAs, committed-use contracts like those used for closed classes are sometimes used for drugs in open classes as well. Under these arrangements, the VHA agrees to purchase a particular drug (for example, nifedipine, a generic CCB with many manufacturers) only from the contractor in exchange for a lower price. These arrangements are particularly common for generic drugs (that is, the NAC will contract with a single manufacturer to supply all units of a particular generic drug). Like BPAs, these contracts result in lower prices for the VHA and occur because of VHA bargaining power. BPAs and committed-use contracts for open classes differ with respect to contract terms, contract duration, and what the VHA promises in return for the lower price. BPAs typically link the price for a drug with its market share within the entire class. Such market share objectives can foster therapeutic interchanges with the BPA drug.
Since the National Formulary's adoption, the MAP has conducted 14 drug class reviews in order to decide whether to change the status of a class on the National Formulary from open to closed or preferred (see Table 1.2). Of these 14 classes, 6 have been closed to date. The status of two of these (H2R blockers and alpha blockers) was subsequently changed as many of the class members
became generic and OTC providing low-cost alternates. The MAP has also recommended closure of two of the other eight classes reviewed (oral 5-hydroxytryptamines 5[HT3s] and nonsedating antihistamines). In most of the six classes that the MAP decided not to close, it felt that class members were reasonable therapeutic alternates based on analyses of safety and efficacy data. However, a decision was made that closure was not necessary because sufficient competition could be achieved by BPAs and genetic single-source contracts (see, for example, SSRIs at www.dppm.va.gov/newsite/reviews.html).
Basic Economics of the VA National Formulary
Consumers of prescription drugs within the VHA do not pay out-of-pocket for prescription drugs prescribed by VA physicians. VA physicians, who are central to decisions made about the use of prescription drugs, are typically salaried and face no direct financial incentive linked to pharmaceutical expenditures on their patients. The VHA uses another, less direct mechanism, common in the private sector, to affect prices paid for drugs—that is, a formulary to create market incentives for manufacturers to compete on price.
The VA National Formulary employs clinical knowledge about the safety and effectiveness of various prescription drugs to bolster the buying power of the VHA. Like most private-sector PBMs, the VHA buys generic drugs when they are available. When there are a number of therapeutic alternates within a class, the VHA can make choices and use this bargaining power to obtain favorable prices. In economic terms, the aim of the National Formulary is to make the demand for specific prescription drug products more responsive to price than might have been the case otherwise. It is the price response of the demand for specific products that confers bargaining power on a purchaser, or in industry jargon, it is the ability to “move market share” that leads to price concessions by manufacturers.
Formularies have become central to the pricing of brand name prescription drugs in the United States. Formularies increase a buyer's bargaining power, enabling buyers to be more aggressive in price negotiation. The ability to exclude certain products entirely or to shift demand significantly between competing products allows the buyer to present a seller with a more elastic (price-responsive) demand, thereby inducing a lower price. The greater the ability by buyers to direct the volume of prescriptions among competing products, the more elastic will be the demand for the product, and this results in enhanced bargaining power for the buyer. The basic economics of formularies has been recently summarized in the Minnesota Prescription Drug Study (Schondelmeyer, 1993). The VA National Formulary enhances the VHA 's bargaining power in several specific therapeutic areas. The National Formulary has specific features that serve to move market share and, as a result, may enhance the VHA's bargaining position with manufacturers of prescription drugs. The presence of the National Formulary and the enhanced bargaining power it confers on the VHA may also affect, to some extent, classes of drugs that are neither closed or preferred.
Features of the National Formulary
The VHA represents a different type of health system compared to those under private insurance arrangements in the United States. The regional health systems of the VHA, known as VISNs, operate under fixed budgets. If the medical staff of a VISN make choices that forgo the opportunity to purchase supplies, devices, or pharmaceutical products at the most advantageous prices, the VISN budget will be less able to accommodate the needs of veterans in the region. Also, physicians are primarily employees of the VHA and obtain their patients almost exclusively through the VHA. For this reason they are likely to be more responsive to directives regarding prescribing policy than similar physicians in the private sector who contract with a number of health plans.
As discussed above, there are several specific features of the VA National Formulary that are used to move market share and enhance the VHA's bargaining power with manufacturers of prescription drugs, including closed classes, preferred classes, and BPAs. Because no other drugs can be added to local formularies for closed classes, and an exception must be granted to use a nonformulary drug, the closed classes in the VA National Formulary represent strong administrative directives to affect prescribing behavior. Any burden associated with a medical exceptions process also serves to encourage compliance with the formulary. Scientific drug class reviews justifying the closed classes and feed-back to clinicians provide education about use of the formulary. The VHA also shares information with VISNs on prescribing patterns and compliance with the National Formulary for both closed and preferred classes.
Preferred classes represent a weaker form of administrative directive. Under preferred classes, compliance with the formulary is encouraged through drug usage criteria and information about the preferred drugs and the conditions under which therapeutic interchange should take place.
The third main mechanism for moving market share is the BPA. VISN participation in BPAs is voluntary (although some BPAs are associated with official drug use criteria, CCBs), but they have a strong incentive to do so because of the lower prices typically offered through BPAs. VISNs may negotiate similar or better prices on their own, so the price for a given pharmaceutical in an open class may vary across VISNs. There is an implied threat that the VHA may close classes under a BPA if adequate performance (primarily in the form of low prices) is not realized. As noted earlier, BPAs are sometimes used by the VHA instead of closed or preferred arrangements. In these cases, the VHA's market power is strong enough that the mere threat of class closure can lead to significant price discounts from manufacturers.
Each of these mechanisms should produce three desirable results: (1) shifts in prescribing toward the closed or preferred products; (2) price concessions relative to open-class products and compared to the pre-National Formulary period; and (3) lower spending levels per veteran user for the classes of drugs subject to these management methods than would have occurred absent the policies of the National Formulary. The effects presumably will be strongest for the closed classes.
VISN Implementation Issues
Although the VHA uses a National Formulary, the formularies guiding prescribing decisions by physicians arc not uniform throughout the VHA system. Most of the 22 VISNs and 172 local hospitals continue to maintain a variably different formulary. For the four closed classes, the VA National Formulary and VISN or local formularies are exactly the same, although, as noted elsewhere, compliance with the national listings is not perfect. For all other classes, however, VISNs and medical centers are free to add agents to provide flexibility to respond to the needs of their regional or local populations. Although the VA PBM does not explicitly track differences in formulary content across VISNs and medical centers, the PBM estimates that the 22 VISN formularies include approximately 5,500 separate forms and dosages of pharmaceuticals that are not on the National Formulary (GAO, 1999).
VISNs and medical centers arc prohibited from altering the closed classes, but they have some flexibility in how quickly they implement national class closures. For the six classes that have been closed at any time, implementation of a national class closure at the VISN level has occurred anywhere from immediately to as long as 6 months after the national implementation date (see Table C.1 in Appendix C). Although there arc no explicit penalties for VISN or local failure to comply with VA National Formulary requirements, compliance (that is, use of the formulary agent) is greater than 90% overall for closed classes. This may flect local interest in achieving projected savings in drug spending.
Other Influences on VHA Pharmaceutical Spending
In the period spanning the development and implementation of the National Formulary, there have been a number of other possible influences on VHA pharmacy expenditures. First, there has been a shift away from inpatient care toward the use of outpatient services over the past few years (GAO, 1999; Kizer, 1999), a trend that likely increased the use of outpatient pharmacy. Second, the number of veterans accessing the VHA has been increasing (see VA Annual Reports). Pharmaceutical coverage outside the VHA has become more limited, especially for older age groups (Cook et al., 2000). As a result, the increase in VHA users may be disproportionately affecting the pharmacy budget. Veterans with other health care coverage may use the VHA system for their pharmaceuticals, although VHA policy is not to fill prescriptions written by other than VA prescribers. Also, VHA pharmaceutical spending has likely been affected by nationwide changes in drug treatments, as new, expensive drugs have become available and become an integral part of the treatment of chronic illnesses (GAO, 1999; Levit et al., 1998). To accurately estimate the effect of the VA National Formulary on pharmacy costs, the effects of these changes and trends must be separated from the effect of the National Formulary and formulary system.
ANALYTICAL FRAMEWORK
In estimating the cost impact of the VA National Formulary, the IOM committee focuses on the effect on expenditures for drugs of designating classes as closed or preferred. Using VHA data, changes were examined in pharmaceutical prices, market share for products within a drug class, and outpatient pharmacy spending per veteran user before and after implementation of closed and preferred classes for the National Formulary. Regression analyses were conducted to estimate the impact of the National Formulary on outpatient pharmaceutical spending per VHA user for closed and preferred classes, controlling for changes in the VHA system and its user population over time. Finally, the committee explored whether changes in formulary policy resulted in an increase in utilization elsewhere in the VHA system by studying discharge data for diagnoses of conditions likely to be affected by drugs in closed or preferred classes.
DATA
To assess the impact of the National Formulary on VHA expenditures, person-level data (including data on inpatient, outpatient, and pharmaceutical utilization) should be used to compare per-person expenditures for 1 to 2 years before and 1 to 2 years after National Formulary implementation. With person-level data on utilization across the VHA system, changes in pharmaceutical spending and in overall health care spending associated with National Formulary adoption could be examined. Consequently, whether changes in the National Formulary resulted in cost shifting from the pharmaceutical budget to the rest of the VHA budget could be assessed. If drug class closures that lead to favorable drug prices result in additional hospital admissions for complications resulting from a therapeutic interchange, total VHA expenditures might be increased even though VHA pharmacy expenditures decreased.
Because person-level utilization data for pharmaceuticals and other VHA health care services were unavailable until FY 1999 (2 years after National Formulary implementation), this analysis focuses instead on aggregate-level drug utilization data by month at the VISN level for each drug used in the VHA. The utilization data provided by the VA PBM were limited to the outpatient sector only for the period FY 1994 through July 1999. Data on 14 classes of pharmaceuticals were examined, 6 of which have been classified as closed or preferred at some point since National Formulary implementation (ACEIs, alpha-blockers, H2R blockers, HMG CoA RIs, PPIs, and CCBs) and 8 that have remained open (atypical antipsychotics, SSRIs, beta-blockers, nonsedating antihistamines, NSAIDs, oral diabetics, inhaled antiasthma agents, and antiemetics). Utilization data on one closed class, LHRHs, were not available.
To create VHA pharmaceutical expenditure data at the month and VISN level, the average purchase price for each VA product in a given VISN and month was multiplied by the number of units of the product dispensed in that
month and VISN.3 Because the purchase price data that were provided covered the period January 1, 1995, through November 30, 1999, and the utilization data covered the period October 1, 1994, through July 31, 1999, the expenditure data are limited to the period of overlap between these two data sets, January 1, 1995, through July 31, 1999.
The VA PBM reported utilization data by VISN for 39 pharmaceutical products for which price information was not provided. (For the purposes of this analysis, a “product” refers to a particular dosage form of a drug, for example, cimetidine, 100-mg tablets.) Average monthly consolidated mail outpatient pharmacy (CMOP) prices (that is, prices from the VHA's seven automated mail order pharmacies) were available for four of these drugs.4 For the remaining 35 products lacking price information, CMOP price data were also missing. Utilization data for these 35 products (representing a total of 5,121 prescriptions during the study period, or 0.005% of the total [97,619,839] prescriptions for the study period) were dropped from the analysis of expenditures. In addition, price data for 481 products were missing for a subset of VISN months for which utilization was reported. For these products, prices were imputed for the missing months by taking a moving average of prior and subsequent month's prices for the product.
To control for changes in the VHA user population over time, data by month by VISN were requested on the following: number of VHA pharmacy users (to calculate changes in pharmaceutical spending per user), age and gender distribution of users, and information on the severity of illness or case mix of the user population. The following information was provided: (1) the number of outpatient VHA users (the number of VHA pharmacy users was not available) and (2) the age and gender distribution of all VHA users. Information on case mix or severity of illness was not provided.
The committee explored the possibility that the National Formulary led to shifts in service utilization in other parts of the VHA. Aggregate data on the total number of inpatient discharges were collected. Data on the number of discharges for selected diagnoses that might be treated by drugs in certain closed or preferred classes by month by VISN for FY 1994 through July 1999 were examined. Analyses to assess relationships between discharges and VA National Formulary activities were performed and are discussed below.
|
3 |
There will be some noise in an estimate produced using this approach because all products purchased in a given month are not necessarily used in that month. However, since prices do not typically change each month and most VA facilities do not stock large quantities of pharmaceuticals for long periods of time due to the relationship with the VHA's prime vendor (an exclusive contract with a single wholesaler), any bias resulting from this is likely to be small. |
|
4 |
At the suggestion of PBM staff, the average price across the seven CMOPs was used for four of the products for which purchase price information was unavailable. |
EMPIRICAL METHODS
Trends in outpatient pharmaceutical prices, utilization, and spending per veteran outpatient user by month across VISNs were analyzed. These trends are presented in Figure 3.5, Figure 3.6, Figure 3.7, Figure 3.8, Figure 3.9, Figure 3.10, Figure 3.11, Figure 3.12, Figure 3.13, Figure 3.14, Figure 3.15, Figure 3.16, Figure 3.17, Figure 3.18, Figure 3.19, Figure 3.20, Figure 3.21, Figure 3.22, Figure 3.23, Figure 3.24 and Figure 3.25 and in Appendix C. Regression analyses to control for secular trends not related to National Formulary implementation, time-invariant unmeasured differences between VISNs, and changing demographics of the population were conducted. Two regression models were estimated, each with different dependent variables: (1) the natural logarithm of outpatient pharmacy spending per outpatient VHA user and (2) the natural logarithm of discharges for selected diagnoses potentially linked to closed or preferred classes divided by the number of veteran outpatient users.5 The unit of observation for each model was a VISN-month. Independent variables in the models include VISN dummy variables, a quadratic time trend, gender distribution, age distribution, and an indicator representing the change in status for each class.
RESULTS OF THE IOM COMMITTEE ANALYSIS OF COST EFFECTS
How Have the VHA and the Veteran User Population Changed During the Study Period?
As noted above, both the size and the characteristics of the VHA user population changed during the study period. As seen in Figure 3.1, the number of outpatient users increased 43%, from 1,018,250 in October 1993 to 1,460,019 in October 1999. During this same period, the total number of inpatient discharges decreased 32%, from 73,660 in January 1994 to 50,000 in December 1999, as shown in Figure 3.2.6 The veteran user population became slightly younger on average during this period. The proportion of users age 65 or older decreased from 50.1% in FY 1994 to 43.9% in FY 1999, as seen in Figure 3.3. Figure 3.4 shows that the gender distribution of users remained constant during this period, approximately 90% male.
How Has the National Formulary Affected Prices for Closed and Preferred Classes?
To explore the impact of enhanced bargaining power conferred by the National Formulary, price reductions resulting from National Formulary imple
|
5 |
The natural logarithm of the dependent variables was used because a proportional effect (as opposed to a linear effect) was expected and to address skewness in the distribution of the dependent variable. |
|
6 |
These numbers represent both discharges from VHA facilities and discharges of VHA users (paid for by the VHA) from non-VHA facilities. Non-VHA discharges are approximately 2 to 3% of total discharges for the VHA population. |
TABLE 3.1 Price Changes for Most Commonly Prescribed Drugs in Closed Classes After National Formulary Class Closure
|
Drug (class) |
Percentage Change |
|
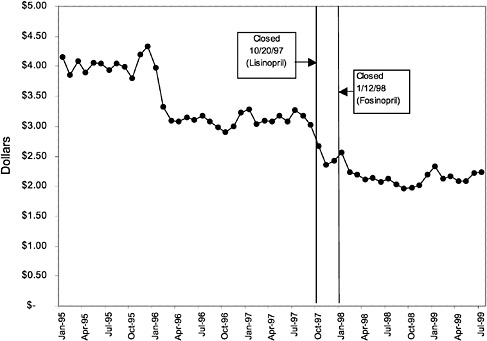
Lisinopril 10-mg tablets (ACEI) |
41 ↓ |
|
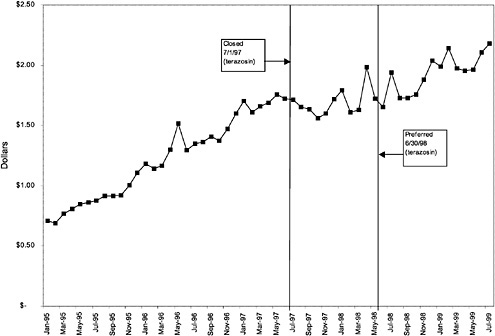
Terazosin 5-mg capsules (alpha blocker) |
27 ↓ |
|
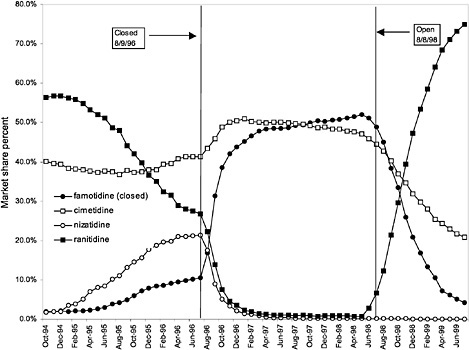
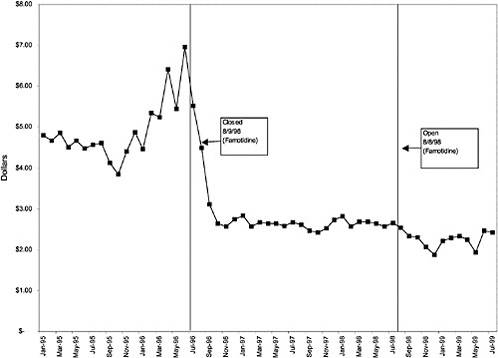
Famotidine 20-mg tablets (H2R blocker) |
32 ↓ |
|
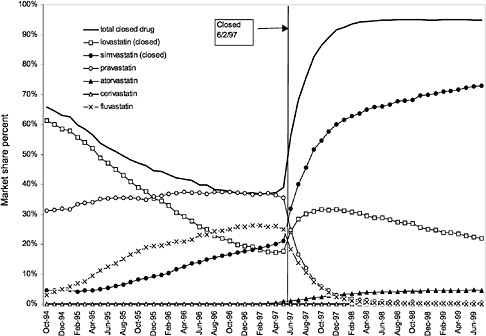
Simvastatin 10-mg tablets (HMG CoA RI) |
25 ↓ |
|
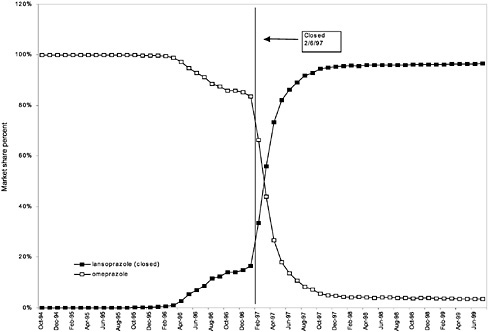
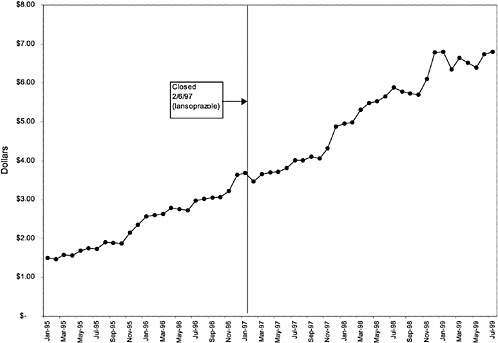
Lansoprazole 30-mg capsules (PPI) |
16 ↓ |
mentation of closed and preferred classes were studied. The committee examined the average price change per pill across VISNs for the most commonly prescribed product in each affected class. To calculate the change in price for each product, the pre-National Formulary price calculated as the average VISN price over the 3 months before National Formulary adoption was compared with the post-National Formulary price calculated as the average VISN price over the 3 months after National Formulary adoption.
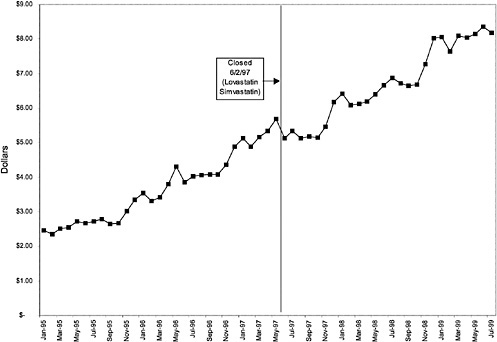
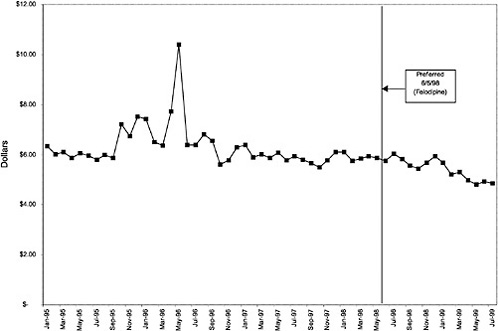
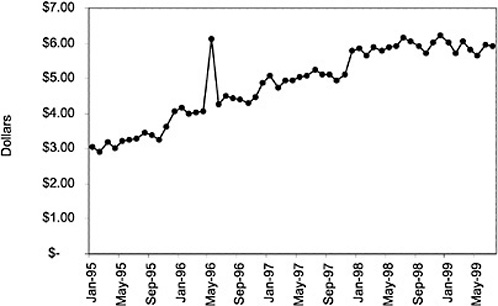
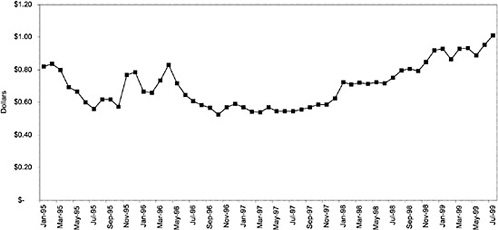
Figure 3.5, Figure 3.6, Figure 3.7 ,Figure 3.8, Figure 3.9 through Figure 3.10 illustrate the changes in price per pill after National Formulary implementation for the most commonly prescribed product in each closed or preferred class (the spike in Figure 3.10 was smoothed out in the regression analysis to eliminate any effect on the expenditure estimate), and Table 3.1 shows the percentage change pre- versus post-National Formulary for the most common products in closed classes. The price per pill dropped after class closures were implemented for each of the five closed classes, but the magnitude of the price decrease varied across the closed classes from 16 to 41%, as shown. In contrast, the price per pill for the most common product form of the preferred agent (felodipine, 10-mg tablets) among the CCBs, a class with preferred but not closed status, remained constant after implementation of the National Formulary (Figure 3.10).7 Of course, increased relative utilization of a low-cost preferred drug might confer a savings even though there was no price decrease.
How Has the National Formulary Affected Prescribing Patterns Within the Closed and Preferred Classes?
After examining the effect of the National Formulary on prices, the committee assessed the effect of the National Formulary on market share for each
|
7 |
The most commonly prescribed product among CCBs was not the preferred agent (felodipine), but diltiazem, 60-mg tablets. |
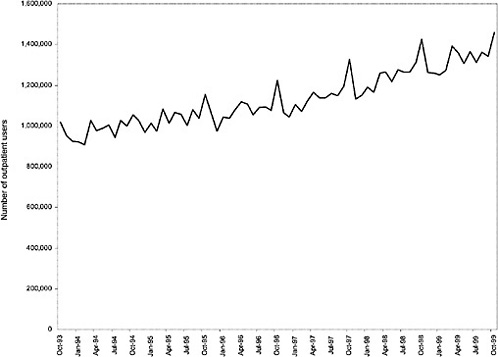
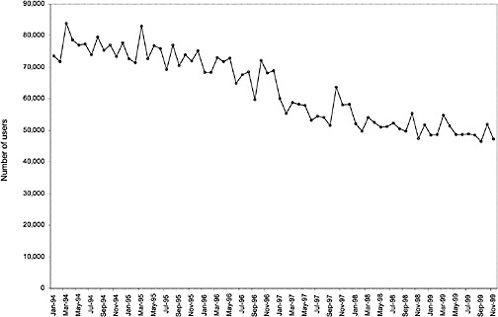
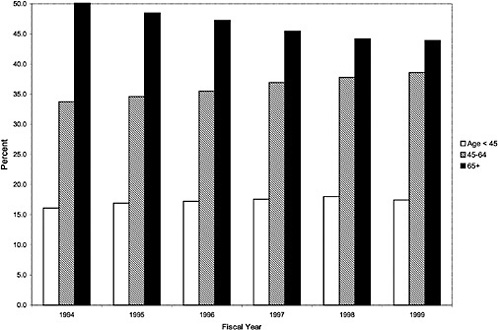
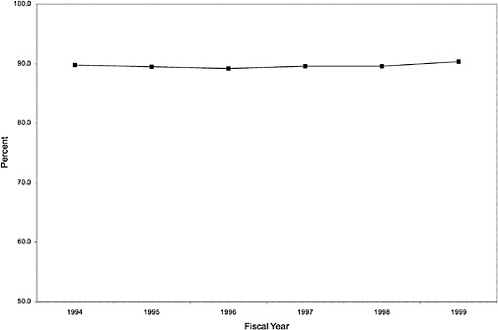
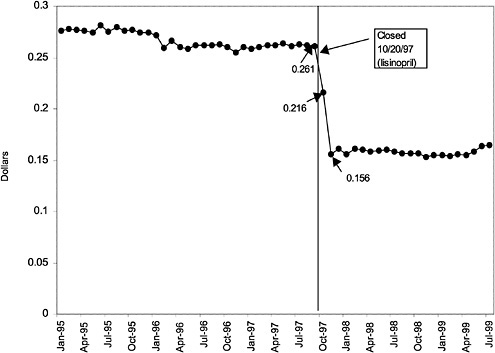
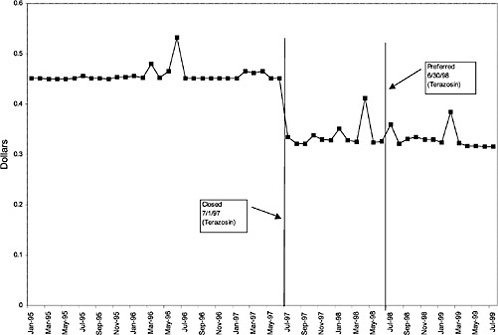
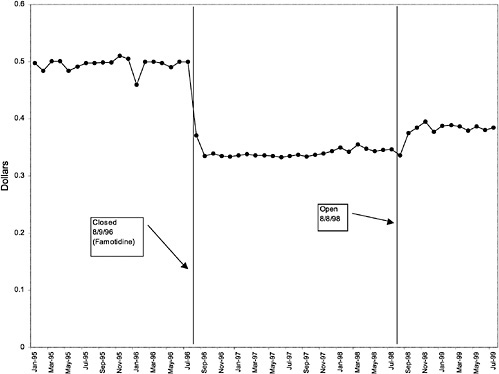
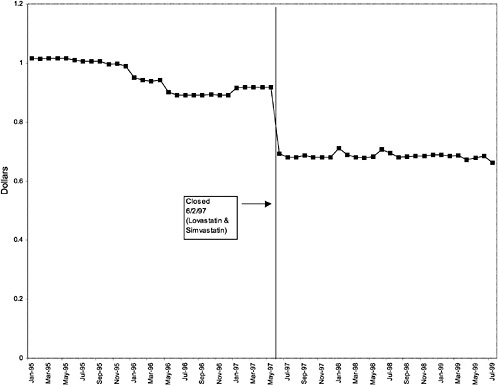
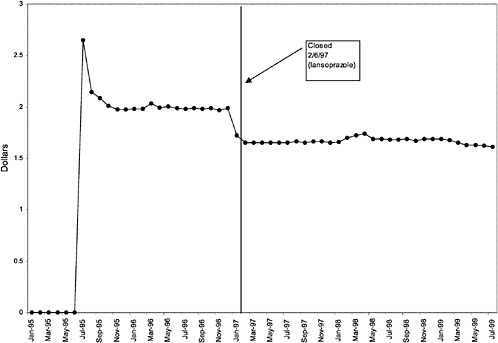
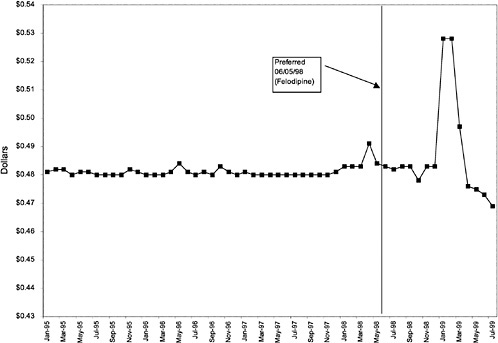
TABLE 3.2 Compliance with National Formulary
|
Drug Class |
Compliance as of July 1999 (%) |
|
Closed |
|
|
ACEI |
85.1 |
|
HMG CoA RI |
94.9 |
|
PPIs |
96.5 |
|
LHRHs |
Data not available |
|
Preferred |
|
|
Alpha blockers (originally closed) |
77.1 |
|
CCBs |
23.2 |
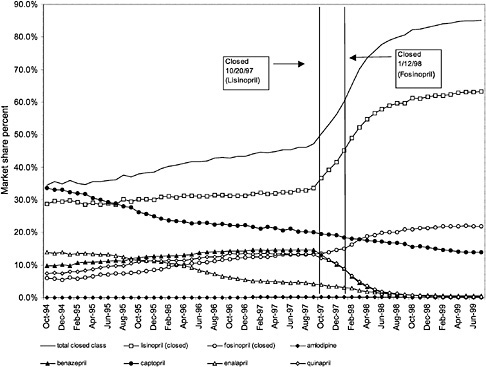
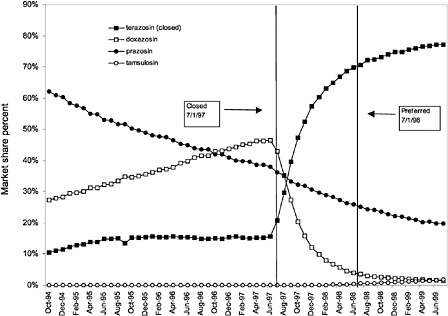
were considered. Figure 3.11, Figure 3.12, Figure 3.13, Figure 3.14, Figure 3.15 through Figure 3.16 illustrate changes in market share for the closed or preferred agents in the National Formulary. Appendix C includes similar graphs for classes that remained open during the study period (Figure C.1, Figure C.2, Figure C.3, Figure C.4, Figure C.5, Figure C.6, Figure C.7 and Figure C.8). Table 3.2 shows the percentage of utilization within each closed and preferred class that is in compliance with the National Formulary. Market shares for lisinopril and fosinopril (ACEIs), terazosin (alpha blocker), famotidine (H2R blocker), simvastatin and lovastatin (HMG CoA RIs), and lansoprazole (PPI) increased approximately 35, 62, 42, 75, and 80 percentage points, respectively, on class closure and national contracting, as shown in the figures.
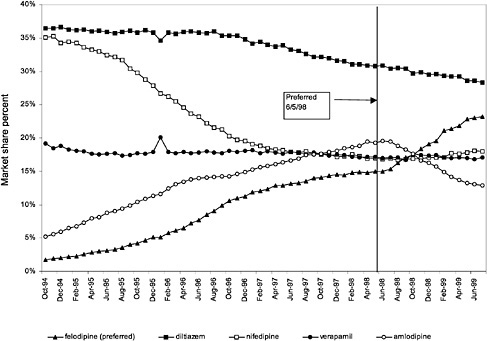
In contrast, market share for the preferred agent among CCBs, the only class that has had preferred status without ever being closed, did not change as dramatically. Felodipine's market share was approximately 15% before the drug was made the preferred agent. After this designation, the market share for felodipine increased to approximately 24%, still a relatively small share of the total market for CCBs (see Figure 3.16). However, it is important to note that there is greater heterogeneity within the CCB therapeutic class than within any other drug class studied by the committee. The class contains three distinct chemical species, and its members are used for a number of different indications, for example, angina, hypertension, and cardiomyopathy. Consequently, it is not surprising that the preferred agent has a relatively low share of the CCB market.
These figures show large changes in market share toward closed drugs in response to National Formulary implementation. As shown in Appendix C, (Figure C.1, Figure C.2, Figure C.3, Figure C.4, Figure C.5, Figure C.6, Figure C.7 through Figure C.8) similar increases in market share are not seen in classes that remained open during the study period, with the exception of classes in which a breakthrough drug entered the market during this time. For example, for the atypical antipsychotics, market share for olanzapine increased steadily beginning in 1996 and reached approximately 43% by June 1999, an increase that was not limited to the VHA and is not linked to the VA National Formulary
(see Figure C.2) (Frank et al., 1999). The National Formulary seems to have been successful in moving market share toward closed-class agents for which sizable price discounts were negotiated.
How Has the National Formulary Affected Pharmaceutical Spending per Veteran User for Closed and Preferred Classes?
Trends in average outpatient pharmacy spending per outpatient VHA user are presented in Figure 3.17, Figure 3.18, Figure 3.19, Figure 3.20, Figure 3.21 and Figure 3.22 for the closed and preferred classes. Trends for two additional classes that remained open throughout this period, SSRIs and beta-blockers, are provided in Figure 3.23, and Figure 3.24 for comparison. Appendix C includes similar figures, Figure C.9, Figure C.10, Figure C.11, Figure C.12, Figure C.13 and Figure C.14, for six other open classes. The trends in average outpatient pharmacy spending per outpatient user over the study period vary substantially across classes. For three of the closed classes (ACEIs, H2R blocker, and alpha-blockers), implementation of the National Formulary appears to be associated with a decrease in what average spending on the given class per outpatient user would have been had the preformulary time trend continued (see Figure 3.17, Figure 3.18 and Figure 3.19). On the other hand, for PPIs and HMG CoA RIs, average spending per outpatient user continued to increase throughout the period (see Figure 3.20 and Figure 3.21). During this time, the average number of prescriptions per user was increasing steadily for these classes, which is responsible for the increases in outpatient pharmacy spending per outpatient user. For CCBs, average spending per outpatient user remained fairly constant after National Formulary designation as a preferred class (see Figure 3.22).
Table 3.3 displays results for the key coefficients of interest for assessing the spending effects of the VA National Formulary. A separate regression is estimated for each closed or preferred class. Each regression model was specified so that the dependent variable was measured as the logarithm of spending per out-patient VHA user in a VISN in each month from January 1995 through July 1999. Several independent variables were included in the model. Two variables representing the age composition of the population (that is, the percentage of a VISN's user population under age 45 years and the percentage age 45 to 64) were included to account for changing health needs. The percentage of users that were males was included to account for changes in utilization and spending attributable to demographic changes. A quadratic time trend was entered into the model to account for overall trends in pharmaceutical prescribing and spending within the VHA system. The key variables of interest are a set of indicators about the open, preferred, or closed status of specific drugs during a given month. Finally, a set of dummy variables was included for each of the VISNs to control for time-invariant, unmeasured characteristics of the VISNs and their user populations. The need for a time dummy was accommodated by the quadratic time trend. The complete regression results are reported in Appendix C (Table C.2 and Table C.3).
The specific drugs chosen in each of the six closed or preferred drug classes examined are identified in Table 3.3. Percentage effects on class-level spending per VHA user are reported. The committee also reports the statistical significance level of the estimated effects and the overall explanatory power of the statistical model. Table 3.3 shows that for the five closed drug classes studied, closure was associated with a significant decrease in average per-user outpatient pharmacy spending in the class. This does not mean that there were absolute declines in spending (see Figure 3.17, Figure 3.18, Figure 3.19, Figure 3.20, Figure 3.21 and Figure 3.22), but, rather, that spending levels were lower than they would have been absent the changes in formulary policy. The one class studied for which a decrease was not seen was CCBs, a class with preferred status only. The estimate of the effect of CCB preferred status was not significantly different from zero at conventional levels, although it was quite precisely estimated (p <.07).
As shown, spending reductions associated with class closure for lisinopril and fosinopril (ACEIs), terazosin (alpha-blocker), lovastatin/simvastatin (HMG CoA RIs), lansoprazole (PPI), and famotidine (H2R blocker) were 16.9 and 8.5%, 17.5%, 8.1%, 7.4%, and 41%, respectively, and the model explained 82, 83, 92, 95, and 65% of the variance in per-user spending, respectively. These reductions were statistically significant at the 99% confidence level. Finally, CCBs were designated as a preferred class, with felodipine as the preferred agent. This change was associated with a 7.9% increase in per-user spending on CCBs that was significant at the 93% confidence level. The model accounted for 66% of the variance in per user spending in the class.
IS THERE EVIDENCE THAT CHANGES IN FORMULARY POLICY HAVE RESULTED IN INCREASED UTILIZATION ELSEWHERE IN THE VHA SYSTEM?
Exploration of Changes in Hospital Discharges per VHA User
Figure 3.25 and Figure 3.26 show trends in the number of inpatient discharges for selected heart and ulcer-related diagnoses per outpatient VHA user by month.8Table 3.4 displays estimated effects of the formulary policy on rates of hospital discharges for illness related to cardiac care and treatment of ulcers. 9 These
|
8 |
The following International Classification of Diseases, Ninth Edition (ICD-9) codes were used for the regressions focused on heart conditions (that is, ACEI related): 401.0, 402.0, 405.0, 410.0, 411.1, 413.0, 414.8, 414.9, and 428.0. The following ICD-9 codes were used for the regressions focused on gastrointestinal conditions (that is, PPI-related): 530.1, 531.0, 532.0, 533.0, and 535.0. |
|
9 |
Similar analyses for HMG CoA RIs and alpha blockers were not conducted because the conditions for which drugs in these classes are used most commonly would be less likely to result in hospital treatment if complications resulted. |
analyses are aimed at identifying any shifts toward hospital treatment of heart disease and ulcers that might be associated with changes in the availability of the full line of products in the PPI and ACEI closed drug classes. The dependent variables in these models are the logarithm of the rates of discharges (disease-specific inpatient discharges/per veteran outpatient user) from the hospitals for a set of diagnoses for which ACEIs and PPIs are often used for treatment. The independent variables include demographic characteristics of each VISN's users, age, and gender. Also included are dummy variables for each VISN, a quadratic time trend, and an indicator variable for when the new formulary policy was in effect for each of the two classes. The full regression results are reported in Appendix C ( Table C.2 and Table C.3).
TABLE 3.3 Outpatient Pharmacy Spending per Outpatient VHA User *
|
Estimated Impact (%) |
Significance |
|
|
ACEI |
||
|
lisinopril |
-16.9 |
p<.01 |
|
fosinopril |
-8.5 |
p<.01 |
|
R2 |
0.82 |
|
|
Alpha Blockers |
||
|
terazosin, closed |
-17.5 |
p<.01 |
|
terazosin, preferred |
-0.1 |
NS |
|
R2 |
0.83 |
|
|
HMG CoA RIs |
||
|
lovastatin, simvastatin (closed) |
-8.1 |
p<.01 |
|
R2 |
0.92 |
|
|
PPIs |
||
|
Lansoprazole |
-7.4 |
p<.01 |
|
R2 |
0.95 |
|
|
H2R blockers |
||
|
Famotidine, closed |
-41.1 |
p<.01 |
|
Reopened |
-4.3 |
NS |
|
R2 |
0.65 |
|
|
CCBs |
||
|
Felodipine, preferred |
7.9 |
NS (p<.07) |
|
R2 |
0.66 |
|
|
NOTE: NS = not significant. * Complete regression results are available in Appendix C (Table C.2). |
||
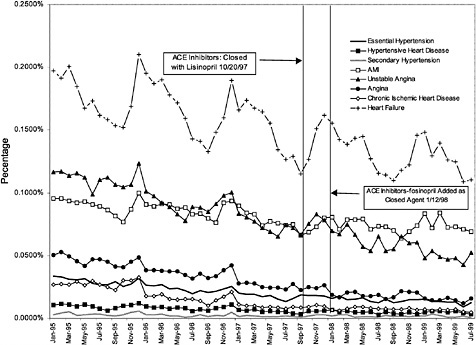
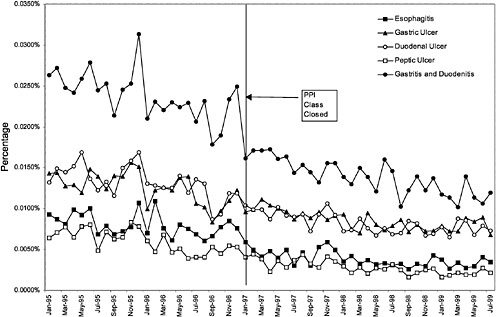
TABLE 3.4 Estimated Impacts of National Formulary Class Closures on Disease-Specific Discharge Rates*
|
Estimated Impact (%) |
Significance |
|
|
ACEIs |
-1.3 |
NS |
|
R2 |
0.81 |
|
|
PPIs |
-4.9 |
NS |
|
R2 |
0.64 |
|
|
NOTE: NS = not significant. * The denominator of the discharge rate is the number of VHA outpatient users. |
||
The first row of Table 3.4 displays the estimated effect on the rate of discharge per VHA outpatient user associated with closure of the ACEI class. The estimated effect implies that discharges for heart-disease-related care fell by 1.3% relative to what they would have been absent the change in formulary policy. However, this effect is not statistically significant at conventional levels (p <.05). The regression model accounted for 81% of the variation in discharges per user.
The second set of results on Table 3.4 reports the estimated effect of closing the PPI class on ulcer-related hospitalizations. Once again the dependent variable is the logarithm of ulcer-related discharges divided by the total number of veteran outpatient users in each VISN. The estimated effect implies a 4.9% reduction in the ulcer-related discharge rate. Again, this estimate was not significantly different from zero at conventional confidence levels. The regression model for ulcer-related discharges accounted for 64% of the variation in ulcer-related discharges per user.
The regression results suggest that there are no significant changes in hospital discharge rates related to heart disease and ulcers. However, these are very crude indicators of shifting utilization stemming from changes in the delivery system for treatment of ulcers and heart disease.
COSTS ASSOCIATED WITH IMPLEMENTING AND MANAGING THE NATIONAL FORMULARY
Evaluations of the cost effects of the VA National Formulary must consider both changes in pharmacy spending and costs imposed on the VHA associated with implementing and managing the National Formulary. To estimate these administrative costs, the committee requested total cost estimates of expenditures associated with National Formulary administration from the VA PBM. The PBM does not collect detailed information about these expenditures but estimated that roughly half of its budget was associated with National Formulary-
related activities. The PBM estimated the following expenditures associated with the National Formulary: $400,000 each year for FY 1995 and FY 1996 (the PBMs total budget was $884,000 each of those years); and $900,000 each year from FY 1997 to FY 2000 (the PBMs total budget was $1,919,000 each year for FY 1997 to FY 1999 and $2,099,000 for FY 2000).10 This estimate is limited to PBM expenditures and does not include a number of other costs, including time spent by VISN leaders and personnel in implementing and managing the National Formulary at the VISN level, time spent by the NAC in negotiating contracts for the National Formulary closed and preferred classes, procurement costs for the National Formulary closed classes, any extra staff that might have been added at the VISN or local facility level to handle increased pharmacy duties, and time spent at the local level administering nonformulary exceptions, therapeutic interchanges, and seeing patients again regarding prescription changes, among others. As a result, the committee could not provide a complete estimate of total administrative costs associated with implementing and managing the VA National Formulary.
Estimated National Formulary Savings
In this section, the IOM committee presents the estimated gross savings (that is, savings omitting costs associated with implementing and managing the National Formulary) attributable to VA National Formulary activities in six drug classes. This estimate should measure first-order effects such as the cost savings in each class attributable to formulary policy. In addition, any direct effects of formulary policy on all drug classes or secondary effects on the closed and preferred classes should also be measured. Finally, a complete estimate should also measure other effects of the VA National Formulary on prices for nonclosed or preferred classes stemming from the application of bargaining power created by the formulary system. For example, the threat of closing certain classes or using exclusive generic contracts in order to obtain more advantageous prices under BPAs or national contracts appears to have yielded price concessions in bargaining. The estimates presented below focus on the first-order effects of savings. Yet even the first-order estimates of savings are incomplete because complete data on prices and quantities purchased for the LHRH class of drugs were not available.
The IOM committee could not measure the effects of designating classes as closed or preferred on spending and utilization of related classes of drugs be
|
10 |
To calculate the $900,000 estimate for each year from FY 1997 to FY 2000, the VA PBM reported that it “allocated the costs of the PBM clinical staff, the half full-time equivalent provided to support the MAP chair, travel related to [VA] National Formulary activities, and a portion of the data management, contracting, and supervisory staff to those activities directly related to [VA] National Formulary support” (e-mail correspondence with Michael Valentino, R.Ph., MHSA, associate chief consultant, PBM Strategic Healthcare Group, January 11, 2000). Additional details on PBM National Formulary expenditures were not available. |
cause of lack of availability of data and time and resource constraints, although some evidence of cross-class effects for one class of antihypertensive drugs related to ACEIs (beta blockers) was investigated and is discussed later in this chapter. The committee also could not assess the effects of negotiations for drugs covered by BPAs and national contracts because of difficulties characterizing the precise features and timing of the implementation process for BPAs.
Several different approaches to estimating savings from formulary policy are described in the pharmacoeconomics literature. Many of these depend on being able to convert data into defined daily doses and to use detailed management information to predict purchasing patterns absent formulary changes. For example, some large private-sector health centers multiply total annual spending on a particular formulary agent by the percentage price decrease negotiated at the time of formulary selection and take this as a cost avoidance or savings for the year, unadjusted for possible coinciding factors affecting drug usage. Data limitations in this IOM study precluded such approaches. Instead the committee relied on a statistical method to estimate savings which is described below.
Table 3.5 summarizes the savings estimates for each of the six closed or preferred drug classes that were studied. The estimate for each class represents savings that accrued to the VHA beginning on the date the class was designated as closed or preferred and ending on either July 31, 1999 (the last date for which there were pharmacy spending data), or the date the class was reopened (in the case of H2R blockers), whichever came first. The committee presents three estimates for each class: the nominal savings, the “real” savings, and the real discounted savings. The nominal savings are simply the sum of per-user dollars saved in each month multiplied by the number of outpatient VHA users. Projected per-user dollars are estimated by using coefficients from the regression models to predict national spending per user in each month. Using the regression model allowed the committee to hold constant the age, geographic, and gender composition of the population of veteran users in making projections, so the estimates reflect savings for the average population of VA outpatient users over the study period. The results from two models of per-user spending on each drug class are compared to estimate savings. The first model projects spending per user in each month for each class assuming that there was not a National Formulary in effect. The second model estimates spending per user in each month given the actual implementation of the National Formulary for each class. The estimated savings are the differences between the two estimates multiplied by the number of users in each month, summed over the duration of the policy.
The third column of Table 3.5 presents estimates of “real” savings, which represent nominal spending adjusted for changes in the general level of prices in the economy as measured by the Consumer Price Index. This adjustment is made so as not to include economy-wide price rises in the estimated spending over time. Real savings estimates reflect savings calculated retrospectively and adjusted for general inflation. In the fourth column of Table 3.5, the committee also
TABLE 3.5 Estimated Savings (in millions of dollars) from the VHA National Formulary for Closed and Preferred Classes
|
Class |
Nominal Savings ($ millions) |
Real Savings ($ millions) |
Real Discounted Savings ($ millions) |
|
Closed |
|||
|
HMG CoA RIs |
$14.4 |
$13.8 |
$13.5 |
|
PPIs |
$4.9 |
$4.7 |
$4.6 |
|
ACEIs |
$17.6 |
$16.9 |
$16.6 |
|
H2R blockers |
$47.1 |
$45.2 |
$44.2 |
|
Alpha Blockers |
$1.8 |
$1.8 |
$1.7 |
|
Total |
$85.8 |
$82.4 |
$80.6 |
|
Preferred |
|||
|
CCBs |
($13.2) |
($12.8) |
($12.7) |
takes account of the time cost of money to the federal government as measured by the 30-year average of the short-term interest rate on federal securities (about 3% per annum in real terms). All real dollar estimates are presented as 1997 dollars. Because the committee is evaluating the effect of the National Formulary retrospectively, the focus below is on the real estimates of savings.
Table 3.5 shows very large differences in the level of savings across drug classes. In the case of H2R blockers, a closed class initially, the nominal savings were estimated to be $47.1 million and the real savings were estimated to be $45.2 million. In contrast, the HMG CoA RI and ACEI classes realized moderate levels of savings following class closure. For HMG CoA RIs, the committee estimated $14.4 million in nominal savings and $13.8 million in real savings. Savings for ACEIs were estimated to be $17.6 million in nominal terms and $16.9 million in real terms. Closure of the PPI and alpha blocker classes yielded considerably smaller savings. Nominal savings for PPIs were estimated to be $4.9 million, while real savings were estimated at $4.7 million. Both estimated nominal savings and real savings for alpha blockers were approximately $1.8 million. Thus, the total savings associated with closing five of the six closed classes (that is, all but LHRHs) were estimated to be roughly $85.8 million in nominal terms and $82.4 in real terms.
The committee also examined one class (CCBs) that had a combination of committed-use contracts (for diltiazem and nifedipine) and a preferred status contract for one drug (felodipine) that accounted for about 25% of sales. As noted above, detailed information on the BPA for the largest selling drug in the category, diltiazem, was not available. Thus, the estimates are based on a somewhat incomplete model of the class. As reported in the regression analysis, the estimated effect on per-user spending in the CCB class of making felodipine the preferred drug was an increase, suggesting that the effect of National Formulary preferred status was to increase spending. However, the estimated coefficient was
not significant at conventional levels although it was near significance (p<.07). Thus, any estimates of cost increases should be taken with caution. Nevertheless, if the estimated effect on spending for CCBs associated with making felodipine the preferred agent is accepted, CCB spending increased by an estimated $13.2 million in nominal terms and $12.8 million in real terms. Because of the existence of missing data on contracting in the CCB class, the committee presents estimated savings for the closed classes and this preferred class separately.
One possible outcome of class closure could be increased expenditures for other drug classes that include drugs treating the same conditions as those in the closed classes. To explore this hypothesis, the committee examined data on spending for beta-blockers to assess whether any changes were associated with closure of the ACEI class. A regression model for outpatient spending on beta-blockers per outpatient user, where the key variable of interest is the date of class closure for the ACEIs, was estimated for this purpose. An increase in per-user spending on beta-blockers followed the change in status of the ACEI class. However, it is difficult to view this association as causal. National quality-of-care standards for the use of beta-blockers were being implemented during the period of VA National Formulary implementation, creating a potential confounding between the National Formulary and changes in clinical practice. Nevertheless, this observation highlights the need to trace possible shifts in wider prescribing patterns that might occur coincident with changes in formulary policy and underscores the need to exercise caution in drawing conclusions about overall savings based on somewhat incomplete data.
The estimate of gross savings of approximately $82 million for the period beginning with National Formulary implementation through July 31, 1999, is a conservative lower-bound estimate of the true savings from instituting closed and preferred formulary status for a number of classes of prescription drugs for several reasons. First, the estimation method was designed to control for secular trends in VHA spending on prescription drugs. Some portion of these trends may be the result of activities associated with the National Formulary. Second, the data are incomplete. At the most basic level, all data on prices and spending for the LHRH class of drugs are missing. Within the classes analyzed, there were missing data for some specific products, although these were generally low-volume items. Third, the effects of instruments such as BPAs and other contracting vehicles that are made more effective by the threat of class closure are not included as part of the committee's estimates, partly as a matter of data availability on BPA agreements and partly because BPAs differ considerably in form from policies such as class closure. For these reasons, true gross savings in excess of $100 million are quite likely. The committee judged, however, that even the most generous assessment of the upper bound of its estimate would not reach the NAC estimate, which included savings from some contracting activities considered outside the scope of the VA National Formulary. Nor would the most pessimistic assessment of offsetting costs of formulary administration overwhelm the committee 's estimated gross savings.
CONCLUSIONS
An important function of formularies in modern health care systems is to increase the bargaining power of a buyer of pharmaceutical products (for example, a health system or health plan). The enhanced bargaining power allows health care organizations to secure lower prices from manufacturers. The buying power stems from the ability to move market share among products. The VA National Formulary appears to have been quite effective in changing prescribing patterns and moving market share to chosen members of closed classes. This is evidenced by an average compliance level of 90% or more. As a result, the National Formulary has realized sizable price reductions from manufacturers of drugs in closed classes, ranging from 16 to 41% for the most commonly prescribed product forms.
The statistical analyses conducted showed that the National Formulary 's closed classes are associated with reductions in average outpatient pharmacy spending per outpatient VHA user relative to what spending would have been absent the National Formulary. After controlling for secular trends in pharmaceutical utilization, time-invariant unmeasured differences between VISNs, and the changing demographic composition of VHA users, the statistical analyses yielded estimates that the National Formulary resulted in decreases in per-user outpatient pharmacy spending of between 7 and 41% for the closed classes.
A conservative, lower-bound estimate of gross savings achieved by the National Formulary on the closed and preferred classes (excluding LHRHs, for which data were unavailable) is approximately $82 million, as described above. To calculate net savings, an estimate of costs associated with implementing and managing the National Formulary is needed. A complete estimate of VHA systemwide expenditures associated with implementing and managing the formulary could not be calculated by the VA PBM. However, the magnitude of estimated expenditures by the PBM ($2.7 million in nominal terms over the period FY 1997 to FY 1999, or approximately 3% of estimated savings) suggests that systemwide management costs for the National Formulary are substantially lower than the estimated reductions in pharmacy spending associated with National Formulary adoption. In the fixed budget environment in which the VHA operates, any savings achieved by negotiating lower prices with pharmaceutical manufacturers can be used to expand health care services to veterans. Although the National Formulary has closed only a small number of drug classes, 6 of 254, these six classes represent a significant proportion of total VHA pharmaceutical expenditures and contain drugs that, on drug class review, are shown to have similar safety and effectiveness profiles. It is unclear whether expansions in the number of closed and preferred classes would continue to achieve similar levels of savings for the VHA. This issue is under consideration and evaluation by the GAO.
An exploratory analysis of cross-service sector impacts of the National Formulary was conducted. In examining inpatient discharge data for diagnoses potentially linked to two of the National Formulary closed classes (diagnoses of
heart conditions for ACEIs and diagnoses of ulcer-related conditions for PPIs), the committee found no evidence of increases in hospital use per VHA user for conditions linked to these two National Formulary closed classes. Although this result is suggestive, it is important to recognize that these analyses were quite crude. Thus, the question of how the National Formulary might affect quality of care and other types of VHA health spending is far from settled.
Additional data are needed to provide a more complete evaluation of the effects of the National Formulary on VHA expenditures with respect to the effect on expenditures for the LHRH class and whether the National Formulary resulted in increased utilization in other drug classes or elsewhere in the VHA system. Efforts to construct a database to provide for a comprehensive assessment of the economic effects of the National Formulary revealed that the VHA does not currently have the capacity to provide a number of basic data elements for the purposes of evaluating programmatic innovations such as the National Formulary. The committee has noted several times that data problems and other constraints led to inclusion of fewer items in its analysis than in the NAC analysis of savings and to an underestimate of the savings due to the National Formulary. The VHA pharmacy expenditures for the time period analyzed (approximately July 1997 to July 1999), moreover, estimated from FY 1997, 1998, and 1999 VHA pharmacy expenditures (of $1,337,487,000, $1,548,424,000, and $1,844,742,000, respectively [GAO, 1999]), were slightly greater than $3 billion. The committee 's more generous, upper-bound estimate of $100,000,000 in National Formulary savings over the 2 years in question is about 3% of total pharmacy expenditures, therefore, (or stated another way, about 15% of the cost of the six analyzed drug classes) a real, but perhaps not dramatic savings, nor one that likely approaches the potential if more preferred or closed classes were created. Undoubtedly, greater savings are realized currently by mandatory generic substitution (see that section of Chapter 2 and Figure 2.5 ; CBO, 1998).


