
Page 87
B
Funding Data
TOTAL BUDGET OF THE OFFICE OFFUSION ENERGY SCIENCES
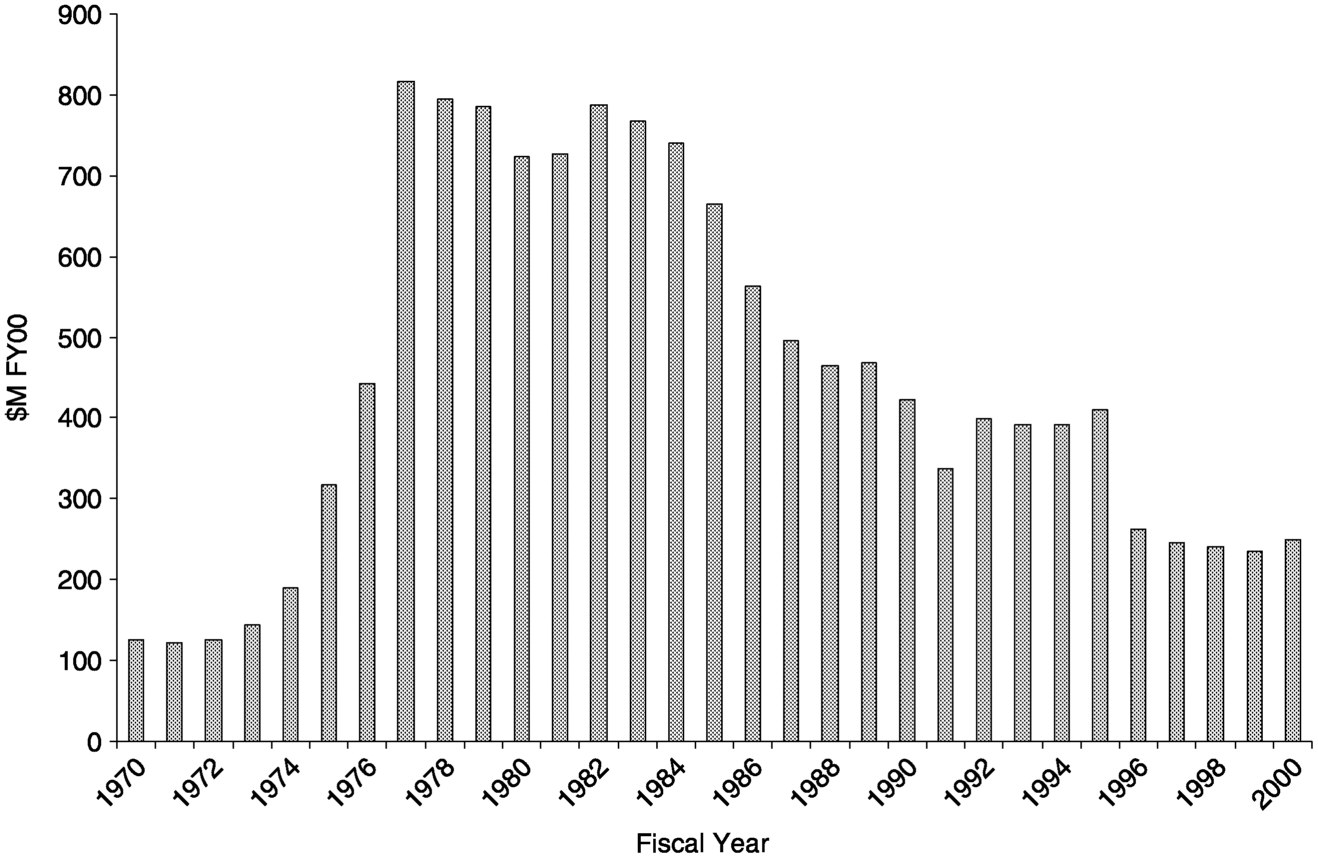
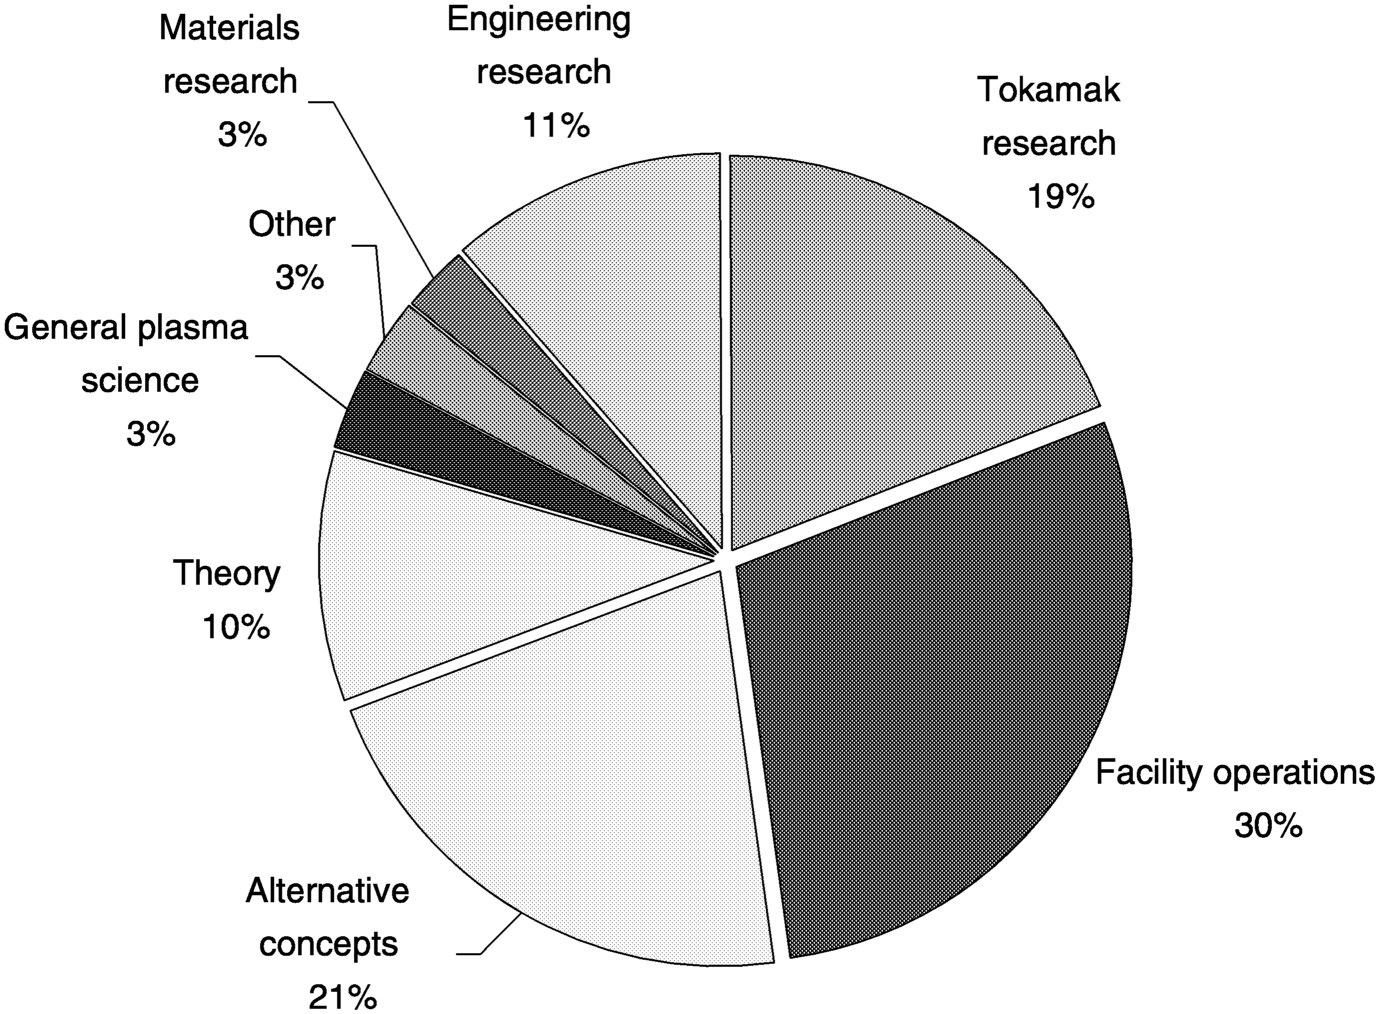
The total OFES budget figures shown in Figure B.1 are the Congressional appropriation numbers in FY00 dollars and do not include general reduction costs to the program. The allocation of OFES funding to particular categories is shown in Table B.1 for FY97 to FY00. The percentage shares for FY00 are shown in Figure B.2.
~ enlarge ~
FIGURE B.1 Congressional funding of magnetic fusion R&D, FY70 to FY00. SOURCE: Richard E. Rowberg. 2000. Congress and the Fusion Energy Sciences Program: A Historical Analysis, Washington, D.C.: Congressional Research Service.
Page 88
|
Fiscal Year |
||||
|
Budget Category |
1997 |
1998 |
1999 |
2000 |
|
Tokamak research |
48.7 |
46.2 |
45.8 |
47.1 |
|
Facility operations |
60.8 |
56.1 |
60.2 |
70.1 |
|
Alternative concepts |
16.4 |
24 |
37.3 |
52.3 |
|
Theory |
18.4 |
19.8 |
22.7 |
24.6 |
|
General plasma science |
3.8 |
5.1 |
6.2 |
8.2 |
|
Other |
14.3 |
6.9 |
6.9 |
7.4 |
|
Materials research |
6 |
7.7 |
6.8 |
7.2 |
|
Engineering research |
56.3 |
58.3 |
36.7 |
27.8 |
|
Total |
224.7 |
224.1 |
222.6 |
244.7 |
~ enlarge ~
FIGURE B.2 Funding profile for OFES in FY00, $245 million spent dollors.
Page 89
NATIONAL SCIENCE FOUNDATION/DEPARTMENT OF ENERGY PLASMA PHYSICS PARTNERSHIP FUNDING
According to OFES, it spent the following amounts under the NSF/DOE plasma physics partnership: FY97, $2.030 million; FY98, $2.878 million; FY99, $3.369 million; FY00, $4.121 million. According to the NSF, it spent the following amounts for the NSF/DOE plasma physics partnership (these figures do not represent the full NSF investment in plasma science and engineering; instead, they represent contributions for the partnership): FY97, $2.75 million; FY98, $2.75 million; FY99, $2.75 million; and FY00, $3.00 million.
OFFICE OF FUSION ENERGY SCIENCES FUNDING TO UNIVERSITIES
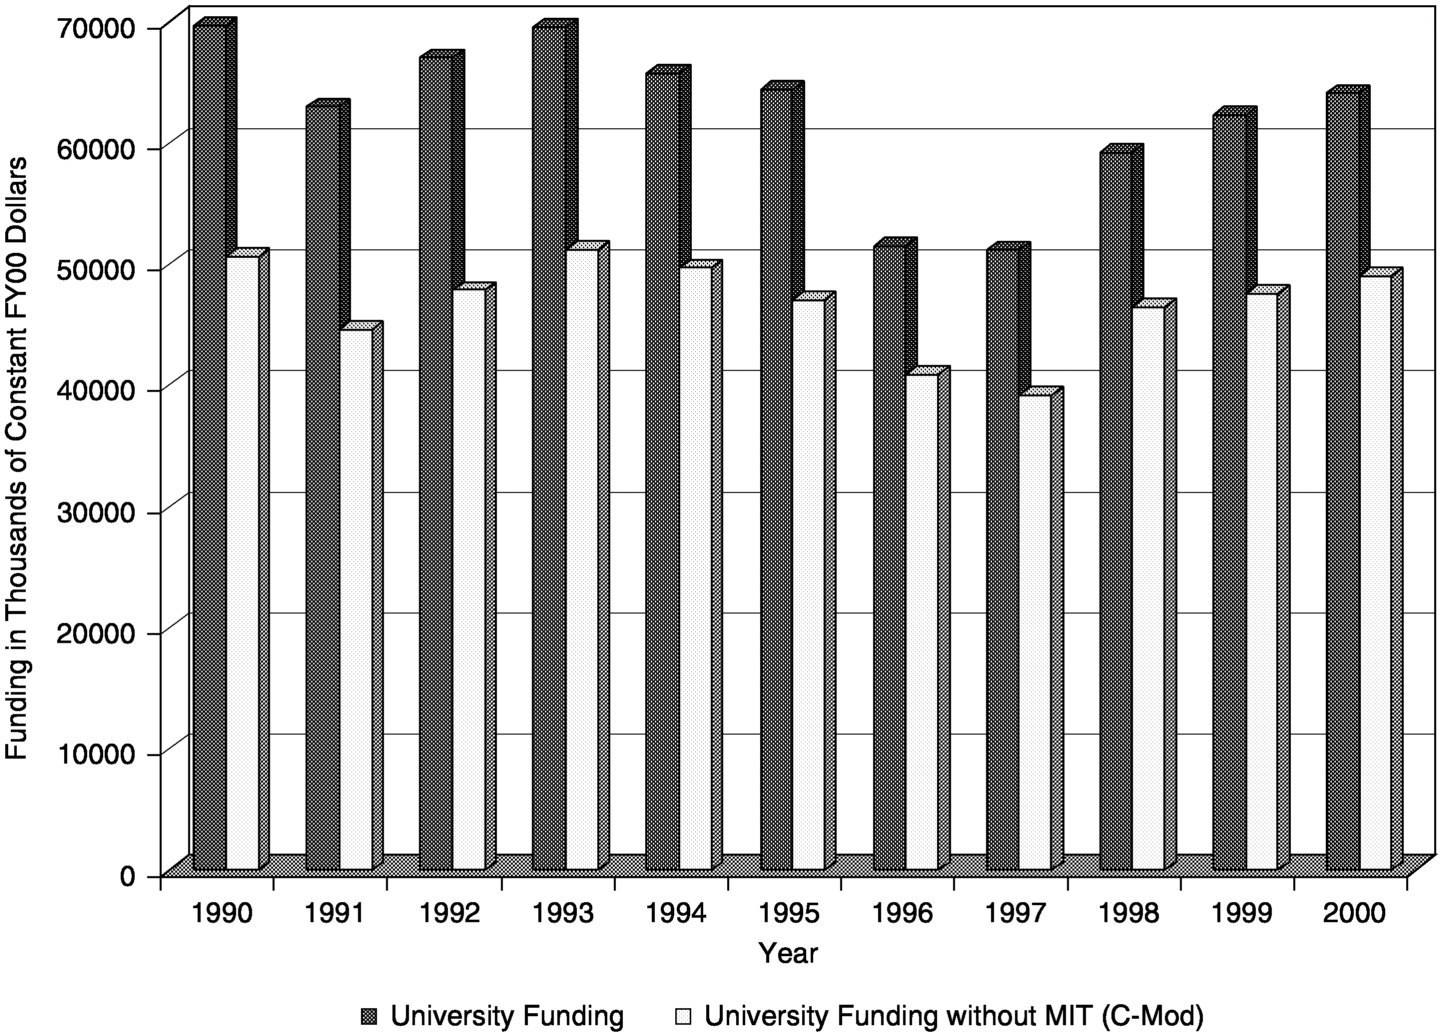
In FY99 and FY00, OFES funding for various university research activities in fusion energy science was distributed as shown in Table B.2 (the total OFES budget was about $240 million): The sharp dropoff in enabling R&D funding between 1999 and 2000 is associated with a decrease in pass-through monies for ITER superconducting magnet development work being done at the Massachusetts Institute of Technology.
Funding of fusion energy sciences at universities by the OFES with and without MIT is shown in Figure B.3 . These data do not include pass-through funds sent to universities for ITER-specific expenses that were not spent on research, such as operation of the ITER co-center and industrial tasks (magnets, etc.) in 1992 to 1999. FY00 dollars are actual figures through April 2000 and estimates for the rest of the fiscal year.
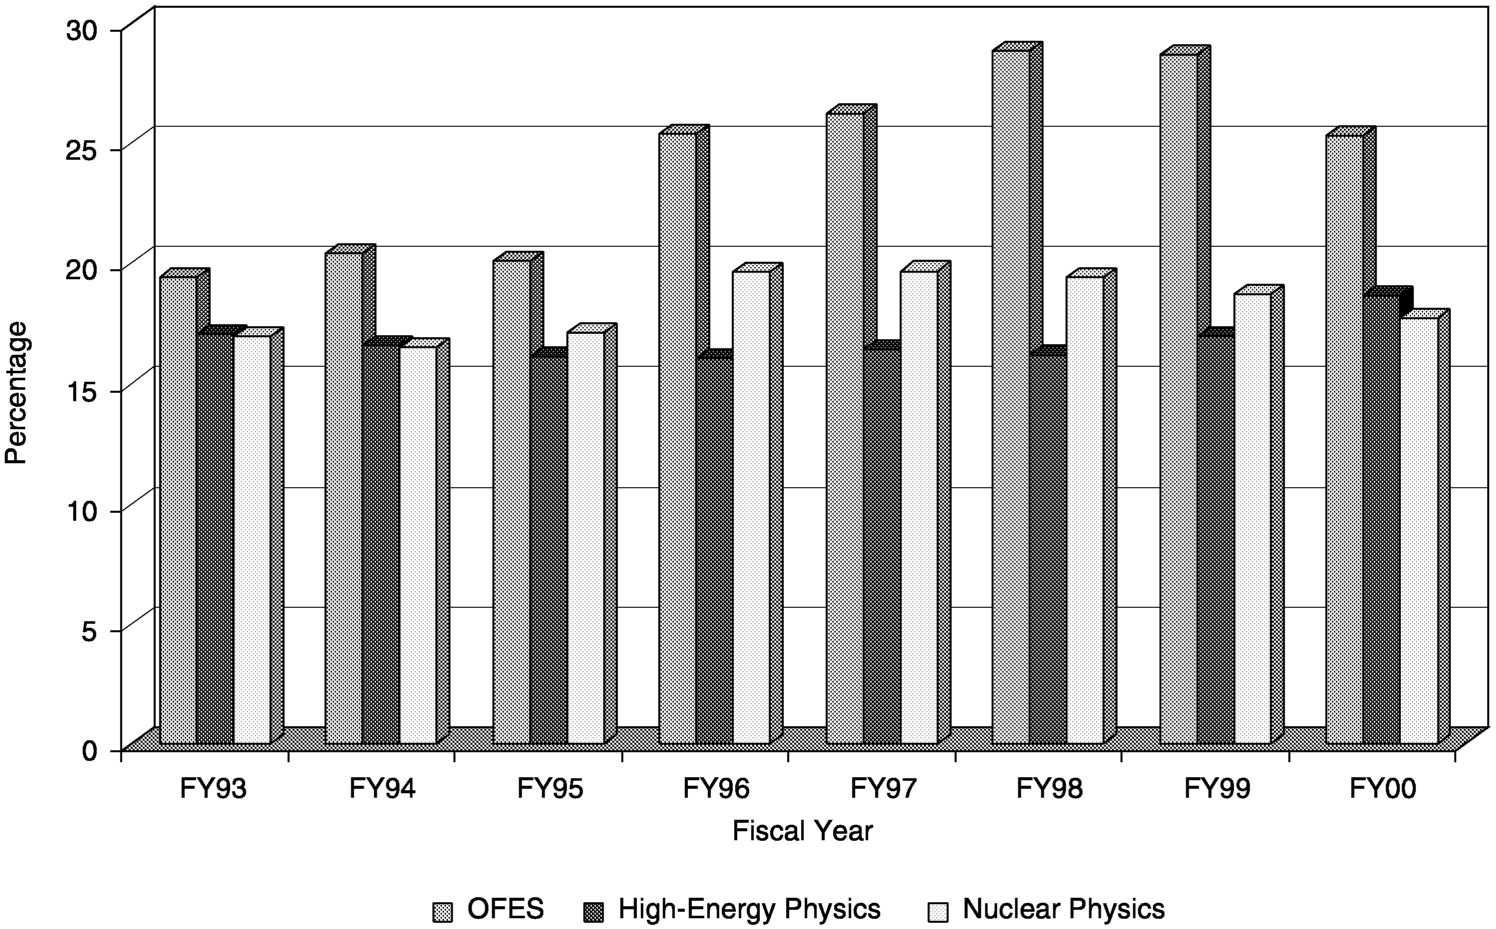
Figure B.4 shows the distribution of DOE funding for three categories of R&D at colleges and universities (total of direct and indirect costs). These numbers reflect data reported by DOE to the Office of Management and Budget under Schedule C, categories 1441-01 (direct) and 1442-01(indirect). They exclude funds for FFRDCs administered by universities (e.g., PPPL and the Stanford Linear Accelerator Center (SLAC)). The total for each program is the total appropriated minus any below-the-line general or targeted reductions (e.g., contractor travel reductions).
|
Item |
FY99 |
FY00 |
|
Major facilities (PPPL, General Atomics, MIT) |
19.235 |
19.744 |
|
Smaller facilities |
13.604 |
16.671 |
|
Diagnostics |
3.232 |
3.210 |
|
Theory |
8.551 |
9.126 |
|
General plasma science |
4.310 |
5.103 |
|
Enabling R&D |
16.553 |
9.192 |
|
Total |
65.485 |
63.046 |
Page 90
~ enlarge ~
FIGURE B.3 Office of Fusion Sciences funding of fusion energy sciences at universities, with and without the Massachusetts Institute of Technology. SOURCE: Office of Fusion Energy Sciences.
~ enlarge ~
FIGURE B.4 Distribution of university funding for DOE's fusion and high-energy and nuclear physics programs as a percentage of the total funding for those programs. SOURCE: DOE Congressional Funding Office via the Office of Management and Budget.


