
5
Observational Challenges of Low-Level Radar Coverage in Complex Terrain and Coastal Areas
Regions of complex terrain present a challenging environment for using NEXRAD to observe potential flash flood-causing weather systems. Two of the more serious problems are those of beam blockage and beam overshoot. The scanning radar beam can be partially or completely blocked for various directions when the radar is sited in an area surrounded on some sides by higher terrain (Westrick et al., 1999; Young et al., 1999). Placing the radar at a higher elevation or on a mountaintop may alleviate this problem, but doing so may cause the radar beam to overshoot lower levels. As a result, the precipitation intensity can be underestimated, or some precipitation may go undetected altogether (Brown et al., 2002; Wood et al., 2003a).
NEXRADs sited near the coast are especially valuable for providing observations over the ocean where little other data are available. This is particularly true for the west coast of the United States, where weather systems approach predominantly from the west. However, the observational challenges posed by complex terrain are compounded for coastal regions because of the presence of a large water body that affects the atmospheric conditions. Variations in atmospheric temperature, moisture, and pressure can significantly alter the propagation of a radar signal, affecting the radar’s ability to detect and quantify precipitation. Deploying a radar along a coastal mountain range must be a compromise between providing offshore low-level coverage and avoiding negative effects of atmospheric conditions on radar signal propagation. Low-level coverage is important for weather systems approaching the coastal mountains of the West during the winter and early spring, because these systems tend to be shallow yet still produce significant rainfall intensities and amounts. By the time rainfall is detected and measured by in situ rain and stream gauges, there can be little time to disseminate river and streamflow forecasts and flash flood warnings. Therefore, advanced detection of approaching weather systems by radar
plays a critical role in flash flood prediction. These observational challenges posed to NEXRAD in complex terrain and coastal regions—for example, in Southern California’s Ventura and Los Angeles Counties—are discussed in more detail in this chapter.
BEAM VISIBILITY
Propagation of radar waves in the atmosphere is a well-understood process (Bean and Dutton, 1966). If the atmospheric properties such as temperature, humidity, and pressure are known, the propagation path of the radar beam is easy to characterize. Design studies of radar networks usually assume a standard atmosphere (Doviak and Zrnic, 1985). Assuming that the beam propagates under standard atmospheric conditions allows determination of the potential interactions of the beam with the surrounding terrain. To achieve this, two other factors must be considered. First, the radar beam spreads as it propagates away from the radar so that the NEXRAD beam is more than 1 km wide at a distance of about 60 km from the radar site. Second, the power distribution within the radar beam is not uniform; most of the power is concentrated near the main axis of the beam, and the intensity falls off approximately following a Gaussian pattern. Thus, to properly determine the extent to which terrain affects radar observations, detailed information about the terrain, location, and hardware parameters of the radar and its scanning pattern (i.e., antenna elevation angle) must be known in addition to atmospheric conditions.
Complete blockage of the radar beam by terrain features occurring at a given distance and direction prevents detection of weather echoes past the location of the blockage. The blocking element (i.e., hills, mountains, nearby buildings) leads to a strong and permanent echo that is visible on the radar display. If the radar beam is only partially blocked, it may still be useful for observing weather echoes if the amount of power remaining in the beam is large enough for the radar return to be above the signal detection level. However, precipitation observations collected by partially blocked radar beams may lead to biased results if left uncorrected. Corrections for partial beam blockage can be part of radar data processing algorithms, but correcting the data often is difficult because the degree to which the beam is obstructed rarely is known accurately (Seo et al., 2000; Kucera et al., 2004). In addition, the corrections may rely on assumptions that are difficult to verify because complex terrain modifies observed echo patterns (Warner et al., 2000; Ralph et al., 2003).
There are two approaches to evaluating beam blockage patterns for a given location. The first approach is based on using terrain elevation data, such as those available from digital elevation models (DEMs). For the United States, digital elevation data are available with a spatial resolution of about 30 m and in some locations even 10 m. (Airborne lidar technologies exist to provide such data with a resolution of 1 m.) Knowing the topography, radar location, and parameters such as beamwidth and antenna pointing direction, and assuming standard atmospheric conditions, one can calculate the power loss in the radar beam along its propagation path (Kucera et al., 2004). Chapter 7 provides more information about this method (including a schematic representation) and shows specific calculations for the Sulphur Mountain radar and adjoining radars.
The second approach is based on actual data collected by radar. One can calculate the spatial patterns of the probability of detection (POD) of an echo as the ratio of the number of returns exceeding a certain threshold of radar reflectivity (e.g., 20 dBZ) and the total number of scans. If such calculations are based on a sufficiently large dataset, a clear pattern will emerge. Backscatter from the terrain that completely blocks the beam will be detected all the time, and beyond these obstacles there will be echo voids. For unblocked areas, POD values will correspond to the climatological frequency of rainfall (about 5 percent for most of the United States); partial beam blockage will result in values somewhere in between. This last result may come as a surprise, but it is a consequence of the fact that the propagation conditions usually deviate from those of the standard atmosphere. The advantage of the DEM-based procedure is that it can be used in the network planning stage, but its weakness is the assumption of particular (e.g., standard) propagation conditions. On the other hand, the radar data-based analysis shows the actual patterns of radar coverage, but it requires processing large amounts of data and may be attempted only after the radar has been deployed for a significant amount of time to collect data.
PROPAGATION OF ELECTROMAGNETIC RADAR SIGNALS
As noted above, the propagation of microwave signals, such as those transmitted by radar, is influenced by atmospheric conditions. Deviations of the spatial distribution of moisture, temperature, and/or pressure from the standard atmosphere may lead to nonstandard or anomalous propagation (AP) of radar signals, perturbing the position in space illuminated by the radar as well as the quality of data obtained. Anomalous propagation condi-
tions can lead to significant contamination of radar data from ground echoes normally not seen by the radar. Such echoes must be recognized and acknowledged for operational applications such as precipitation nowcasting and flash flood warning.
Radar reflectivity due to anomalous propagation may resemble that of precipitation (e.g., Steiner and Smith, 2002, and references therein). Contamination of radar reflectivity from the ground due to anomalous propagation is limited primarily to the lowest scan or two (e.g., below 2° elevation). These echoes may be recognized easily by a well-trained person on the basis of the great spatial variability of the reflectivity and near-zero radial Doppler velocity of the AP echoes. This is particularly true for anomalous propagation echoes over land, but less so over water. Nonetheless, the development of automated procedures for radar data quality control to deal with AP echoes remains a challenge today (Alberoni et al., 2001; Krajewski and Vignal, 2001; da Silveira and Holt, 2001; Charalampidis et al., 2002; Steiner and Smith, 2002). Many locations across the United States experience atmospheric conditions leading to anomalous signal propagation on a regular basis, as highlighted by Steiner and Smith (2002). Coastal areas, including southern California, are particularly prone to this problem. For other areas, anomalous propagation conditions may be limited to nighttime or vary by season.
Refractive Index and Signal Propagation
A commonly used quantity to describe the propagation behavior of electromagnetic signals is the index of refraction or refractivity (Box 5.1). The vertical gradient of the refractivity within the lowest several hundred meters above the ground is especially important for characterizing radar signal propagation (e.g., Pratte et al., 1995). The normal decrease in atmospheric refractivity with altitude tends to bend the radar rays downward so as to extend coverage beyond that expected with a uniform atmosphere. There are four basic modes of propagation, including subrefraction, normal refraction, superrefraction, and trapping or ducting (Box 5.1). The abnormal propagation of electromagnetic waves is called anomalous propagation.
Trapping or ducting is the most severe case of anomalous signal propagation and results in ground returns (AP echoes) from distant locations where the radar beam intersects the ground or objects at Earth’s surface (Figure 5.1). In order to propagate energy within the duct, the angle that the radar beam makes with the duct should be small, usually less than a degree; thus, only the lowest-elevation scans of surface-based radar are affected.
|
BOX 5.1 The index of refraction, n, or the refractivity, N, can be approximated by (1) where p is the barometric pressure in millibars, e is the partial pressure of water vapor in millibars, and T is the absolute temperature in degrees Kelvin (Bean and Dutton, 1966; Gossard, 1977; Skolnik, 1980; Babin, 1996; Fabry et al., 1997). The decrease of refractivity with height can be defined as
A simplified approximate model of propagation in atmospheric ducts (Skolnik, 1980) predicts a maximum wavelength, λmax, that can be propagated in a surface duct of depth, d, as given by (2) where λmax, dh, and d are in the same units (e.g., meters). |
Only those radar beams launched nearly parallel to the duct will be trapped. However, often only parts of the radar beam may be trapped (Figure 5.2). Atmospheric ducts generally are tens to hundreds of meters thick (Gossard, 1977; Cook, 1991; Babin, 1996; Brooks et al., 1999). Box 5.1 presents a simplified model for estimation of the maximum wavelength that can be propagated in a duct depending on its depth. For an operational NEXRAD with a wavelength of 10 cm (S-band), the duct must be at least 22 m thick for trapping to occur (Heiss et al., 1990; Baer, 1991; Crum et al. 1998).
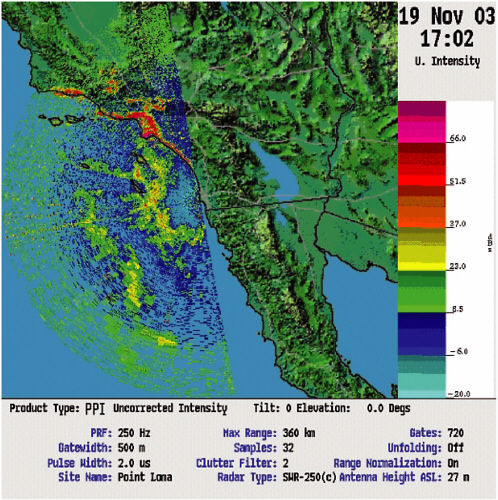
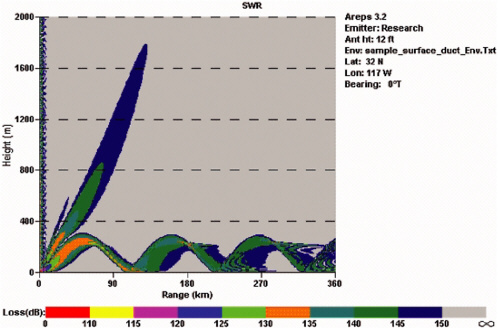
FIGURE 5.2 Numerical simulation of radar signal propagation under surface ducting conditions with parts of the radar beam’s signal being trapped. SOURCE: Richard Paulus, Space and Naval Warfare Systems.
A duct is produced when the index of refraction decreases rapidly with height. To achieve this, the temperature must increase and/or the humidity (water vapor content) must decrease with height. Temperature inversions must be very pronounced to produce superrefraction, while water vapor gradients are more effective than temperature gradients alone (Fabry et al., 1997). A common cause of ducting is the movement of warm dry air from land over cooler bodies of water (e.g., ocean) causing a temperature inversion in the boundary layer. At the same time, moisture is added by evaporation from the water surface, producing a moisture gradient (Skolnik, 1980; Puzzo et al., 1989). Evaporation ducts are common just above the surface of the sea, where air may become saturated by evaporation from the sea surface. Over land, ducting often is caused by radiational cooling during
clear nights, particularly in summer when the ground is moist. Thus, over land, ducting is most noticeable at night and tends to disappear during the warmest part of the day (e.g., Moszkowicz et al., 1994). Superrefraction or ground ducts also may be produced by the diverging downdraft under a thunderstorm and resulting gust fronts. The relatively cool air, which spreads out from the base of a thunderstorm, may produce a temperature inversion within the lowest layer, possibly several hundred meters thick. The moisture gradient along the outflow boundary also is appropriate for the formation of a duct. The conditions favorable for the formation of a thunderstorm duct are relatively short-lived and have time scales on the order of 30 minutes to an hour, although in extreme cases such conditions may last for hours (Weber et al., 1993).
Climatological Assessment of Signal Propagation for the Southwestern United States
Using a 16-year record of operational sounding data (1973–1988), the potential for anomalous propagation conditions to occur throughout the continental United States was assessed climatologically by Steiner and Smith (2002). Similar studies, for example, have been conducted by Bech et al. (2000, 2003) using soundings for Mediterranean coastal sites, Babin (1996) using helicopter-based refractivity measurements off the coast of Wallops Island (Virginia), and Gossard (1977) using air mass analyses. For each sounding, Steiner and Smith (2002) determined the average refractivity gradient in the lowest 500 m (1640 ft) above ground level (AGL). (The maximum gradient might be more relevant for the radar signal propagation problem; however, the limited and variable vertical resolution of the operational sounding data may result in questionable maximum gradient values.) These values were then compiled into a climatology of average refractivity gradients for each operational sounding station and used to study the likelihood of atmospheric conditions across the United States that are susceptible to anomalous propagation of radar signals. The sounding-based climatology highlights large-scale temperature inversions and moisture gradients, yet only by chance does it capture conditions favorable to anomalous propagation produced by thunderstorm outflow boundaries. Moreover, relatively thin layers of strong vertical gradients may cause anomalous propagation, but the operational sounding data (variable resolution of one to several hundred meters) do not resolve tens of meters in the vertical. Alternatively, high-resolution refractivity profiles may be obtained, for example, from detailed atmospheric measurements aboard an airplane (e.g., Babin, 1996,
used a helicopter) or combined profiler and radio acoustic sounding systems (RASS) (Gossard et al., 1995). Lidar-based observations of temperature and water vapor (e.g., Eichinger et al., 1993, 1999) may also provide a basis for obtaining high-resolution refractivity information. In addition, Fabry et al. (1997) and Fabry (2004) showed that radar-based phase measurements of ground targets can be used to reveal the spatial, near-surface structure of atmospheric conditions and thus the index of refraction.
Many areas of the continental United States have conditions that can create anomalous propagation on a regular basis (Steiner and Smith, 2002). The southwestern part of the United States, particularly Southern California, is especially prone to this problem (Gossard, 1977; Pappert and Goodhart, 1977; Babin and Rowland, 1992; Burk and Thompson, 1997). Significant local, regional, diurnal, and seasonal differences are found among the different sounding stations, as highlighted in Figures 5.3 and 5.4. Figure 5.3 shows analyses based on the 12 UTC (coordinated universal time) soundings, reflecting nighttime conditions ranging from 4 a.m. LST (local standard time) on the West Coast to 7 a.m. (about sunrise) at the East Coast. Figure 5.4 is based on the 00 UTC soundings, highlighting conditions in the late afternoon, ranging from 4 p.m. LST on the West Coast to 7 p.m. (about sunset) on the East Coast. Both figures show the distribution of average refractivity gradients within 500 m (1640 ft) AGL for each operational sounding station. The critical categories of “superrefraction” and “trapping” are shaded in gray and black, respectively, and the fraction of the box covered indicates the percentage of soundings exhibiting such atmospheric conditions.
The general nighttime pattern revealed by Figure 5.3 is that conditions of superrefraction may occur anywhere in the southwestern part of the United States. During the winter season (Figure 5.3a), superrefractive propagation conditions occur most likely south of 40°N latitude, particularly along the coastlines. For those areas, on average, superrefractive conditions may occur at least once a week and may be two or three times for Southern California. The maximum likelihood of superrefractive conditions is displayed during the summer (Figure 5.3c), when chances for such conditions to occur exceed 20 percent throughout most of the United States and are greater than 30 percent for Southern California and most of the eastern seaboard states (see Figures 1 and 2 of Steiner and Smith, 2002). The spring (Figure 5.3b) and fall seasons (Figure 5.3d) also show widespread conditions of superrefraction at least once a week, with local maxima in excess of 30 percent generally south of 40°N latitude and throughout states bordering the ocean. Significant trapping conditions (at least once a week) occur
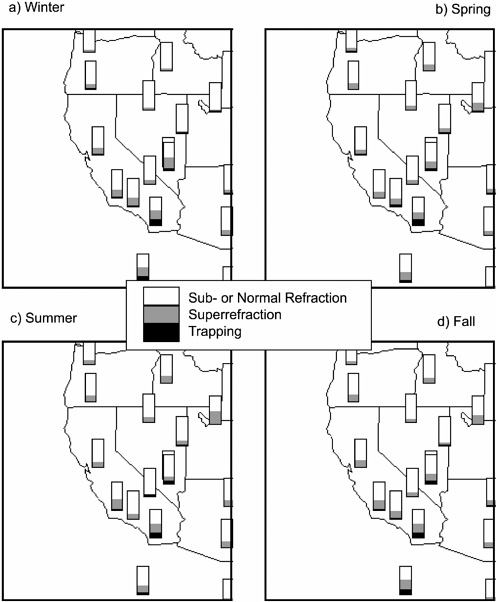
FIGURE 5.3 Average refractivity gradient within 500 m AGL based on a 16-year climatology of operational soundings taken at 12 UTC and shown by season. The fraction of a box shaded either gray (superrefraction) or black (trapping) indicates the percentage of soundings of that particular station exhibiting the respective atmospheric conditions. SOURCE: Adapted from Steiner and Smith (2002).
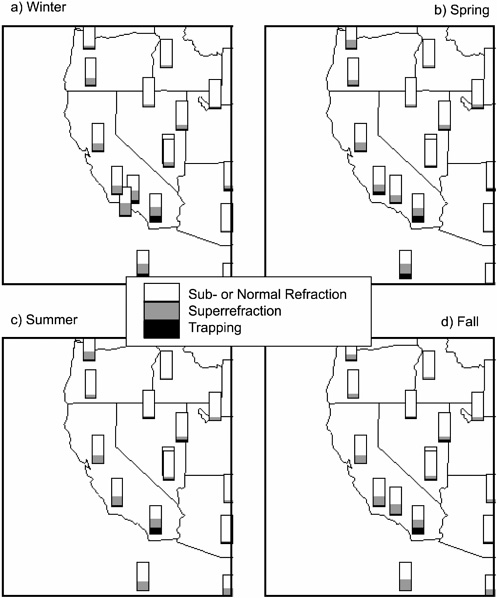
FIGURE 5.4 Same as Figure 5.3, but for soundings taken at 00 UTC. SOURCE: Adapted from Steiner and Smith (2002).
mainly in Southern California essentially throughout the year. The seasonal nighttime patterns depicted in Figure 5.3 are also visible during daytime conditions, as shown in Figure 5.4. Conditions of superrefraction at least once a week are seen throughout the year in the coastal states. In Southern California, superrefractive conditions occur two to three times a week, while trapping conditions exist approximately 20 percent of the time.
Figure 5.5 visualizes the month-to-month variation of the distribution of mean refractivity gradients within 500 m (1640 ft) AGL for soundings taken near San Diego, California. Signal propagation conditions vary relatively little throughout the year. Clearly, conditions of superrefraction and trapping appear to be the dominant modes of signal propagation. This result is in close agreement with temperature inversion statistics compiled based on soundings collected on San Nicolas Island off the shore of Los Angeles by the Naval Air Systems Command Weapons Division (located at Point Mugu) over approximately two decades (Table 5.1). These statistics demonstrate that temperature inversions are a common feature of nearly all atmospheric temperature soundings collected off the shore of California. The average height of the inversion base falls between approximately 300 and 650 m (984 and 2133 ft) with an inversion top at about 500 to 900 m (1640 to 2953 ft), although this varies somewhat diurnally and also by season. Figure 5.6 reveals that during the rainy winter months (i.e., January through April), approximately 80 percent of the inversion top heights fall at or below the altitude of the Sulphur Mountain and Santa Ana Mountain NEXRAD, while approximately 65 percent of the inversion top heights reach higher than the altitude of the Vandenberg Air Force Base (AFB) NEXRAD. Thus, the two radars located at a higher elevation clearly are much less exposed to temperature inversions than the lower Vandenberg AFB radar. Because anomalous propagation conditions appear to be a legitimate basis of concern for radars near the Southern California coastline, minimizing this problem is a valid consideration for siting NEXRADs. In the case of the Sulphur Mountain radar, its higher elevation is necessary for mitigating problems with anomalous propagation.
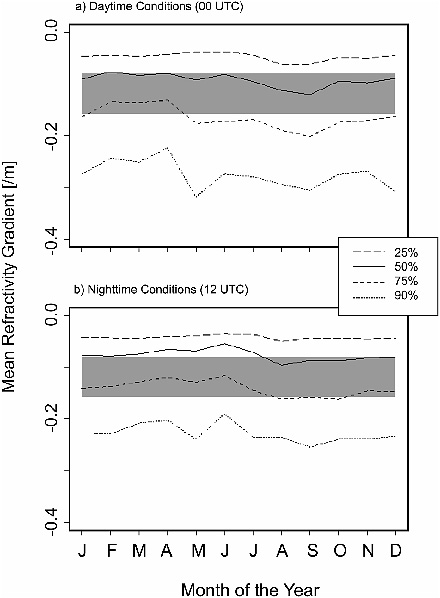
FIGURE 5.5 Distribution of mean refractivity gradients within 500 m AGL based on a 16-year climatology of operational soundings taken near San Diego, California. Shown are contours of equal percentiles of the respective monthly distributions. Superrefractive propagation conditions are indicated by the gray-shaded area. SOURCE: Matthias Steiner, Princeton University.
TABLE 5.1 Temperature Inversion Statistics for San Nicolas Island, California, Compiled by the Naval Air Systems Command Weapons Division Based on Soundings taken from July 1975 through August 1993
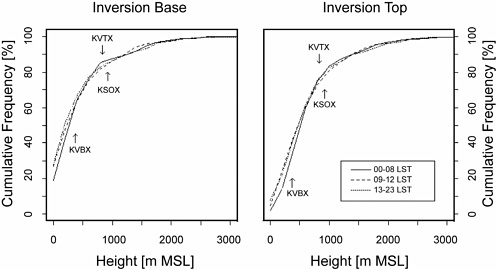
FIGURE 5.6 Cumulative frequency distribution of temperature inversion (a) base and (b) top heights based on soundings collected at San Nicolas Island, California, from July 1975 through August 1993. Shown are statistics for elevated inversions only (i.e., excludes surface-based inversions) for the rainy season months of January through April, stratified by the time of day collected. The data shown correspond to those displayed in Figures 2–7 of the Fisk (1994) report. SOURCE: Matthias Steiner, Princeton University.


