
3
Scope and Methodology
3.1
STUDY SCOPE
This National Research Council (NRC) study focuses on the National Science Foundation’s (NSF’s) Small Business Innovation Research (SBIR) program, examining the program’s performance in meeting each of the following four SBIR legislated objectives:
-
Stimulate technological innovation;
-
Increase commercialization of innovation;
-
Use small business to meet federal R&D needs;
-
Foster participation by minority and disadvantaged persons in technological innovations.
The study also examines the effectiveness of the NSF’s management of its SBIR program, including resources, topic definition, solicitations, proposal selection, commercialization assistance, and general oversight of the program.
3.2
METHODOLOGY DESIGN
This study of the NSF’s SBIR program and the study’s findings and recommendations are based on a research methodology designed by the Committee, approved by an independent panel of experts, and described in more detail in the study’s “Methodology Report.”1 The study uses multiple methods to allow
cross-checking and confirmation of findings that emerge from any single method. Multiple methods are also necessary to examine the several objectives of the SBIR program, which vary in their relative tractability to quantitative and qualitative approaches. The core methodologies used in generating the data underlying the findings of this report are: surveys of firms that participated in the SBIR program; interviews with NSF SBIR officials and program managers; review of program documents and other relevant literature; analysis of program data; and case studies of firms.
3.3
METHODS USED
3.3.1
Surveys
Three surveys were sent to SBIR firms: (1) Phase II Survey; (2) Firm Survey; and (3) Phase I Survey.2
The first listed survey was focused on a sample of Phase II NSF SBIR grants. This Phase II Survey had 162 respondents. The focus of the Phase II Survey was on specific grants and their commercial outcomes.
The second survey explored the SBIR program’s influence on small businesses more generally. Responding to this survey were 137 companies identified primarily as NSF Phase II grant recipients. The survey asked questions about the background experience of each firm’s founders, the receipt of Phase I and Phase II awards, and the influence of the SBIR program on firm founding, commercial progress, and growth.
The third survey was focused on a sample of Phase I NSF SBIR grants, primarily for the purpose of identifying and learning more about those Phase I grants that did not receive a direct follow-on Phase II grant. The Phase I Survey had 248 respondents, of which 135 received Phase I grants that were not followed by a direct follow-on Phase II grant, and 113 received Phase I grants that were followed by a direct follow-on Phase II grant. Those that did receive a follow-on Phase II grant were asked if they received assistance and from whom.
The methodologies of these three surveys are described in more detail in Appendixes B and C. These descriptions reveal the initial sample sizes, adjustments to the samples, response rates, and statistics on response rates. These appendixes also provide the survey instruments as well as survey results for individual questions. The number of respondents to each question and the base numbers used to calculate percentage responses are also given. In considering these firm survey results, it is worth keeping in mind the possibility of response biases that could significantly affect the survey results. For example, it may be possible that some of the firms that could not be found have been unsuccessful and folded.
It may also be possible that unsuccessful firms were less likely to respond to the survey. (See Appendixes B and C for details about the survey methodologies, survey instruments, and responses to individual questions.)
NSF SBIR Program Manager Survey. A separate survey was sent to the relatively small group of NSF SBIR program managers. NSF SBIR officials declined having their program managers complete the survey and provided a single response to this survey prepared by the NSF SBIR program’s senior advisor, Dr. Joseph Hennessey.
3.3.2
Interviews with NSF SBIR Managers
Multiple interviews were conducted with NSF SBIR program officials and program managers. The interviews explored various aspects of program operations and how they have changed over time, past and current management practices, and possible program modifications.
3.3.3
Review of Program Documents and Data
Documents of the NSF SBIR program that were reviewed for the study included internal copies of evaluation studies, related data tables and success stories, survey and interview guides, success stories known as “nuggets,” annual reports, reports by the Committee of Visitors, staff presentations, program guidelines, solicitation materials, examples of funded projects, and other materials.
The NSF SBIR Office provided data on proposals and grants by individual records. Analysis of these data informed the program description and often figured in the analysis of program outputs.
3.3.4
Case Studies of Firms
Case studies were prepared for ten selected companies located in seven states: California, Ohio, Tennessee, Minnesota, Arizona, Vermont, and Michigan. The companies are developing ten different technologies from a variety of disciplines, including software, electrochemical processes, information technology for pest monitoring and control, electronics, manufacturing processes, and nanomaterials.
The oldest company is more than 20 years old and the youngest was just 2 years old at the time of the interview. The smallest company has about a dozen employees, the largest nearly 150.
Among the case-study companies are a university spin-off, a large company spin-off, a small company spin-off, a company started by a graduate student, a company started by university faculty, a company started by a retired large company executive, several companies started by entrepreneurs leaving other com-
|
Box A Multiple Sources of Bias in Survey Response Large innovation surveys involve multiple sources of bias that can skew the results in both directions. Some common survey biases are noted below.
|
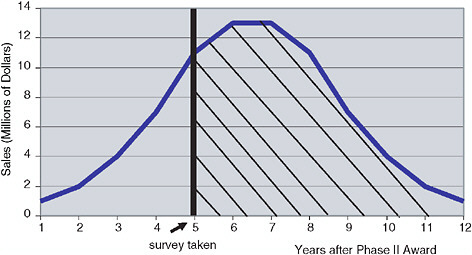
FIGURE A-1 Survey Bias due to Commercialization Lag.
|
panies, and one firm started by a professor-husband and entrepreneur-wife team. The case studies include two woman-owned companies, one of which is actively operated by a woman who is also a member of a minority group.
The sample includes companies that were able to commercialize a product very quickly and companies whose technologies are taking considerable time to commercialize. Commercialization strategies of these firms include licensing agreements, contract research, sales of product produced in-house, commercialization partnerships, as well as the sale of technology or the company itself to a larger company.
The companies’ annual revenues range from $2 million to about $24 million. This includes companies whose share of annual revenue contributed by the SBIR program and other government grants comprise as little as 4 percent and as much as 70 percent.
The ten companies selected for the case studies do not represent a random sample. The companies were selected to provide companies of different ages and size, pursuing different technologies, located in different parts of the country, with differing forms of ownership, and with some, although varying degrees of, commercial success. Some of the companies are university spin-offs; some are company spin-offs; some are neither. Some received many SBIR grants; some relatively few. Some continue to obtain a high percentage of their funding from government sources; others have reduced the percentage to low numbers. To illustrate different types of successful outcomes, six of the cases selected were identified by NSF as “stars.” In addition, all of these cases selected are revenue-earning SBIR-funded companies. The process for selecting the case studies is explained in detail in Appendix D.


