
Capital Punishment in the Post-Gregg Era
The resurgence in the use of the death penalty in the aftermath of Gregg, which followed the de facto moratorium of the 1960s and early 1970s, created the empirical basis for the post-Gregg capital punishment deterrence studies. This chapter provides an empirical summary of the legal status and use of capital punishment during this period.
EXECUTIONS AND DEATH SENTENCES OVER TIME
Figure 2-1 shows executions in the United States from 1930 through 2010. As can be seen, executions were more common prior to World War II than in the postwar era. Executions peaked at 199 in 1935. Following the war, executions steadily declined, from 153 in 1947 to 0 in the late 1960s. From 1967 to the Furman decision in 1972, there were no executions even though they were legally permissible. (The Furman rendered executions legally impossible from 1972 through 1976.) Following the Gregg decision in 1976, the number of executions rose rather steadily to the 1999 peak of 98. It then began falling again: by 2005, the number of executions had nearly halved to 53. Since 2005 the number of executions has remained stable at about 50 per year. From 1976 to 2010, a total of 1,234 people were executed.
Also relevant to the evidence on deterrence is the number of death sentences imposed: Figure 2-2 shows the number of those sentences, as well as the number of executions, for the post-Gregg period. In 1977, the first full year following the Gregg decision, 137 death sentences were imposed. Thereafter, death sentences rose to an annual peak of about 300 in the late
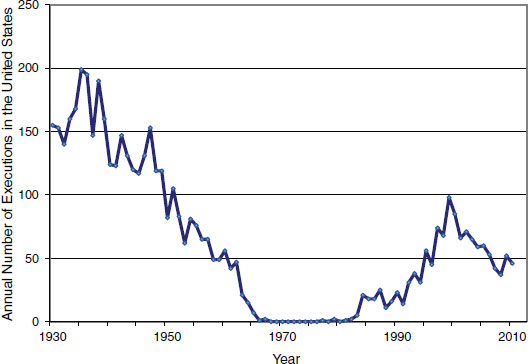
FIGURE 2-1 Annual number of executions in the United States from 1930 to 2010.
SOURCE: Bureau of Justice Statistics (2010, Figure 2).
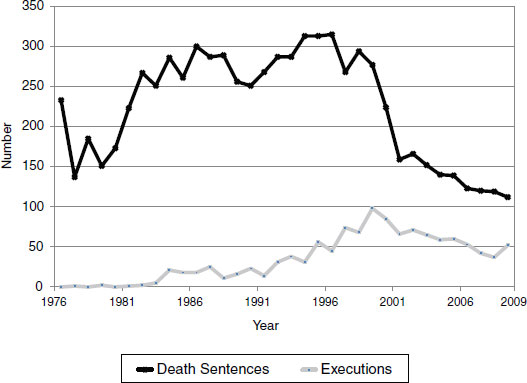
FIGURE 2-2 Annual number of death sentences and executions in the United States from 1976 to 2009.
SOURCE: Bureau of Justice Statistics (2010, Tables 13, 19).
1990s. Since then there has been a steady decline, to 112 in 2009. Figure 2-2 makes clear that far more death sentences are imposed than are carried out.
When a defendant is convicted and sentenced to death, theoretically what follows is an execution. An execution, however, does not follow a death sentence very swiftly or at all for a variety of reasons. The Bureau of Justice Statistics reports that only 15 percent of people sentenced to death between 1973 and 2009 had been executed by the end of 2009. Of these cases, 46 percent ended in alternate ways, including reversed convictions, commuted sentences, or the death of the inmate. Thus, 39 percent of the inmates sentenced to death during the 36-year period were still on death row in December 2009. These inmates, on average, had been under a death sentence for more than 12 years. Because of the smaller number of executions than death sentences every year, the death row population has increased steadily over this period. The number of prisoners facing a death sentence was a little over 400 in 1977 (the first full year after reinstatement); by 2009 it was close to 3,200 (Bureau of Justice Statistics, 2010, Table 18).
These national-level data conceal large differences across states in the use of the death penalty. During the post-Gregg era, the death penalty was not legal in all states, and in some states it was only legal for part of the period. Also, among states authorizing the death penalty, in at least some cases there were very large differences in the extent of the legal authority for capital punishment and the frequency with which that authority was used. Notably, these variations across states and over time in the legal authority to impose the death penalty and the frequency with which that authority was exercised created the empirical basis for the deterrence studies reviewed in this report.
Table 2-1 shows the legal authority for a death sentence by state from 1976 to 2009. A geographically and otherwise diverse group of 10 states never authorized the use of the death penalty during this period: Alaska, Hawaii, Iowa, Maine, Michigan, Minnesota, North Dakota, Vermont, Wisconsin, and West Virginia. Of the other 40 states, 29 provided that authority for the whole period. The remaining 11 states experienced changes in death penalty authority from 1976 to 2009:
• Two states—North Carolina and Wyoming—transitioned in 1977, immediately after the Gregg decision.
• Four states—Kansas, New Hampshire, Oregon, and South Dakota—transitioned from non–death penalty to death penalty status after 1977.
• Two states—New Mexico and Rhode Island—transitioned from death penalty to non–death penalty status after 1977.
TABLE 2-1 Legal Status of Execution in the Post-Gregg Era
| State | Legal Authority for Death Penalty 1976-2009 |
| Alabama | Yes |
| Alaska | No |
| Arizona | Yes |
| Arkansas | Yes |
| California | Yes |
| Colorado | Yes |
| Connecticut | Yes |
| Delaware | Yes |
| Florida | Yes |
| Georgia | Yes |
| Hawaii | No |
| Idaho | Yes |
| Illinois | Yes |
| Indiana | Yes |
| Iowa | No |
| Kansas | No, 1976-1992; Yes, 1993-2009 |
| Kentucky | Yes |
| Louisiana | Yes |
| Maine | No |
| Maryland | Yes |
| Massachusetts | No, 1977-1979; Yes, 1980-1983; No, 1984-2009 |
| Michigan | No |
| Minnesota | No |
| Mississippi | Yes |
| Missouri | Yes |
| Montana | Yes |
| Nebraska | Yes |
| Nevada | Yes |
| New Hampshire | No, 1976-1989; Yes, 1990-2009 |
| New Jersey | No, 1976-1981; Yes, 1982-2005; No, 2006-2009 |
| New Mexico | Yes, 1976-2007; No, 2008-2009 |
| New York | No, 1976-1994; Yes, 1995-2006; No, 2007-2009 |
| North Carolina | No, 1976; Yes, 1977-2009 |
| North Dakota | No |
| Ohio | Yes |
| Oklahoma | Yes |
| Oregon | No, 1976-1977; Yes, 1978-2009 |
| Pennsylvania | Yes |
| Rhode Island | Yes, 1976-1983; No, 1984-2009 |
| South Carolina | Yes |
| State | Legal Authority for Death Penalty 1976-2009 |
| South Dakota | No, 1976-1978; Yes, 1979-2009 |
| Tennessee | Yes |
| Texas | Yes |
| Utah | Yes |
| Vermont | No |
| Virginia | Yes |
| Washington | Yes |
| West Virginia | No |
| Wisconsin | No |
| Wyoming | No, 1976; Yes, 1977-2009 |
SOURCES: Data from Bureau of Justice Statistics (2010), Rogers (2002), and Death Penalty Information Center (2010b).
• Three states—Massachusetts, New Jersey, and New York—transitioned from a non–death penalty to a death penalty status and back to a non–death penalty status over the period.
Thus, from 1976 to 2009 there were 14 transitions in death penalty status among the 50 states. This fact has important implications for estimating the deterrent effect of providing the legal authority for the death penalty independent of the frequency of its use. This issue is discussed at length in Chapter 5.
There is considerable variation among states that authorize the death penalty regarding the types of cases in which death is an allowable punishment. While deterrence studies often focus on homicide rates, there are no states in which the death penalty is available for all intentional homicides. First, not all intentional homicides are murders: many prosecutions that begin as homicide cases are mitigated to the lesser crime of manslaughter, for which capital punishment is never available. Second, even in most states that authorize the death penalty, capital punishment is only available for the relatively narrow category of “first-degree” murders, typically those committed with “premeditation” or those committed during the course of serious felonies. Finally, even those guilty of first-degree murder can only be sentenced to death if the jury finds one or more specified aggravating circumstances. These specified circumstances vary somewhat from state to state, but typically include such factors as the murder of a police officer or witness, murder for hire, murder by a sentenced prisoner, multiple murders or killings that caused a serious risk of death to many people, and
murders that are especially “heinous, atrocious, or cruel,” which is generally interpreted to mean killings that inflicted torture or extreme degrees of physical or psychological pain on the victim beyond that inherent in the act of killing.
The research reviewed in this report is not always clear in its use of such terms as “homicide” and “murder.” Homicide is a generic term meaning the killing of one human being by another (as distinct from suicide or accidental death). Some homicides (e.g., killings in legitimate self-defense or executions pursuant to judicial judgment) are not criminal at all. Criminal homicides are subdivided into various categories of crime (e.g., murder, manslaughter, negligent homicide), depending on whether the person causing death intended to do so or was merely reckless or negligent and on other circumstances surrounding the killing, and these categories are often further subdivided into degrees (e.g., murder in the first degree). Capital punishment is typically only available for the most serious instances of murder.
Most of the studies we reviewed examine the association between capital punishment and the combined number or rate of all types of non-negligent homicides. Unless the specific context dictates otherwise, we use the term “homicide” in describing the findings from the research. When discussing the effect of capital punishment in a broader or more conceptual sense, we use the term “murder,” since the conduct that the death penalty typically aims to deter is unjustified intentional killing, which often (but not always) falls into that legal category.
We recognize that neither of these usages is entirely precise as a reflection of legal categories, but the legal complexity (and diversity across the states) of the legal categories, and the general tendency of the social science literature to ignore these distinctions altogether, leave us with no entirely satisfactory alternative.
As we discuss in Chapter 3, there are no data on the fraction of murders that are eligible for capital punishment, and studies of this issue have reached varying conclusions. One nationwide study (Fagan, Zimring, and Geller, 2006) concluded that about 25 percent of homicides are capital eligible; in contrast, a Missouri study estimated that more than 70 percent of all intentional homicides were at least theoretically capital eligible (Barnes, Sloss, and Thaman, 2009). However, these kinds of studies are inherently problematic. In the absence of an authoritative adjudication, the “facts” of any given homicide can only be gleaned from police reports and other accounts that do not necessarily reliably describe the facts that could be proven sufficiently in a court of law to support a finding of capital eligibility.
Whatever the percentage of homicides that could hypothetically be charged as capital, the percentage that are so charged, even at a very early stage of the criminal process, is much smaller, and the number in which a capital verdict is handed down, or a defendant actually executed, is minute in comparison to the homicide rate. Cook (2009) reports that in North Carolina for the fiscal years 2005 and 2006, 26.5 percent of murder arraignments (N = 1,034) were initially charged as capital offenses, and of those that were capitally prosecuted 4 percent were ultimately sentenced to death.
The Cook study also illustrates that, even if a case is initially treated by prosecutors as capital eligible, it is very unlikely to result in a death sentence. There were many reasons for the precipitous drop-off in capital cases between arraignment and sentencing. A small fraction of cases were dismissed or found not guilty at trial. More commonly, defendants pleaded guilty and received a noncapital sentence in return for the plea. In jury trials, some individuals were found guilty of manslaughter or second-, not first-, degree murder, and among those found guilty of first-degree murder most juries did not recommend the death penalty.
Table 2-2 shows summary statistics on the frequency of executions and death sentences from 1973 to 2009 for the 40 states with active death penalty laws during at least part of the period. We focus on this time period because it is the one used in most panel studies of deterrence. The table shows that executions were very concentrated in a few states. Texas accounted for 37.6 percent of executions from 1973 to 2009; Florida, Texas, and Virginia together accounted for 52.2 percent. This concentration is only partly attributable to more frequent imposition of the death penalty by the courts in those states. Other large states, such as California and Pennsylvania, impose relatively large numbers of death sentences. However, the rate at which death sentences are actually carried out varies greatly across states. The last column in Table 2-2 is the ratio of total executions to total death sentences. In California and Pennsylvania, it is only 1.4 percent and 0.8 percent, respectively, compared with 7.0 percent in Florida, 43.0 percent in Texas, and 70.0 percent in Virginia.
Table 2-2 makes clear that in many states death sentences will either never be carried out or will only be carried out after a very long delay. This fact is important for considering the deterrent effect of the death penalty because the longer the delay the more the death penalty resembles a sentence of life without parole, the next most severe sanction to execution. It also complicates the assessment of what features of a capital punishment regime should be tested for an effect on homicide rates: the legal status of capital punishment as a potential sanction, the rate of capital sentences, the rate of executions, or the time to execution. We return to this point in Chapter 3.
Table 2-3 provides perspective on the frequency of executions and
TABLE 2-2 Number of Death Sentences and Executions by Jurisdiction, 1973-2009
| Death Sentences | Executions | Executions per Death Sentence | |
| Federal | 65 | 3 | 0.0462 |
| Alabama | 412 | 44 | 0.1068 |
| Arizona | 286 | 23 | 0.0804 |
| Arkansas | 110 | 27 | 0.2455 |
| California | 927 | 13 | 0.0140 |
| Colorado | 21 | 1 | 0.0476 |
| Connecticut | 13 | 1 | 0.0769 |
| Delaware | 56 | 14 | 0.2500 |
| Florida | 977 | 68 | 0.0696 |
| Georgia | 320 | 46 | 0.1438 |
| Idaho | 42 | 1 | 0.0238 |
| Illinois | 307 | 12 | 0.0391 |
| Indiana | 100 | 20 | 0.2000 |
| Kansas | 12 | 0 | 0 |
| Kentucky | 81 | 3 | 0.0370 |
| Louisiana | 238 | 27 | 0.1134 |
| Maryland | 53 | 5 | 0.0943 |
| Massachusetts | 4 | 0 | 0 |
| Mississippi | 190 | 10 | 0.0526 |
| Missouri | 182 | 67 | 0.3681 |
| Montana | 15 | 3 | 0.2000 |
| Nebraska | 32 | 3 | 0.0938 |
| Nevada | 147 | 12 | 0.0816 |
| New Hampshire | 1 | 0 | 0 |
| New Jersey | 52 | 0 | 0 |
| New Mexico | 28 | 1 | 0.0357 |
| New York | 10 | 0 | 0 |
| North Carolina | 528 | 43 | 0.0814 |
| Ohio | 401 | 33 | 0.0823 |
| Oklahoma | 350 | 91 | 0.2600 |
| Oregon | 58 | 2 | 0.0345 |
| Pennsylvania | 399 | 3 | 0.0075 |
| Rhode Island | 2 | 0 | 0 |
| South Carolina | 203 | 42 | 0.2069 |
| South Dakota | 5 | 1 | 0.2000 |
| Tennessee | 221 | 6 | 0.0271 |
| Texas | 1,040 | 447 | 0.4298 |
| Utah | 27 | 6 | 0.2222 |
| Virginia | 150 | 105 | 0.7000 |
| Washington | 38 | 4 | 0.1053 |
| Wyoming | 12 | 1 | 0.0833 |
| TOTAL | 8,115 | 1,188 | |
SOURCE: Bureau of Justice Statistics (2010, Table 20).
death sentences relative to the frequency of homicides in the states that provided the authority for capital punishment for all or part of the period from 1990 to 1999, the post-Gregg decade in which the most executions occurred. The final two columns in the table report the ratios of total death sentences and total executions, respectively, to the total homicides for the period. The statistics make clear that relative to total homicides, death sentences are rare and executions ever rarer. Among states with more than 500 homicides, Oklahoma had the highest ratio of death sentences to homicides, 4.9 percent. Those ratios for Texas and Virginia, the two states that most frequently impose the death penalty were 2.1 percent and 1.4 percent, respectively. The ratio of executions to homicides was even smaller. Among states with more than 500 homicides, the rate never exceeds 1 percent except in Virginia.
The data in Table 2-3 highlight two important challenges to inferring the deterrent effect of the death penalty. Because the fraction of murders resulting in a death sentence is small and the fraction that results in executions even smaller, absolute differences in these fractions between the high and low use states are correspondingly small. It is these small absolute differences that typically form the basis for statistical inferences about the deterrent effect of the death penalty in the panel-type studies. The second problem results from the relative infrequency of homicide in small states. Eight states in Table 2-3 averaged fewer than 50 homicides per year for the 1990-1999 period. Overall, in absolute terms, the numbers of death sentences and executions has been very small. It is these rare events that are the basis for trying to determine what would-be murderers calculate to infer the risk of execution.
The infrequency of executions has been interpreted to mean that there is insufficient variation in the data to detect the effect of capital punishment (see, e.g., Donohue and Wolfers, 2005, p. 794). However, the problem is not that a deterrent effect cannot be estimated from the data: as shown in Table 4-1, there is no shortage of statistically significant results that are reported. Rather, the problem is that the inferences drawn from those data on the impact of the death penalty rest heavily on unsupported assumptions. Although many methodological approaches have been used in the research and analyses, the challenge is to identify credible and informative assumptions that can be combined with the data to draw valid inferences on the deterrent effect of capital sanctions. These issues are discussed further in Chapter 4 on panel studies.
TABLE 2-3 Death Sentences, Executions, and Homicides by State: 1990-1999
| Jurisdiction | Death Sentences | Executions | Homicides | Death Sentences per Homicide |
Executions per Homicide |
| Alabamaa | 155 | 12 | 3,608 | 0.0430 | 0.0033 |
| Arizona | 85 | 19 | 3,319 | 0.0256 | 0.0057 |
| Arkansas | 51 | 21 | 2,136 | 0.0239 | 0.0098 |
| California | 334 | 7 | 28,781 | 0.0116 | 0.0002 |
| Colorado | 4 | 1 | 1,741 | 0.0023 | 0.0006 |
| Connecticut | 5 | 0 | 1,448 | 0.0035 | 0 |
| Delaware | 21 | 10 | 260 | 0.0808 | 0.0385 |
| Floridab | 185 | 22 | 5,711 | 0.0324 | 0.0039 |
| Georgia | 88 | 8 | 6,159 | 0.0143 | 0.0013 |
| Idaho | 11 | 1 | 319 | 0.0345 | 0.0031 |
| Illinois | 113 | 12 | 10,775 | 0.0105 | 0.0011 |
| Indiana | 26 | 5 | 3,931 | 0.0066 | 0.0013 |
| Kansasc | 0 | 0 | 304 | 0 | 0 |
| Kentucky | 25 | 2 | 2,134 | 0.0117 | 0.0009 |
| Louisiana | 79 | 6 | 6,409 | 0.0123 | 0.0009 |
| Maryland | 18 | 3 | 5,040 | 0.0036 | 0.0006 |
| Mississippi | 67 | 0 | 2,953 | 0.0227 | 0 |
| Missouri | 83 | 39 | 4,320 | 0.0192 | 0.009 |
| Montanad | 2 | 2 | 162 | 0.0123 | 0.0123 |
| Nebraska | 5 | 3 | 491 | 0.0102 | 0.0061 |
| New Hampshiree | 0 | 0 | 174 | 0 | 0 |
| New Jersey | 20 | 0 | 3,313 | 0.006 | 0 |
| New Mexico | 5 | 0 | 1,450 | 0.0034 | 0 |
| New York | 5 | 0 | 15,227 | 0.0003 | 0 |
| North Carolina | 237 | 11 | 6,123 | 0.0387 | 0.0018 |
| Ohio | 127 | 1 | 5,337 | 0.0238 | 0.0002 |
| Oklahoma | 109 | 19 | 2,226 | 0.049 | 0.0085 |
| Oregon | 32 | 2 | 1,129 | 0.0283 | 0.0018 |
| Pennsylvania | 151 | 3 | 6,410 | 0.0236 | 0.0005 |
| South Carolina | 63 | 21 | 3,007 | 0.021 | 0.007 |
| South Dakota | 4 | 0 | 110 | 0.0364 | 0 |
| Tennessee | 57 | 0 | 4,492 | 0.0127 | 0 |
| Texas | 343 | 162 | 16,120 | 0.0213 | 0.01 |
| Utah | 5 | 3 | 518 | 0.0097 | 0.0058 |
| Virginia | 62 | 63 | 4,562 | 0.0136 | 0.0138 |
| Washington | 18 | 3 | 2,203 | 0.0082 | 0.0014 |
| Wyoming | 1 | 1 | 141 | 0.0071 | 0.0071 |
NOTE: Table includes only states with the legal authority for use of the death penalty for some part of this period.
aAlabama data include only 1990-1998 because homicide rates were not available for 1999.
bFlorida data include only 1990 and 1992-1996 because homicide rates were not available for 1991 and 1997-1999.
cKansas data include only 1991-1992 because homicide rates were not available for 1993-1999.
dMontana data include only 1991, 1992, and 1995 because homicide rates were not available for 1993 and 1994.
eNew Hampshire data include only 1990-1996 and 1998-1999 because homicide rates were not available for 1997.
SOURCES: Data on executions from Espy and Smykla (2004), data on death sentences from Death Penalty Information Center (2010a), data on homicides from Bureau of Justice Statistics (2009).
Barnes, K., Sloss, D., and Thaman, S. (2009). Place matters (most): An empirical study of prosecutorial decision-making in death-eligible cases. Arizona Law Review, 51(2), 305-379.
Bureau of Justice Statistics. (2009). Homicide—State Level Trends in One Variable. Available: http://bjs.ojp.usdoj.gov/dataonline/Search/Homicide/State/TrendsinOneVar.cfm [January 2011].
Bureau of Justice Statistics. (2010). Capital Punishment, 2009—Statistical Tables. U.S. Department of Justice. Available: http://bjs.ojp.usdoj.gov/index.cfm?ty=pbdetail&iid=2215 [December 2011].
Cook, P.J. (2009). Potential savings from abolition of the death penalty in North Carolina. American Law and Economics Review, 11(2), 498-529.
Death Penalty Information Center. (2010a). Death Sentences in the United States from 1977 by State and by Year. Available: http://www.deathpenaltyinfo.org/death-sentences-united-states-1977-2008 [September 2011].
Death Penalty Information Center. (2010b). State by State Database. Available: http://www.deathpenaltyinfo.org/state_by_state [January 2011].
Donohue, J.J., and Wolfers, J. (2005). Uses and abuses of empirical evidence in the death penalty debate. Stanford Law Review, 58(3), 791-845.
Espy, M.W., and Smykla, J.O. (2004). Executions in the United States, 1608-2002: The Espy File. Available: http://www.deathpenaltyinfo.org/executions-us-1608-2002-espy-file [December 2011].
Fagan, J., Zimring, F.E., and Geller, A. (2006). Capital punishment and capital murder: Market share and the deterrent effects of the death penalty. Texas Law Review, 84(7), 1803-1867.
Rogers, A. (2002). “Success-at long last”: The abolition of the death penalty in Massachusetts, 1928-1984. Boston College Third World Law Journal, 22(2), 281-354.


