
G
Economics of Coproduct Production from Large-Scale Algal Biofuels Systems
Coproducing algal biofuels and high-value products has been suggested as a strategy to address the challenge of making algal biofuels economically viable. The strategy has proven to be contentious at several levels. Coproducts are strongly linked to the economics and life-cycle assessments (LCAs) of algal biofuel production. The economics of algal biofuel production are outside the scope of this analysis, but are a key reason for the importance of coproducts. Coproducts are proposed as a means to improve the economics of algal biofuel production. Economic benefit comes at a cost, however, and a simple analysis is presented to explain the impacts and potential concerns.
Markets tend to correlate scale and price of sale, which is the cost of production plus return on capital (Figure G-1). This is frequently overlooked as coproducts are touted as a significant source of additional revenues for an economically suspect fuel production process. The correlation is somewhat poor across different products, but for a single product, scale and price are related by a power law. This means that doubling scale reduces price more than double. The value of coproduct is unlikely to drop indefinitely with increase in scale and could have an asymptotic function. For materials intended to sell into the massive fuels market, coproduct volumes swell rapidly with the scaling of fuel production unless a wide variety of coproducts for different markets are produced.
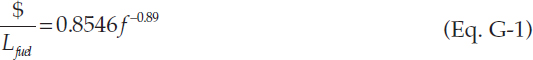
The Davis et al. (2011) work resulted in the development of a model for the economics of algal biofuel production.1 This model allows scenarios around coproduct value to be explored. In particular, setting up the functional form to estimate the cost for sale of biodiesel as a function of coproduct fraction was completed. Figure G-2 shows the expected power law form (Eq. G-1).
_______________
1 Aden, Andy; personal communication. National Renewable Energy Laboratory (NREL) model provided September 2011.
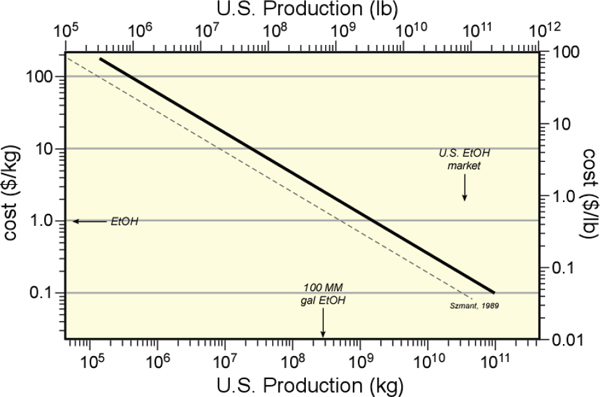
FIGURE G-1 Chart showing the general power law dependence of a materials cost with production scale.
NOTES: As scale increases, price generally decreases. This is true both for fuel components and coproducts. The dotted line shows Szmant’s original curve and the solid line is inflation corrected to 2010.
Adapted from Szmant (1989). Reprinted with permission from Elsevier
Coproduct production is also a function of the lipid fraction (Eq. G-2):
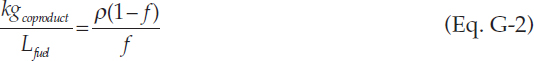
where ρ is the density of the lipid fuel and ƒ is the lipid fraction, by weight, on a dry basis.
Extraction of the residual biomass has two major costs: one from electrical power and where one from nutrient loss. Biogas is commonly quoted as having a heating value of 650 BTU per cubic foot (DOE-EERE, 2011) or approximately 20 megajoule per kilogram. Electrical energy production is assumed to be 33 percent efficient (Davis et al., 2011) and 85 percent of the potential is captured. This means that the energy potential in the residual biomass from anaerobic digestion may be approximated as (Eq. G-3):

where α is the efficiency of electricity generation from biomass and β is a loss term, entered as 0.85. This is a coarse approximation and neglects the effect of excess power generation for sale. It assumes that all the power produced by the anaerobic digester system needs to
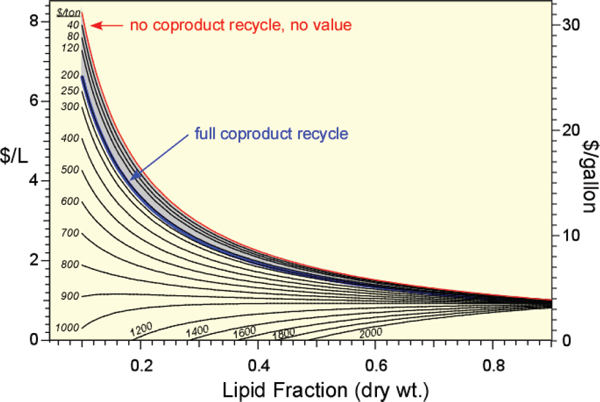
FIGURE G-2 Lipid fraction in the microalgae figures prominently in the amount of coproduct, and, therefore, the total value of the coproduct stream.
NOTES: Fuel costs are estimated using data from (Davis et al., 2011) as a function of the per pound sales price of the coproduct and the lipid fraction. The coproduct is assumed to be the total remaining biomass and the alternative value of the nutrients, and power lost through its sale is accounted for. Coproduct sales price is in dollars per tonne. Curves with a positive slope indicate that the coproduct is providing more of the total value than the fuel component. Negative slopes indicate that fuel is still the most valuable component. Potentially difficult to see, the $200/ton line falls on top of the blue line representing the base case with all nutrients and power production.
be replaced with purchased power and all residual biomass is sold as coproduct. The approximation intends to show trends.
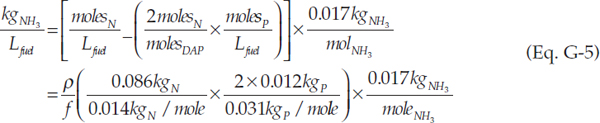
The nutrient requirements can be estimated based on the Redfield molar ratio for algae of 106C:16N:1P (Redfield, 1958). Fertilizer is assumed to be ammonia and diammonium phosphate (DAP). Assuming that all nitrogen (N) and phosphorus (P) remain in the residual biomass, the nitrogen content is approximately 8.6 percent by weight and the phosphorus 1.2 percent, in good agreement with estimates in detailed studies of algal fuel production (Davis et al., 2011). Therefore, the amount of diammonium phosphate (DAP) equivalent in the residual biomass can be approximated as (Eq. G-4):

The nitrogen present in DAP has to be accounted for, yielding an approximate amount of ammonia equivalent in the residual biomass of (Eq. G-5):
What is left is a simplified approximation of the impact of coproduct sales on the price for sale of an algal biofuel. The power law relationship between the lipid fraction and the price of fuel is used as the starting economic estimate. Coproduct value reduces the price of the fuel, showing the benefit of coproduct sales. Power would have to be purchased to account for the loss of power from the anaerobic digestion, raising the price of the fuel. Fertilizers would have to be purchased to account for the loss of nutrients that are no longer being recycled to the algae cultivation.
Ammonia and DAP prices are nearly equivalent and are assumed to be identical at $450/tonne. Power prices are selected to match published studies at $0.081 per kilowatt hour (Davis et al., 2011).
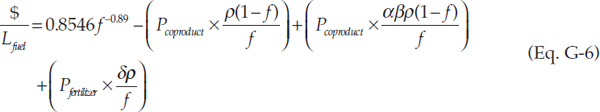
where δ is 0.146 and is the collection of terms from both the nitrogen and phosphorus requirements (Eq. G-6).
Calculations can then be done to estimate the impact of coproduct sales as deviation from the economics of the reference pathway presented earlier, represented by the blue line in Figure G-2. Discontinuation of the recycle of nutrients from the algal biomass remaining after lipid extraction and elimination of power generation, as would be the case if this was put to other use without returning a revenue stream, requires that additional power and nutrients be purchased, effectively raising the price for sale of the algal biofuel. This is shown as the red line in Figure G-2 and represents an unrealistic, but instructive, case where the value in the residual biomass is not captured. The grey areas between the red and blue lines illustrate that the approximate value of the biomass is $200 per tonne. One commonly suggested outlet for the residual biomass is as animal feedstuff. This would place its value in the $400-500 per tonne range as a bulk feedstuff. At 30 percent lipid fraction, the impact on fuel price is on the order of $0.40 per liter. If algal species begin to express lipids at higher levels, the benefit of the coproduct sales diminishes on a per liter basis because of the reduction in production of the non-lipid biomass.
At points where the coproduct has a value below that of fuel, the shape of the price curve largely follows the curve for no coproduct sales. However, when the coproduct value exceeds the value of fuel, there can be a dramatic drop in fuel price. The interplay of scale and reasonable price of sale, to first approximation, limit the price that the coproducts can reasonably garner. Coproducts certainly can improve the economics of fuel production only modestly because reasonable values for large-volume applications such as animal feedstuffs have established prices that are near the alternative values for the residual biomass
as a nutrient and power source. Clearly, high-value products are made using algae today with success. These products are small-volume applications where the value of the product, for example nutraceuticals, can be thousands or tens of thousands of dollars per tonne. Any fuel produced in addition to the high-value product could, indeed, be sold into the fuels market profitably. The available fuel is limited to the market accessible to the high-value product. Once the market for the high-value product is saturated, the economic benefit for fuel production decreases substantially. Coproduction of fuel and other products has limited potential and is not a solution to improving economics of widespread and large-scale deployment of algal biofuels.
REFERENCES
Davis, R., A. Aden, and P.T. Pienkos. 2011. Techno-economic analysis of autotrophic microalgae for fuel production. Applied Energy 88(10):3524-3531.
DOE-EERE. (U.S. Department of Energy, Energy Efficiency and Renewable Energy). 2011. Anaerobic digestion. Available online at http://www.eere.energy.gov/basics/renewable_energy/anaerobic_digestion.html. Accessed June 8, 2012.
Redfield, A.C. 1958. The biological control of chemical factors in the environment. American Scientist 46:205-221.
Szmant, H.H. 1989. Organic building blocks of the chemical industry. New York: Wiley.
This page intentionally left blank.


