
8
International Migration
Sharon Stanton Russell
INTRODUCTION
As of the late 1980s, international migrants of all types worldwide were estimated to number in the range of 80 million people, of whom approximately 35 million were in sub-Saharan Africa (Widgren, 1987; Ricca, 1989; United Nations, 1989b; Russell et al., 1990). If these figures are even nearly correct, then almost half of the world’s migrants were in sub-Saharan Africa, although the region itself contained less than 10 percent of the world’s population.
Of these 35 million sub-Saharan African migrants, approximately 5.4 million were officially recognized refugees; possibly an equal number were internally and externally displaced—in refugee-like circumstances but not officially recognized as refugees. In this study, migrants are defined as persons who have crossed international boundaries, regardless of their reasons for movement or length of stay abroad (both of which are difficult to discern from available data). International migrants include those seeking employment; family members accompanying or joining those who have migrated before them; people seeking refuge from drought, famine, political upheavals, or military conflicts (whether designated as official refugees or
Sharon Stanton Russell is a research scholar at the the Center for International Studies, Massachusetts Institute of Technology.
not); as well as pilgrims, temporary visitors, workers posted outside their countries of origin, and children migrating for school. The definition of official refugee differs slightly by designating institution. The 1951 United Nations Convention Relating to the Status of Refugees defines a refugee in part as a person who, “owing to a well-founded fear of being persecuted for reasons of race, religion, nationality…[etc.] is outside the country of his nationality, and is unable or…unwilling to avail himself of the protection of that country….” The Organization for African Unity Convention of 1969 expands this definition by adding the following: “The term refugee shall also apply to every person who, owing to external aggression, occupation, foreign domination or events seriously disturbing the public order… is compelled to leave…to seek refuge in another place” (United Nations High Commissioner for Refugees, 1979).
The purpose of this chapter is to provide an overview of international migration streams in sub-Saharan Africa: their scale, directions, and links to economic factors, and their effects on the size, structure, and composition of the region’s populations. Demographic analysis is often complicated by international migration, especially in sub-Saharan Africa, where international population movements have been volatile and frequently unpredictable, as much for political as for economic reasons. Census data, which at best are slow to be published, are rapidly rendered outdated by migrations associated with sudden economic reversals (e.g., changes in oil or commodity prices) or political events. Despite the difficulties of studying the phenomenon, international migration can have striking consequences for the demographic profiles of both sending and the receiving areas, and the subject warrants attention in any comprehensive review of population dynamics.
DATA SOURCES
Statistical data on international migration in sub-Saharan Africa are of limited availability and often poor quality. Data on migration flows among countries are virtually nonexistent. To estimate the stocks of migrants in the region, their proportions in total population, and their age and sex composition, this chapter has drawn upon files compiled from country censuses reported to the United Nations Population Division, Trends and Structure Section. These data are from the 1970 and 1980 census rounds; results from the few countries that have conducted censuses in the 1990 round are not officially available, although preliminary results from Lesotho (not yet reported to the United Nations) are considered in the analysis below. Data on stocks of refugees in the region (and their changes in recent years) are derived from the World Refugee Survey, published annually by the U.S. Committee for Refugees. Data from both census and refugee survey sources
were cross-tabulated by country of origin and destination during preparation of International Migration in Sub-Saharan Africa, published by the World Bank (Russell et al., 1990), and have been updated for this chapter (see Tables 8–1 through 8–141 for regional and country-level data on migration and refugee flows). When relevant, the analysis below also makes use of country-specific survey and detailed census results as well as findings from the extensive literature review conducted for the World Bank study.
Census data often do not allow clear distinctions to be drawn among types of migrants. Specifically, census results seldom indicate whether official refugees were included or excluded. For these and reasons cited above, the population estimates presented here must be considered approximations. Furthermore, some censuses report foreign nationality rather than foreign birth (see Tables 8–1 and 8–15). Generally, place of birth is a better datum than nationality for inferring migration, since nationality may or may not change as migrants settle and may or may not apply to the second generation. Even place of birth has its limitations, however: It reflects lifetime movement (without temporal reference) and does not give any information about multiple, staged, or circular migrations. In this chapter, the term “migrant” is used in reference to nonnationals identified by either or both classifications. The term “refugee” is reserved for those officially recognized as such by the United Nations or Organization of African Unity definitions.
REGIONAL PATTERNS
Despite the data limitations, important regional and subregional2 patterns can be discerned. These patterns can be seen in the map on migration and in Tables 8–1 through 8–8. First, the vast majority (approximately 90 percent) of sub-Saharan African migrants are Africans. Non-African migrants include long-time residents originating from Lebanon, Syria, India, and Pakistan, as well as Europeans and some from the Western Hemisphere. The proportions of foreign born in total populations vary considerably, with the highest being in western Africa.
Second, labor migration has been a feature of all subregions, but especially notable in western Africa, and from the nations of southern Africa to the Republic of South Africa. Third, refugee migrations, on the other hand,
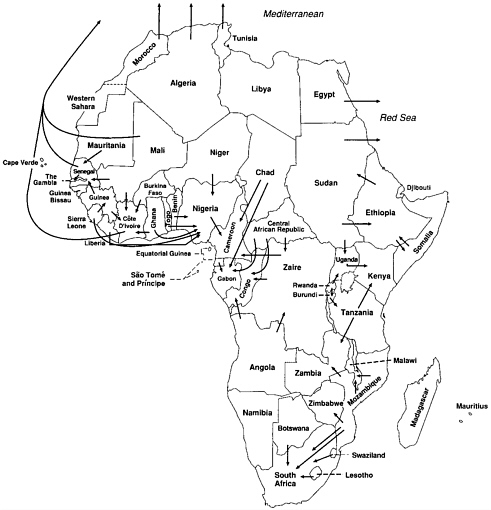
International migration in sub-Saharan Africa. SOURCE: Based on Ricca (1989).
have been predominant in eastern Africa. Fourth, clandestine migration is pervasive throughout the region and considered “routine” in western Africa, where seasonal migration also figures more prominently than elsewhere on the continent.
Western Africa
The highest concentration of migrants is found in western Africa, a subregion that migrants have always considered as an economic unit where trade in goods and services flowed freely, as did people. Precolonial migrations were often group movements related to internecine warfare, slave
raids, famine, drought, and the spread of religions—as well as trade. During the colonial period, the French pursued forced labor recruitment policies, while the British adopted agricultural production policies that attracted farm labor. The development of plantation agriculture helped to bring about a shift during this period from group migration to individual movement, differentiated by age, occupation, and sex.
In the postcolonial period, migration in western Africa has become largely spontaneous and includes levels of both seasonal and undocumented migration reportedly higher than elsewhere in sub-Saharan Africa. The levels and directions of migration in the region are notably volatile. Until the early 1970s, Ghana was the favored destination of western African migrants, and as of the 1960 census, migrants numbered more than 800,000 and made up 12 percent of Ghana’s total population. By 1970, migrants numbered only 562,000 and comprised only 6.6 percent of total population (see Table 8–1).
Over the past two decades, Côte d’Ivoire has supplanted Ghana as a major pole of attraction for migrants from Burkina Faso, Mali, Guinea, Ghana, Niger, and elsewhere (see Table 8–2). Foreigners, who were 22 percent of the total population as of the 1975 census, are now reported to be nearly 30 percent, giving Côte d’Ivoire by far the highest concentration of foreigners in sub-Saharan Africa (see Table 8–1). The second highest concentration is in The Gambia, where migrants are about 11 percent of the total population and include significant numbers from Senegal, Guinea, Guinea-Bissau, and Mali (see Table 8–2).
Census data from Nigeria are not available, but it is well known that flows to that country increased substantially during the 1970s and early 1980s, as the combined result of Nigeria’s oil boom and the protocol on freedom of movement signed in 1980 by members of the Economic Community of West African States (ECOWAS). The majority of migrants were from Ghana, Togo, Benin, Niger, and Chad. By 1982, there were estimated to be 2 to 2.5 million nonnationals in Nigeria, roughly 2.5 percent of total population. However, a 1983 survey of migrants in Nigeria found that only 23.3 percent of them were legal, so their numbers and proportions may have been even higher (Makinwa-Adebusoye, 1987; Adepoju, 1988; Orubuloye, 1988). Economic and political adversities since the early 1980s have dramatically changed international migration to Nigeria. Between 1983 and 1985, some 1.5 million nonnationals were expelled by government order (Afolayan, 1988:21–23). By the late 1980s, Nigeria had become an exporter of professionally and technically trained personnel.
According to the 1976 census, there were close to 119,000 migrants in Senegal (see Table 8–1); however, other estimates (Zachariah and Condé, 1981) put the number at that time in the range of 355,000 (with Guinea being the largest source country), and it is this latter figure that has led to
the characterization of Senegal as having become a significant country of immigration. By taking the lower figure, migrants amount to nearly 2.4 percent of the total population; the higher figure is closer to 7 percent of the total population.
There is little quantitative evidence on the composition of migrants in western Africa. They are generally thought to be primarily young; male; illiterate or at least less well educated than the host country populations; and concentrated in low-status, temporary jobs, especially those in agriculture, mining, commerce, and services. On the other hand, they are also reported to have high levels of employment.
There are some exceptions to this characterization, however. Ghanians in Nigeria included large numbers of school teachers, professionals, and technicians; the 1983 survey of migrants found that nearly 53 percent had secondary, technical, or tertiary education. About 25 percent of those surveyed were in skilled occupations and another 14 percent in semiskilled activities. Only 37 percent were in unskilled jobs (Makinwa-Adebusoye, 1987:24; Adepoju 1988:68).
It has also been observed that more recent flows in western Africa (especially to Côte d’Ivoire) have included more women and children (Makinwa-Adebusoye, 1987), which may indicate a shift toward family migration or reflect movement of dependents for family reunification. Of the eleven western African countries for which data are available on the sex ratio of the foreign born, five have ratios very close to 1.00 (Table 8–15). Further, future censuses may confirm observations (see Russell et al., 1990) that implementation of the ECOWAS regional protocols on free circulation during the 1980s, along with rising levels of education, have led to more migration of skilled workers in western Africa.
There is also evidence of medium- to long-term migration, especially from Mali and Burkina Faso. Guineans are also noted to have longer average residence outside than other migrants (Adepoju, 1988). Although the majority (59 percent) of sub-Saharan African migrants over age 20 enumerated in Mauritania’s 1977 census had been in the country less than five years, nearly 25 percent had been resident 10 years or more. For Sierra Leone as of 1974, 20 percent of all foreign nationals had been resident 10 years or more and another 19 percent had been born there.
The future of migration to Côte d’Ivoire is somewhat uncertain at present. Given historical trends and the continuing relative economic deprivation of neighboring source countries, there may be little significant reduction in flows. On the other hand, both economic and political conditions in Côte d’Ivoire are worsening, and there are reportedly high levels of unemployment among educated Ivoirians and a less welcoming response to migrants. Although the occupational concentrations of migrants and nationals are different, such circumstances have been known to result in nationals taking jobs they previously considered beneath their qualifications.
In the past several years, refugee flows have come to figure more prominently than heretofore in western Africa. In 1988, Guinea-Bissau and Ghana were the only countries in the subregion producing refugees; numbering only 5,500, these constituted less than 1 percent of all sub-Saharan African refugees. Similarly, the subregion’s nine asylum countries hosted only 15,200 refugees (primarily from Chad in middle Africa) also less than 1 percent of the total (Russell et al., 1990). By 1990—only 2 years later—13 western African nations were providing asylum to more than 800,000 people (nearly 16 percent of all sub-Saharan African refugees) primarily from other western African countries, notably Liberia (nearly 730,000) and Mauritania (more than 60,000) (see Tables 8–9 and 8–10).
Middle Africa
Historical patterns of international migration in middle Africa were linked to religious factors, tribal expansion, the slave trade, migrations of nomads and pygmies, and movement across “artificial,” colonial political boundaries by members of socioeconomic units thus divided.
Although migration in the subregion is often characterized as largely male and temporary, analysis of sex ratio data for various middle African countries suggests that types of migration vary considerably by nationality and country of destination. Migrants from Zaire in Cameroon had the highest sex ratio (number of males per female) of any foreign group enumerated in the Cameroon (1976) census (2.59), implying temporary migration largely by males. Zairois in the Congo as of 1984, on the other hand, had a sex ratio of 0.88, reflecting the existence of female migration, whereas Senegalese in the Congo had a sex ratio of 3.0.
Among the middle African countries for which census data are available, the largest migrant stocks (more than 600,000) are enumerated in Zaire (see Table 8–1), where mineral deposits and infusions of investment capital have created jobs for skilled and unskilled workers, and the foreign born represent slightly more than 2 percent of the total population. The second major country of destination is Cameroon, where nearly 220,000 migrants constituted about 3 percent of total population in the 1976 census. The great majority were palm plantation workers from Nigeria and, to a lesser extent, from Chad and the Central African Republic (CAR) (see Tables 8–3 and 8–6, note a).
The Congo has the highest proportion of migrants in middle Africa (more than 5 percent), mainly from Zaire, CAR, Angola, Mali, Senegal, and Cameroon (see Tables 8–1, 8–3, and 8–6, note a). Nearly three-quarters of the migrants to the Congo enumerated in 1984 had arrived within the preceding 10 years, and more than half had come within the preceding three years. At the other extreme, as may be seen in Table 8–1, the foreign born in Angola were less than 1 percent of the total population in 1983.
The total number of refugees from middle Africa increased slightly, from 490,000 in 1988 to 521,900 in 1990, but (because of even greater increases in other subregions) their proportion among all sub-Saharan African refugees declined from 12.5 to barely 10 percent. The absolute increase in middle African refugees resulted from greater numbers fleeing into Zaire, Zambia, and Namibia (see Tables 8–11 and 8–14) from drought-induced famine and continued hostilities in Angola, by far the major source country in the subregion, with about 436,000 refugees (see Table 8–16). The number of refugees from Zaire and Chad decreased slightly, despite a new outflow from Chad in 1989 associated with the overthrow of the government. Previously, during the late 1980s, many of the earlier Chadian refugees had been repatriated.
Eastern Africa
Eastern Africa is the principal geographical focus of African refugee movements, and these refugee flows dominate other types of migration in this subregion. As may be seen in Table 8–16, of the seven countries that generate more than 90 percent of the continent’s refugees, four are in eastern Africa and one is neighboring Sudan; of the thirteen countries that receive more than 90 percent of the refugees (see Table 8–17), seven are in eastern Africa and one is again Sudan. Of these major source and asylum countries, three (Ethiopia, Sudan, and Somalia) are in both categories.
However, as of 1987, it was no longer accurate to characterize refugee movements as confined to the Horn.3 The number of refugees originating from Mozambique increased dramatically (nearly 163 percent) between 1986 and 1987, and by 1990 Mozambique had surpassed Ethiopia as sub-Saharan Africa’s major source country, accounting for 27 percent of the region’s refugees. The countries of eastern Africa most affected by the Mozambican exodus—Malawi, Tanzania, Zambia, and Zimbabwe—were among the top 12 asylum countries, together receiving nearly 29 percent of Africa’s refugees (Tables 8–12 and 8–17).
The predominance of refugees in eastern Africa does not mean, however, that other types of international migration are not found. Historically, migration in the subregion was affected by precolonial inflows of Arabs and Asians; the partition of the area into colonies; the development of export-oriented agriculture as well as mining and extractive industries; and restric-
tions on free population movements both following independence and, from time to time, as the result of interstate conflicts.
Since before independence, populations moved from Rwanda, Burundi, and Zaire to Uganda, Kenya, and elsewhere in eastern Africa, as contract labor replaced old East-West slave routes. There have also been labor flows from Malawi and Mozambique to South Africa, Zimbabwe, and Zambia (Adepoju, 1988:34,35). In the past, Tanzania received sizable inflows from other sub-Saharan African countries. Some were refugees or people in refugee-like circumstances, but Tanzania has been both a labor-sending and a labor-receiving country, with explicit policies to govern such movements. However, in the face of deteriorating economic conditions in the 1970s, the proportion of migrants in Tanzania’s total population declined from 3.7 percent in 1968 to 2.4 percent in 1978.
Kenya has not been a major country of in-migration, and only 1 percent of its total population in 1979 was composed of migrants, largely from Tanzania, Uganda, Ethiopia, and Somalia. However, until recently, Kenya was a major receiver of educated Ugandans. During the 1980s, the increasing availability of skilled Kenyan graduates placed pressures on the Kenyan labor market, and as a result, skilled Ugandans moved to other locations within and outside Africa, including South Africa.
In addition to both hosting and producing refugees, Sudan has been an exporter of migrants to the oil-producing countries of the Middle East and elsewhere. An estimated 334,000 Sudanese were abroad as of 1983 (Choucri, 1985:5), and by 1985, some 500,000—including two-thirds of the country’s technical and professional workers—lived abroad (United Nations Economic Commission for Africa (ECA), 1988:1). Some of the resulting manpower shortage in Sudan was attenuated by skilled Ethiopian refugees, who replaced trained Sudanese migrants to the Gulf (Adepoju, 1990:7). Although the oil price downturn in the 1980s prompted concerns about large-scale return migration, as of the late 1980s there was no evidence this had occurred. The full consequences of Sudan’s support for Iraq in the 1990–1991 Gulf War have yet to be determined, however.
Southern Africa
Migration in southern Africa has generally been characterized as temporary and oscillatory, historically and in the present shaped by migration to the Republic of South Africa (RSA), principally from Botswana, Lesotho, and Swaziland (BLS) but also from Mozambique, Malawi, and Zimbabwe. In addition to migration of mine workers (organized through labor recruiters), there was—until 1963—a considerable amount of clandestine migration, which included accompanying women and children. In 1963, South Africa imposed strict immigration controls that curtailed both undocumented
migration and family migration, and further prohibited BLS migration to South Africa except for work in mines and agriculture.
Changes in the national composition of migrant mine workers in South Africa began to appear in the mid-1970s. Several sending countries imposed their own restrictions on migration to RSA. Tanzania and Zambia enacted such restrictions shortly after independence, and Malawi withdrew its labor in 1974, although it reduced those strictures in 1978. As a result of these measures and a secular decline in mine migrants from Mozambique, there has been a shift toward increasing proportions from Lesotho (United Nations, 1989b).
A number of factors have combined to bring about these and other recent changes in southern African migration to South Africa (De Vletter 1988:5). First, after increases in the price of gold, the withdrawal of Malawian labor, and worsening relations with Mozambique, South Africa sought to stabilize the migrant work force and to attract more mine labor from within the country, with substantially increased wages and longer work contracts. Second, legislative changes have accompanied a policy shift toward “careers in mining.” Mine companies are now permitted to construct housing for married workers, and black workers are permitted to occupy senior positions formerly reserved for whites.
Third, in response to periodic bans on migration by supplier countries, South Africa has sought to reduce its dependence on foreign labor and has used either threatened or actual expulsions as a disincentive to further political actions by remaining suppliers. Finally, with rising levels of education both in labor-supplying countries and within South Africa itself, the benefits of an educated work force have become more evident, and policies have emphasized establishment of a permanent, skilled labor force from domestic sources.
From Chamber of Mines of South Africa data, it is possible to discern some of the consequences of these factors. Although total employment in the mines increased and a growing proportion of official migrants have been concentrated in mining, the proportion of workers from foreign countries decreased from 78 percent in 1974 to about 40 percent in 1984–1986 (Financial Mail, 1987:33; United Nations, 1989b: Table 65).
The full impact of these changes on the labor-supplying countries of southern Africa is not yet clear. However, it has been noted that the supply of mine labor now far exceeds demand throughout southern Africa (De Vletter, 1985), and the International Labour Organization (ILO) has mounted a series of studies (under the “Assistance to Migrant Workers in Southern Africa Project”) to inform planning in countries of the subregion bracing for effects of expected further declines in migration to South Africa. In Botswana alone, the number of mine labor recruits dropped from 40,390 in 1976 to 19,648 in 1986, and the proportion of novices (first-time workers)
among all recruits dropped from 25 percent in 1976 to 1.6 percent in 1985 (Taylor, 1990).
Some will find new destinations outside their countries of origin. Migrants from Lesotho are already known to have begun taking work in “homeland” areas (which South Africa considers to be independent nations), and anecdotal reports suggest that other national groups (including Ghanians, and Ugandans formerly resident in Kenya) have begun doing so as well. Although official policies of source countries discourage this trend,4 it may well continue as opportunities in South Africa decline further.
In the past, international migration among southern African nations has been overshadowed by the dominant flows to South Africa, but this too may change in future. In Swaziland, migrants already comprised more than 5 percent of the total population by the 1976 census, with most from South Africa and Mozambique. In Botswana, migrants were only 1.7 percent of the total population in 1981, but the range of source countries suggests the potential patterns of future migration: Migrants come from South Africa, Zimbabwe, Namibia, Lesotho, Angola, Malawi, Swaziland, and—in smaller numbers—from Nigeria and Ghana.
Generally in southern Africa, the female labor force is growing faster than the male labor force (3.0 versus 2.6 percent per year), and there is evidence of growing international migration for employment among women, linked to rising levels of female education, the elimination of legal restrictions on female migration, and changing norms in rural areas. The extent to which changing demand factors may have contributed to increasing female migration is not documented. In a 1978 survey of migrants in Lesotho, 23 percent of respondents who had worked in South Africa were women (Wilkinson in Momsen and Townsend, 1987), a finding roughly consistent with results of both the 1976 and the 1986 Lesotho censuses, in which females were about 18 percent of nationals absent at the time of enumeration. There is also evidence of primary female migration from Zambia and Tanzania and in western Africa (Russell et al., 1990).
The proportion of all sub-Saharan African refugees hosted by southern African countries has declined slightly, from 6.6 percent in 1988 to 5.3 percent in 1990 (see Table 8–9), largely as a result of the repatriation of Namibians prior to that country’s attainment of independence from South Africa in March 1990. Southern Africa produces less than 1 percent of all sub-Saharan African refugees. South Africa, with less than 4 percent of all
sub-Saharan African refugees (see Table 8–17), remains the major asylum country in the region, hosting an estimated 201,000—nearly all from Mozambique (see Tables 8–13 and 8–14, note g). However, South Africa itself is also the subregion’s largest source of refugees, although their numbers declined from 24,900 in 1988 to 20,000 in 1990, as some returned from Angola and Swaziland. (See Tables 8–13, 8–14, and 8–16.)
MIGRATION OF THE HIGHLY SKILLED AND EMIGRATION FROM THE CONTINENT
In view of the importance to development in Africa of trained manpower, concern has been expressed about migration of the highly skilled. However, attitudes toward such movements have shifted over time, and have depended on the composition and destinations of skilled migrants. Emigration of trained Africans to developed countries of Western Europe and North America (the principal destinations until the late 1970s) has generally been characterized as “brain drain,” a term implying exploitation of poor countries by rich ones.5 However, skilled migration to other developing countries, which has emerged since the late 1970s, is more often described in international forums as “reverse technology transfer” or “cooperative exchange of skills between developing countries.”
There is only fragmentary evidence as to the numbers of highly skilled Africans who have left the continent. As of 1987, the United Nations Conference on Trade and Development estimated that about 70,000 (30 percent of the high-level manpower stock6 within the continent) officially resided in European Community (EC) countries (United Nations Economic Commission for Africa, 1988); this figure is undoubtedly an underestimate, however: more than 110,000 skilled Nigerians alone took jobs abroad between 1987 and 1989 (Adegbola, 1990).
Since the mid-1970s, there has been increasing migration of highly skilled Africans to destinations within Africa, although their aggregate numbers
remain to be estimated. Gould (1985) has identified three principal reasons for this trend: (1) The opportunities for migration to developed countries declined, and (with the exception of selected source countries7) there has been relatively little African migration to the Middle East. (2) There has been increased economic differentiation among African countries. (3) Educational output has expanded faster than the economies of many countries, leading to disparities between the supply of and demand for skilled workers and to the out-migration of those unable to find work at home.
Although migration of the highly skilled (to any destination) does not necessarily have negative effects on source countries, it can do so if the scale is large and critical sectors of the economy are affected. Skills short-ages have been reported in Ethiopia, as the result of insufficient output from higher education and the exodus of trained workers at the time of the revolution, and they are likely to have occurred in Somalia. Uganda lost more than half its high-level manpower during the regime of President Amin. Following the decline of oil revenues and the adoption of a structural adjustment program in the mid-1980s, Nigeria experienced significant emigration of skilled personnel, affecting particularly medicine, universities, and airlines. Similarly, as the result of economic crisis, poor working conditions, and more attractive salaries elsewhere, Zambia has lost a substantial number of university lecturers and public sector physicians, mainly to other countries of southern Africa.
In recent years, sub-Saharan Africans have become increasingly visible among growing numbers of official and undocumented migrants to Europe and among asylum seekers in member states of the Organisation for Economic Co-operation and Development (OECD). Although even aggregate data are virtually nonexistent8 and skill composition is unknown, selected evidence confirms their presence. Of registered non-European foreign residents in Italy in 1990, nearly 12 percent (75,152) were from sub-Saharan Africa (SOPEMI, 1991:22, Tables 8,9). The share of sub-Saharan Africans among Italy’s estimated 1.2 million illegal migrants in 1990 was also thought to be high. Growing numbers of migrants from all over the world are seeking to gain entrance to Europe, North America, and Australia by means of the asylum process, and those from sub-Saharan Africa are no exception.
The number of asylum seekers from the six principal sub-Saharan African source countries9 rose from 23,500 in 1988 to 62,450 in 1991. In 1991, sub-Saharan African countries (notably Somalia, Ethiopia, and Zaire) ranked among the top four or five sources of asylum seekers in nine out of sixteen reporting countries (Inter-governmental Consultations on Asylum, Refugee and Migration Policies in Europe, North America and Australia, personal communication, 1992).
EFFECTS OF INTERNATIONAL MIGRATION ON AGE AND SEX DISTRIBUTIONS
Data on the age and sex distributions of resident, absent, and foreign-born or foreign national populations are available only for selected countries, and discerning the effects of international migration on these aspects of population structure is further confounded by systematic misreporting of age and underenumeration of men in African census results (P.Rowe, personal communication, 1991). The limited data available illustrate migration’s effects on age and sex distributions in one country with high emigration (Lesotho), one with low immigration (Mauritania), and two with moderate immigration (Malawi and Congo).
Lesotho
In the case of Lesotho, relatively high, predominantly male emigration has affected both the sex ratio of the population and the reported growth rates. Results from Lesotho’s 1986 census do not contain age distributions by sex except for absentees, but do disaggregate total de jure and de facto10 populations by sex for both the 1976 and the 1986 enumerations. As can be seen in Table 8–18, 12.5 percent of the total population was absent from the country at the time of the 1976 census. The sex ratio (males per female) of the de jure population was 0.93, whereas that of the de facto population was 0.76, reflecting substantial male migration to South African mine work. Indeed, the sex ratio of absentees was 5.48.
In 1986, by which time opportunities for labor migration to South Africa had contracted even more rapidly for males than for females, only 8.5 percent of the de jure population was absent. While the de jure sex ratio
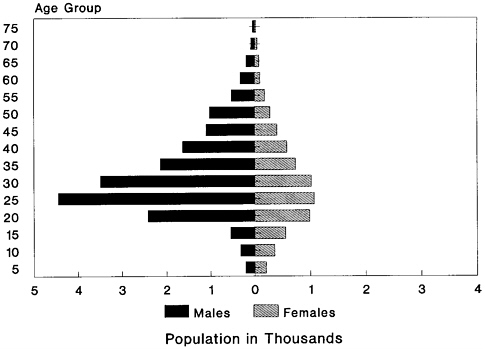
FIGURE 8–1 Age-sex distribution of absentees. SOURCE: Government of Lesotho (1989).
remained constant, that of the de facto population rose slightly to 0.81, and the sex ratio of absentees declined slightly to 5.29. The age and sex distribution of absentees shown in Figure 8–1 is characteristic of countries with high male emigration.
Changes in levels of emigration may also affect population growth rates. In Lesotho, the intercensal growth rate of the de jure population rose from 2.29 to 2.63 between 1976 and 1986, a pattern that the census report of preliminary results speculates “could be attributed to constant fertility over time, coupled with declining mortality” (Lesotho, 1987:3). However, although the reported total fertility rate (TFR) changed little between 1965 and 1988 (from 5.8 to 5.7), and infant mortality decreased (from 142 to 98 per 1,000 live births) (World Bank, 1990:230,232), the contribution of declining male migration to maintaining high fertility cannot be ruled out without further analysis. It is clear that published rates of population growth should be interpreted with caution in cases of substantial emigration. Calculations conducted for this chapter indicate that the de facto (i.e., resident) population alone grew at the rate of 3.1 percent per year; however, it is the de jure rate of growth (2.6 percent per year) that is published (Lesotho, 1987; World Bank, 1990:228).
Mauritania
Foreign nationals11 were a relatively low proportion of Mauritania’s total resident population (2.1 percent), and their effects on aggregate sex and age distributions were correspondingly small. As shown in Table 8–19, the foreign population was predominantly male in all but the 0- to 14-year-old group, reflecting the migration of men (some with families) who came principally from Senegal, Mali, and Guinea for work in Mauritania’s urban areas. As is typical for countries with male labor immigration, the sex ratio was highest (1.73) among foreigners aged 15–59, substantially higher than among Mauritanians of the same age (0.89). However, because of their small numbers, migrants had little effect on the sex ratio of the total population, raising it only by 0.01 point in any age group.
For people under 60, there were notable differences in age distribution between foreign nationals and Mauritanians. Children aged 0–14 years were 32 percent of the foreign population, but 44 percent of the native born. Relatedly, adults 15–59 years of age were more than 65 percent of the former group, but slightly less than 50 percent of the latter. These differences were reflected most sharply in the dependency ratios,12 which were 53.2 and 100.6 in the foreign and national populations, respectively. The presence of foreign nationals had little demonstrable effect on the age distribution of Mauritania’s total population. The preponderance of working-age migrants raised the proportion of all residents 15–59 years by only 0.3 percentage point. However, migrants did serve to lower the dependency ratio of the total population by 1.3.
Malawi
Malawi had a moderately high proportion of foreign born in the total population (5.2 percent) as of the 1977 census, although this proportion fell from 7.3 percent in the 1966 census, a decline that coincided with a deceleration of the country’s average annual per capita GNP growth rate (World Bank, 1989:221). The case of Malawi illustrates that the effects of migration on sex and age distributions will depend greatly on the composition of
|
11 |
Foreign national, rather than foreign-born, population is recorded in Mauritania’s 1977 census results, which published data on foreign and Mauritanian nationals by sex only for broad age groups. |
|
12 |
The dependency ratio is usually calculated as the number of persons in the “dependent” ages (less than 15 and more than 64), divided by the number of persons in the “economically productive” ages (15 to 64 years), multiplied by 100. Because Mauritania, Malawi, and Congo aggregate data by broad age groups, the dependency ratios shown in Tables 8–19 through 8–21 are calculated in a slightly different manner. |
that migration. In contrast to Mauritania (and with the exception of those over 60 years of age), the sex ratios of Malawi’s native and foreign-born populations (Table 8–20) differed from one another only slightly in 1977, reflecting substantial female immigration or the systematic underenumeration of men in both the native and the foreign-born populations. These sex ratios were virtually unchanged from their 1966 values, although the proportion of migrants originating from adjacent countries declined and the share from other African countries increased (Malawi, 1984:29). This observation runs counter to the frequently heard proposition that longer-distance migration is predominantly male.
The preponderance of males among the foreign born aged 60 years and over is unexplained but could result from a combination of age underreporting by female migrants and male predominance among earlier migrants, long resident in Malawi by 1977. In any case, although the presence of the foreign born had no effect on the overall sex ratio of the total population, the preponderance of foreign males aged 60 and over was sufficient to raise the sex ratio of the total population in this age group by 0.03.
Malawi’s foreign-born population in 1977 was notably concentrated in the older age groups, more so than Mauritania’s foreign nationals. Nearly 36 percent of the Malawi-born population was under the age of 10, whereas the corresponding figure for the foreign born was less than 10 percent. This difference was sufficient to lower the proportion of the total population in the 0–9 age group by 1.4 percentage points. Available age data do not permit calculation of dependency ratios by the standard age classifications, but dividing the numbers aged 0–9 and 60+ years by those aged 10–59 yields approximate dependency ratios of 42.4 and 70.5 for the foreign and national populations, respectively. This differential is less than that observed for Mauritania in the same year, again because of the substantially greater proportion of Malawi’s foreign population (both male and female) who were over age 60.
Congo
During the late 1970s and early 1980s, the Congo’s moderately high rates of economic growth associated with oil exports and growth in manufacturing attracted increasing numbers of migrants. The proportion of foreign born in the country’s total resident population rose from 4.1 percent in 1974 to 5.1 percent in 1984—a proportion comparable to that observed in Malawi in 1977.
In contrast to Malawi, where female migrants outnumbered males in virtually all age groups, males exceeded females among foreigners in the Congo in all age groups 30 and over (Table 8–21). Once again, however, the predominance of males had little effect on the sex ratio of the total
population, raising it by only 0.01; in no age group did the effect exceed 0.02.
As in other migrant-receiving countries, foreign nationals present in 1984 were less concentrated in the younger age groups: 23 percent of foreigners were below age 10, compared with 32 percent of Congolese. The concentration of foreign nationals between the ages of 20 and 39 (47 percent) was even more pronounced than in Malawi (30 percent), possibly because migrants to the Congo were relatively more recent than those to Malawi. Their numbers were sufficient to raise the Congo’s total population in these age groups taken together by slightly more than 1 percentage point.
As in Malawi, available data do not permit calculation of dependency ratios by the standard age classifications, but the 0–9 and 60-and-over dependency ratios were 35.7 and 60.8 for the foreign and Congolese populations, respectively, and the relatively small number of foreigners in the dependent ages was sufficient to lower the dependency ratio in the total population by 1.4.
CONCLUSION
Based on analysis of available census data for 35 (out of 48) sub-Saharan African countries, international migrants are estimated to average 3.6 percent of the total population, comparable to the proportion of foreigners in EC countries (4 percent). The actual proportion of migrants in sub-Saharan Africa is quite possibly higher, however, given the prevalence of clandestine movements. In any case, the “true” figure is undoubtedly different: International migration flows in Africa, as elsewhere, are notably volatile, unpredictable, and hard to measure.
Eastern Africa has been most affected by refugee flows (principally from Mozambique, Ethiopia, Sudan, and Somalia), whereas migration for employment (in some cases accompanied by family members) has been the major type of movement in middle, western, and southern Africa. The highest concentration of migrants is found in western Africa, a region that has also recently experienced an increase in refugee flows. Migration in southern Africa has been largely temporary and oscillatory, and is still dominated by movements to South Africa, despite that country’s reduced reliance on foreign mine workers. These aggregate data mask a number of country-level variations. Analyses for this chapter have suggested that the type and the composition of international migration, as well as the duration of stay, can vary considerably by both nationality of origin and country of destination.
Fragmentary evidence suggests that since the late 1970s, migration of highly skilled workers within Africa is increasing, as the result of rising
levels of education, deepening disparities among African countries, and limited opportunities outside the continent. The number of sub-Saharan Africans seeking asylum in developed countries of the North is growing, however.
Given the limited number of cases for which data are available, it is difficult to draw generalizable conclusions about the effects of migration on population age and sex distributions. At best, one can put forward some observations to be examined in further research. The case of Lesotho suggests that when emigration exceeds 8 percent of total population and is heavily dominated by one sex, there are demonstrable effects on the sex ratios and differential rates of growth in de jure and de facto populations.
In those migrant-receiving countries such as Mauritania, Malawi, and the Congo, in which foreigners are a small-to-moderate proportion of total population, the effects of migration are evident largely in intergroup differences, notably in the age distributions and dependency ratios. In keeping with conventional wisdom, foreigners are more concentrated than nationals in the economically active age groups, with relatively smaller proportions in the dependent age groups. Correspondingly, dependency ratios are significantly lower among the foreign populations—by as much as 47 per 100 in Mauritania. Nonetheless, these differences appear to have little overall effect on the age distributions or dependency ratios of the total population. At most, the presence of a small-to-moderate proportion of foreigners changes the distribution of population in a given age group by 1.4 percentage points, and changes the overall dependency ratio by no more than 1.7 per 100.
Summary observations as to the effects of small-to-moderate proportions of foreigners on sex ratios are more difficult to make because of variability in the sex composition of foreign populations. In the case of Malawi, there was virtually no difference in the sex ratios of foreign and national populations in any age group or overall. In the Congo and Mauritania, there were substantial differences between foreigners’ and nationals’ sex ratios within given age groups; but only in the case of Mauritania was the sex ratio of the total foreign population significantly higher than that of nationals. In both countries, these differentials had little effect on the sex ratio of the total population; in no case was the latter figure changed by more than 0.02. However, these results might well have been different in cases such as The Gambia or Côte d’Ivoire, where foreigners are a relatively high proportion of total population and males predominate.
TABLE 8–1 Summary of Population and Migrant Stock
|
|
Immigrants |
||||
|
Destinationa |
Country Categoryb |
Census Datec |
Data Classd |
Non-Africang |
|
|
Western |
|
||||
|
Benin |
OLI |
1979 |
N |
– |
– |
|
Burkina Faso |
LISA |
1975 |
B |
107,517 |
13,275 |
|
Côte d’Ivoire |
MIOI |
1975 |
N |
1,437,319 |
37,124 |
|
The Gambia |
LISA |
1973 |
B |
53,300 |
1,254 |
|
Ghana |
OLI |
1970 |
N |
547,149 |
14,983 |
|
Guinea-Bissau |
OLI |
1979 |
B |
12,043 |
888 |
|
Guinea |
OLI |
n.a. |
|
– |
– |
|
Liberia |
MIOI |
1974 |
B |
47,654 |
11,804 |
|
Mali |
LISA |
1976 |
B |
72,365 |
4,549 |
|
Mauritania |
MIOI |
1977 |
N |
23,007 |
5,161 |
|
Niger |
LISA |
n.a. |
|
– |
– |
|
Nigeria |
MIOE |
n.a. |
– |
– |
|
|
Senegal |
MIOI |
1976 |
N |
93,072 |
25,710 |
|
Sierra Leone |
OLI |
1974 |
N |
67,164 |
8,826 |
|
Togo |
OLI |
1970 |
B |
|
– |
|
Middle |
|
||||
|
Angola |
MIOE |
1993 |
B |
7,892 |
7,338 |
|
Cameroon |
MIOE |
1976 |
B |
185,558 |
14,630 |
|
Central African Republic |
OLI |
1975 |
B |
41,362 |
3,221 |
|
Chad |
LISA |
n.a. |
|
– |
– |
|
Congo |
MIOE |
1984 |
B |
45,703 |
5,464 |
|
Gabon |
MIOE |
n.a. |
|
– |
– |
|
Zaire |
OLI |
1984k |
B |
– |
– |
|
Eastern |
|
||||
|
Burundi |
OLI |
1979 |
B |
79,902 |
2,820 |
|
Ethiopia |
OLI |
n.a. |
|
– |
– |
|
Kenya |
OLI |
1979k |
B |
– |
– |
|
Madagascar |
OLI |
1975 |
B |
1,078 |
52,237 |
|
Malawi |
OLI |
1977 |
B |
281,806 |
6,938 |
|
Mozambique |
OLI |
1980 |
N |
– |
– |
|
Rwanda |
OLI |
1978 |
N |
36,789 |
5,122 |
|
Somalia |
LISA |
n.a. |
|
– |
– |
|
Tanzania |
OLI |
1978k |
N |
– |
– |
|
Uganda |
OLI |
1969 |
B |
486,300 |
56,114 |
|
Zambia |
MIOI |
1980 |
B |
184,742 |
46,612 |
|
Zimbabwe |
MIOI |
n.a. |
|
– |
– |
|
Southern |
|
||||
|
Botswana |
MIOI |
1981 |
N |
8,471 |
6,886 |
|
Lesotho |
MIOI |
n.a. |
|
– |
– |
|
Namibia |
MIOI |
n.a. |
– |
– |
|
|
Swaziland |
MIOI |
1976 |
B |
21,946 |
4,212 |
|
South Africa |
UMI |
1985 |
B |
1,404,975 |
462,084 |
|
Northern |
|
||||
|
Sudan |
OLI |
1973k |
B |
– |
– |
|
Other Africaf |
|
20,581 |
42,264 |
||
|
Total |
5,267,695 |
839,516 |
|||
|
Totalh |
Non-immigrants |
Not Stated |
Total Population |
Immigrants (% total population) |
|
41,284 |
3,286,937 |
2,779 |
3,331,000 |
1.2 |
|
110,681 |
5,517,411 |
10,000 |
5,638,092 |
2.0 |
|
1,474,469 |
5,203,580 |
31,951 |
6,710,000 |
22.0 |
|
54,554 |
437,636 |
1,309 |
493,499 |
11.1 |
|
562,132 |
7,997,181 |
– |
8,559,313 |
6.6 |
|
12,931 |
755,069 |
– |
768,000 |
1.7 |
|
– |
– |
– |
6,200,000i |
|
|
59,458 |
1,443,910 |
– |
1,503,368 |
4.0 |
|
146,089 |
6,248,829 |
– |
6,394,918 |
2.3 |
|
28,168 |
1,310,832 |
– |
1,339,000 |
2.1 |
|
– |
– |
– |
6,700,000i |
|
|
– |
– |
– |
105,400,000i |
|
|
118,782 |
4,879,103 |
– |
4,997,885 |
2.4 |
|
79,414 |
2,655,745 |
724 |
2,735,883 |
2.9 |
|
143,620 |
1,807,380 |
1,951,000 |
– |
7.4 |
|
15,230 |
8,184,770 |
– |
8,200,000f |
0.2 |
|
218,069 |
6,914,889 |
– |
7,132,958 |
3.1 |
|
44,583 |
1,699,451 |
36,995 |
1,781,029 |
2.5 |
|
– |
– |
– |
5,200,000i |
|
|
96,639 |
1,260,055 |
552,306 |
1,909,000 |
5.1 |
|
– |
– |
– |
1,200,000i |
|
|
637,605 |
29,033,802 |
– |
29,671,407 |
2.1 |
|
82,851 |
3,945,569 |
129 |
4,028,549 |
2.1 |
|
– |
– |
– |
43,900,000i |
|
|
157,371 |
15,169,560 |
130 |
15,327,061 |
1.0 |
|
53,315 |
7,549,710 |
765 |
7,603,790 |
0.7 |
|
288,744 |
5,257,554 |
1,162 |
5,547,460 |
5.2 |
|
39,142 |
11,634,858 |
– |
11,674,000 |
0.3 |
|
41,911 |
4,788,569 |
1,047 |
4,831,527 |
0.9 |
|
– |
– |
– |
7,800,000i |
|
|
415,684 |
17,096,927 |
– |
17,512,611 |
2.4 |
|
542,414 |
8,998,319 |
2,812 |
9,543,545 |
5.7 |
|
231,354 |
5,430,646 |
– |
5,662,000 |
4.1 |
|
– |
– |
– |
9,000,000i |
|
|
15,619 |
925,381 |
– |
941.000j |
1.7 |
|
– |
– |
– |
1,600,000i |
|
|
– |
– |
– |
1,100,000i |
|
|
26,460 |
468,074 |
466 |
495,000 |
5.3 |
|
1,862,192 |
– |
– |
23,386,000f |
8.0 |
|
227,906 |
12,015,614 |
1,870,480 |
14,114,000 |
1.6 |
|
35,272 |
1,825,339 |
4,673 |
1,860,611 |
1.9 |
|
7,863,943 |
183,742,700 |
|
215,643,506 |
3.6l |
|
|
NOTE: —: data unavailable. |
|
a |
Region classifications from Adepoju (1988). |
|
b |
Country categories from World Bank (1986): LISA=low income semi-arid; OLI=other low income; MIOE=middle income oil exporting; MIOI=middle income oil importing; UMI =upper middle income; SP=small population (<500,000). |
|
c |
n.a.: not available. |
|
d |
N=foreign national; B=foreign born. |
|
e |
Includes all of North Africa. |
|
f |
Unknown foreign born classified as “Other Africa.” Includes eight countries of Comoros, Mauritius, Reunion, São Tomé and Principe, Seychelles, Cape Verde, Equitorial Guinea, and Djibouti. |
|
g |
Includes United Kingdom, Belgium, France, Portugal, and other Europe, Asia (excluding countries of the former USSR); Middle Eastern countries, United States, Canada, and other Western Hemisphere. May include African immigrants classified as “undetermined foreigners” by some countries’ censuses. |
|
h |
Figures for total immigrants derive either from the sum of African and non-African immigrants or from the total foreign-born population figures in Table 8–5. Discrepancies between these two sources are reflected in the column “Unspecified origin or residual” in Table 8–8. |
|
i |
Figures from Haub and Kent (1986). |
|
j |
Total population figures from World Bank (1986) for mid-1973. |
|
k |
Data on immigrants by country are not yet available. |
|
l |
This figure does not include countries for which immigrant data are not available. |
TABLE 8–2 Stocks of Migrants by Source and Destination: Western Africa
|
Destination Country and Population Abroad |
Source Country |
||||
|
Benin |
Burkina Faso |
Côte d’Ivoire |
The Gambia |
Ghana |
|
|
Destinationc |
|
||||
|
Burkina Faso |
1,544 |
– |
49,141 |
– |
19,162 |
|
Côte d’Ivoire |
38,403 |
774,099 |
– |
– |
47,431 |
|
The Gambia |
– |
– |
– |
– |
– |
|
Ghana |
33,447 |
159,299 |
18,301 |
– |
– |
|
Guinea Bissau |
– |
– |
– |
– |
– |
|
Liberia |
51 |
– |
1,770 |
– |
8,068 |
|
Mali |
– |
23,259 |
3,917 |
– |
322 |
|
Mauritania |
– |
– |
– |
– |
– |
|
Senegal |
– |
– |
– |
3,095 |
– |
|
Sierra Leone |
– |
– |
– |
4,539 |
1,346 |
|
Other Africaa |
– |
– |
– |
– |
– |
|
Total population |
3,331,000 |
5,638,092 |
6,710,000 |
493,499 |
8,559,313 |
|
Population abroadb |
|
||||
|
Number |
75,957 |
956,657 |
73,129 |
7,634 |
76,917 |
|
Percent |
2.3 |
17.0 |
1.1 |
1.5 |
0.9 |
|
NOTES: For country category, date of survey, and data class, see Table 8–1; regional classification from Adepoju (1988); —: no recorded migration. aUnknown foreign born classified as “Other Africa.” Category includes the eight countries of Comoros, Mauritius, Reunion, São Tomé and Principe, Seychelles, Cape Verde, Equitorial Guinea, and Djibouti, and all of North Africa except Sudan. bFigures include interregional migration as well as the intraregional migration shown on this table. cCountries not listed had no recorded immigration. dData not available. eFigures from Haub and Kent (1986). |
|||||
|
Destination Country and Population Abroad |
Source Country |
||||
|
Guinea-Bissau |
Guinea |
Liberia |
Mali |
Mauritania |
|
|
Destinationc |
|
||||
|
Burkina Faso |
– |
– |
– |
23,984 |
– |
|
Côte d’Ivoire |
– |
99,476 |
3,824 |
353,448 |
– |
|
The Gambia |
7,176 |
10,442 |
– |
5,478 |
1,779 |
|
Ghana |
– |
– |
4,584 |
13,412 |
– |
|
Guinea Bissau |
– |
5,675 |
– |
– |
– |
|
Liberia |
– |
26,337 |
– |
1,597 |
– |
|
Mali |
– |
19,394 |
– |
– |
9,464 |
|
Mauritania |
– |
1,555 |
– |
3,461 |
– |
|
Senegal |
23,805 |
38,821 |
– |
8,872 |
11,294 |
|
Sierra Leone |
– |
44,504 |
3,213 |
– |
– |
|
Other Africaa |
35 |
– |
– |
– |
– |
|
Total population |
768,000 |
6,200,000e |
1,503,368 |
6,394,918 |
1,339,000 |
|
Population abroadb |
|
||||
|
Number |
31,016 |
246,325 |
11,621 |
413,975 |
22,967 |
|
Percent |
4.0 |
4.0 |
0.8 |
6.5 |
1.7 |
|
Niger |
Nigeria |
Senegal |
Sierra Leone |
Togo |
Other Africaa |
Totalb |
|
|
4,515 |
2,122 |
2,300 |
– |
3,169 |
1,580 |
107,517 |
|
|
33,552 |
42,415 |
20,288 |
– |
12,830 |
11,553 |
1,437,319 |
|
|
– |
– |
27,177 |
582 |
– |
666 |
53,300 |
|
|
15,787 |
55,539 |
– |
– |
244,735 |
2,045 |
547,149 |
|
|
– |
– |
6,368 |
– |
– |
– |
12,043 |
|
|
– |
1,940 |
197 |
6,440 |
203 |
1,051 |
47,654 |
|
|
3,816 |
– |
3,615 |
– |
– |
8,578 |
72,365 |
|
|
– |
– |
17,624 |
– |
– |
367 |
23,007 |
|
|
– |
– |
– |
– |
– |
7,185 |
93,072 |
|
|
– |
8,209 |
– |
– |
– |
5,353 |
67,164 |
|
|
– |
– |
– |
– |
– |
–d |
–d |
|
|
6,700,000e |
105,000,000e |
4,997,885 |
2,735,883 |
1,951,000 |
|
||
|
59,316 |
245,620 |
81,265 |
7,022 |
262,082 |
|||
|
0.9 |
2.3 |
1.6 |
0.3 |
13.4 |
|||
TABLE 8–3 Stocks of Migrants by Source and Destination: Middle Africa
|
Destination Country and Population Abroad |
Source Country |
|||
|
Angola |
Cameroon |
Central African Republic |
Chad |
|
|
Destinationc |
|
|||
|
Angola |
– |
– |
– |
– |
|
Cameroon |
– |
– |
12,431 |
28,063 |
|
Central African Republic |
– |
8,609 |
– |
17,845 |
|
Congo |
6,218 |
1,361 |
7,101 |
702 |
|
Other Africaa |
965 |
– |
– |
– |
|
Total population |
8,200,000 |
7,132,958 |
1,781,029 |
5,200,000e |
|
Population abroadb |
|
|||
|
Number |
38,458 |
9,970 |
19,532 |
46,610 |
|
Percent |
0.5 |
0.1 |
1.1 |
0.9 |
|
NOTE: For country category, date of survey, and data class, see Table 8–1; regional classification from Adepoju (1988); —: no recorded migration. aUnknown foreign born classified as “Other Africa.” Category includes the eight countries of Comoros, Mauritius, Reunion, São Tomé and Principe, Seychelles, Cape Verde, Equatorial Guinea, and Djibouti, and all of North Africa except Sudan. bFigures include interregional migration as well as the intraregional migration shown on this table. cCountries not listed had no recorded immigration. dData not available. eFigures from Haub and Kent (1986). |
||||
TABLE 8–4 Stock of Migrants by Source and Destination: Eastern Africa and Sudan
|
Destination Country and Population Abroad |
Source Country |
||||
|
Burundi |
Kenya |
Madagascar |
Malawi |
Mozambique |
|
|
Destinationc |
|
||||
|
Burundi |
– |
– |
– |
– |
– |
|
Madagascar |
– |
– |
– |
– |
– |
|
Malawi |
– |
– |
– |
– |
– |
|
Rwanda |
25,609 |
– |
– |
– |
– |
|
Uganda |
40,024 |
119,614 |
– |
– |
– |
|
Zambia |
– |
– |
– |
27,089 |
2,904 |
|
Other Africaa |
– |
77 |
12,997 |
– |
197 |
|
Total population |
4,028,549 |
15,327,061 |
7,603,790 |
5,547,460 |
11,647,000 |
|
Population abroadb |
|
||||
|
Number |
65,633 |
127,071 |
13,701 |
57,940 |
76,449 |
|
Percent |
1.6 |
0.8 |
0.2 |
1.0 |
0.7 |
|
NOTES: For country category, date of survey, and data class, see Table 8–1; regional classification from Adepoju (1988); —: no recorded migration. aUnknown foreign born classified as “Other Africa.” Category includes the eight countries of Comoros, Mauritius, Reunion, São Tomé and Principe, Seychelles, Cape Verde, Equitorial Guinea, and Djibouti, and all of North Africa except Sudan. bFigures include interregional migration as well as the intraregional migration shown on this table. cCountries not listed has no recorded immigration. dData not available. eFigures from Haub and Kent (1986). |
|||||
|
Rwanda |
Somalia |
Sudan |
Tanzania |
Uganda |
|
47,750 |
5 |
– |
13,018 |
1,825 |
|
– |
– |
– |
– |
– |
|
– |
– |
– |
– |
– |
|
– |
– |
– |
1,104 |
2,593 |
|
161,953 |
– |
65,240 |
34,398 |
– |
|
– |
– |
– |
16,493 |
– |
|
– |
– |
– |
215 |
– |
|
4,831,527 |
7,800,000e |
14,114,000 |
17,512,611 |
9,543,545 |
|
209,703 |
5 |
65,959 |
68,416 |
4,900 |
|
4.3 |
0.0 |
0.5 |
0.4 |
0.1 |
|
Destination Country and Population Abroad |
Source Country |
|||
|
Zambia |
Zimbabwe |
Other Africaa |
Totalb |
|
|
Destinationc |
|
|||
|
Burundi |
– |
– |
294 |
79,902 |
|
Madagascar |
– |
– |
1,078 |
1,078 |
|
Malawi |
– |
– |
281,806 |
281,806 |
|
Rwanda |
– |
– |
253 |
36,789 |
|
Uganda |
– |
– |
1,073 |
486,300 |
|
Zambia |
– |
48,111 |
10,220 |
184,742 |
|
Other Africaa |
24 |
– |
–d |
–d |
|
Total population |
5,662,000 |
9,000,000e |
|
|
|
Population abroadb |
|
|||
|
Number |
21,168 |
147,370 |
|
|
|
Percent |
0.4 |
1.6 |
||
TABLE 8–5 Stocks of Migrants by Source and Destination: Southern Africa
|
Destination Country and Population Abroad |
Source Countries |
||||||
|
Botswana |
Lesotho |
Namibia |
South Africa |
Swaziland |
Other Africaa |
Totalb |
|
|
Destinationc |
|
||||||
|
Botswana |
– |
464 |
521 |
3,807 |
125 |
350 |
8,471 |
|
South Africa |
28,924 |
136,911 |
51,619 |
– |
34,524 |
913,085 |
1,404,975 |
|
Swaziland |
– |
– |
– |
18,678 |
– |
1,213 |
21,946 |
|
Other Africaa |
– |
– |
– |
341 |
– |
–d |
–d |
|
Total population |
941,000 |
1,600,000e |
1,100,000e |
23,386,000 |
495,000 |
|
|
|
Population abroadb |
|
||||||
|
Number |
57,745 |
137,375 |
52,709 |
22,829 |
34,649 |
|
|
|
Percent |
6.1 |
8.6 |
4.8 |
0.1 |
7.0 |
||
|
NOTE: For country category, date of survey, and data class, see Table 8–1; regional classification from Adepoju (1988); —: no recorded migration. aUnknown foreign born classified as “Other Africa.” Category includes the eight countries of Comoros, Mauritius, Reunion, São Tomé and Principe, Seychelles, Cape Verde, Equitorial Guinea, and Djibouti, and all of North Africa except Sudan. bFigures include interregional migration as well as the intraregional migration shown on this table. cCountries not listed had no recorded immigration. dData not available. eFigures from Haub and Kent (1986). |
|||||||
TABLE 8–6 Stocks of Migrants in Sub-Saharan Africa by Source and Destination: Interregional Migration
|
|
Source Region |
||||
|
Destination Region |
Western |
Middle |
Eastern and Sudan |
Southern |
Total |
|
Western |
– |
0 |
0 |
0 |
0 |
|
Middle |
148,212a |
– |
906 |
56 |
149,174 |
|
Eastern and Sudan |
357 |
138,469b |
– |
29,337c |
168,163 |
|
Southern |
687 |
8,315d |
236,169e |
– |
245,171 |
|
Total |
149,256 |
146,784 |
237,075 |
29,393 |
562,508 |
|
NOTES: For country category, date of survey, and data class, see Table 8–1. See Tables 8–2 through 8–5 for intraregional migration. Cell totals include all interregional migration; country-to-country migrations of more than 2,000 people are detailed in the footnotes. aIncludes 135,296 from Nigeria to Cameroon; 2,850 from Mali to Congo; and 2,817 from Senegal to Congo. bIncludes 27,682 from Angola to Zambia; 63,998 from Congo to Uganda; 16,653 from Zaire to Burundi; 7,230 from Zaire to Rwanda; and 22,906 from Zaire to Zambia. cIncludes 28,821 from Botswana to Zambia. dIncludes 3,190 from Angola to South Africa; and 3,154 from Congo to South Africa. eIncludes 7,380 from Kenya to South Africa; 30,617 from Malawi to South Africa; 2,055 from Mozambique to Swaziland; 71,209 from Mozambique to South Africa; 3,188 from Tanzania to South Africa; 21,041 from Zambia to South Africa; 2,375 from Zimbabwe to Botswana; and 96,884 from Zimbabwe to South Africa. |
|||||
TABLE 8–7 Stocks of Migrants in Africa by Source and Destination: Non-African Immigrants
|
|
Source |
|||||
|
Destination |
Former USSR |
Europea |
Middle East and Asiab |
Americasc |
Undetermined and Other Countriesd |
Total Non-African |
|
Western |
|
|||||
|
Benin |
– |
– |
– |
– |
– |
– |
|
Burkina Faso |
– |
2,560 |
259 |
– |
10,456 |
13,275 |
|
Côte d’Ivoire |
– |
30,247 |
5,902 |
975 |
– |
37,124 |
|
The Gambia |
– |
– |
– |
– |
1,254 |
1,254 |
|
Ghana |
– |
7,584 |
4,926 |
– |
2,473 |
14,983 |
|
Guinea Bissau |
– |
– |
– |
– |
888 |
888 |
|
Liberia |
– |
4,101 |
4,643 |
2,808 |
252 |
11,804 |
|
Mali |
836 |
3,054 |
301 |
228 |
130 |
4,549 |
|
Mauritania |
– |
3,045 |
– |
308 |
1,808 |
5,161 |
|
Senegal |
– |
15,125 |
6,914 |
1,183 |
2,488 |
25,710 |
|
Sierra Leone |
30 |
2,054 |
5,979 |
763 |
– |
8,826 |
|
Togo |
– |
– |
– |
– |
– |
– |
|
Middle |
|
|||||
|
Angola |
– |
6,063 |
118 |
846 |
311 |
7,338 |
|
Cameroon |
– |
12,552 |
– |
1,067 |
1,011 |
14,630 |
|
Central African Republic |
– |
– |
– |
– |
3,221 |
3,221 |
|
Congo |
– |
5,071 |
– |
– |
393 |
5,464 |
|
Zaire |
– |
– |
– |
– |
– |
– |
|
Eastern |
|
|||||
|
Burundi |
– |
2,284 |
392 |
141 |
3 |
2,820 |
|
Kenya |
– |
– |
– |
– |
– |
– |
|
Madagascar |
– |
38,310 |
10,447 |
278 |
3,202 |
52,237 |
|
Malawi |
– |
– |
– |
– |
6,938 |
6,938 |
|
|
Source |
|||||
|
Destination |
Former USSR |
Europea |
Middle East and Asiab |
Americasc |
Undetermined and Other Countriesd |
Total Non-African |
|
Eastern |
|
|||||
|
Mozambique |
– |
– |
– |
– |
– |
– |
|
Rwanda |
– |
3,121 |
1,568 |
– |
433 |
5,122 |
|
Tanzania |
– |
– |
– |
– |
– |
– |
|
Uganda |
– |
45,073 |
10,009 |
1,032 |
– |
56,114 |
|
Zambia |
– |
12,744 |
12,989 |
4,351 |
16,528 |
46,612 |
|
Zimbabwe |
– |
– |
– |
– |
– |
– |
|
Southern |
|
|||||
|
Botswana |
– |
4,985 |
946 |
776 |
179 |
6,886 |
|
South Africa |
5,341 |
405,798 |
25,879 |
10,347 |
14,719 |
462,084 |
|
Swaziland |
– |
– |
– |
– |
4,212 |
4,212 |
|
Northern |
|
|||||
|
Sudan |
– |
– |
– |
– |
– |
– |
|
Other Africa |
21 |
24,236 |
1,210 |
142 |
16,655 |
42,264 |
|
Total |
6,228 |
628,007 |
92,482 |
25,245 |
87,554 |
839,516 |
|
NOTE: —: unknown. aIncludes United Kingdom, Belgium, France, Portugal, and other Europe. bIncludes Asia, China, India, Pakistan, Southeast Asia, Japan and Middle Eastern countries. cIncludes United States, Canada, and other Western Hemisphere countries. dMay include African immigrants classified as “undetermined foreigners” by some countries’ censuses. |
||||||
TABLE 8–8 Stocks of Migrants in Africa by Destination: Summary
|
Destination |
Total Immigrantsa |
Non-Immigrants |
Not Stated |
Total Population |
Immigrants as Percent of Total Population |
Sub-Saharan African Immigrants as Percent of Populationb |
Unspecified Origin or Residuala |
|
Western |
|
||||||
|
Benin |
41,284 |
3,286,937 |
2,779 |
3,331,000 |
1.2 |
– |
41,284 |
|
Burkina Faso |
110,681 |
5,517,411 |
10,000 |
5,638,092 |
2.0 |
1.9 |
(10,111) |
|
Côte d’Ivoire |
1,474,469 |
5,203,580 |
31,951 |
6,710,000 |
22.0 |
21.4 |
26 |
|
The Gambia |
54,554 |
437,636 |
1,309 |
493,499 |
11.1 |
10.8 |
– |
|
Ghana |
562,132 |
7,997,181 |
– |
8,559,313 |
6.6 |
6.4 |
– |
|
Guinea Bissau |
12,931 |
755,069 |
– |
768,000 |
1.7 |
1.6 |
– |
|
Liberia |
59,458 |
1,443,910 |
– |
1,503,368 |
4.0 |
3.2 |
– |
|
Mali |
146,089 |
6,248,829 |
– |
6,394,918 |
2.3 |
1.1 |
69,175 |
|
Mauritania |
28,168 |
1,310,832 |
– |
1,339,000 |
2.1 |
1.7 |
– |
|
Senegal |
118,782 |
4,879,103 |
– |
4,997,885 |
2.4 |
1.9 |
– |
|
Sierra Leone |
79,414 |
2,655,745 |
724 |
2,735,883 |
2.9 |
2.5 |
3,424 |
|
Togo |
143,620 |
1,807,380 |
– |
1,951,000 |
7.4 |
– |
143,620 |
|
Middle |
|
||||||
|
Angola |
15,230 |
8,184,770 |
8,200,000c |
– |
0.2 |
0.1 |
– |
|
Cameroon |
218,069 |
6,914,889 |
– |
7,132,958 |
3.1 |
2.6 |
17,881 |
|
Central African Republic |
44,583 |
1,699,451 |
36,995 |
1,781,029 |
2.5 |
2.3 |
– |
|
Congo |
96,639 |
1,260,055 |
552,306 |
1,909,000 |
5.1 |
2.4 |
45,472 |
|
Zaire |
637,605 |
29,033,802 |
– |
29,671,407 |
2.1 |
– |
637,605 |
|
Eastern |
|
||||||
|
Burundi |
82,851 |
3,945,569 |
129 |
4,028,549 |
2.1 |
2.0 |
129 |
|
Kenya |
157,371 |
15,169,560 |
130 |
15,327,061 |
1.0 |
– |
157,371 |
|
Madagascar |
53,315 |
7,549,710 |
765 |
7,603,790 |
0.7 |
– |
– |
|
Destination |
Total Immigrantsa |
Non-Immigrants |
Not Stated |
Total Population |
Immigrants as Percent of Total Population |
Sub-Saharan African Immigrants as Percent of Populationb |
Unspecified Origin or Residuala |
|
Eastern |
|
||||||
|
Malawi |
288,744 |
5,257,554 |
1,162 |
5,547,460 |
5.2 |
5.1 |
– |
|
Mozambique |
39,142 |
11,634,858 |
– |
11,674,000 |
0.3 |
– |
39,142 |
|
Rwanda |
41,911 |
4,788,569 |
1,047 |
4,831,527 |
0.9 |
0.8 |
– |
|
Tanzania |
415,684 |
17,096,927 |
– |
17,512,611 |
2.4 |
|
415,684 |
|
Uganda |
542,414 |
8,998,319 |
2,812 |
9,543,545 |
5.7 |
5.1 |
– |
|
Zambia |
231,354 |
5,430,646 |
– |
5,662,000 |
4.1 |
3.3 |
– |
|
Southern |
|
||||||
|
Botswana |
15,619 |
925,381 |
– |
941,000c |
1.7 |
0.9 |
262 |
|
South Africa |
1,862,192 |
– |
– |
23,386,000c |
8.0 |
6.0 |
(4,867) |
|
Swaziland |
26,460 |
468,074 |
466 |
495,000 |
5.3 |
4.4 |
302 |
|
Northern |
|
||||||
|
Sudan |
227,906 |
12,015,614 |
1,870,480 |
14,114,000 |
1.6 |
– |
227,906 |
|
Other Africa |
35,272 |
1,825,339 |
4,673 |
1,860,611 |
1.9 |
1.1 |
(27,573) |
|
Total |
7,863,943 |
183,742,700 |
|
215,643,506 |
3.6 |
|
1,756,732 |
|
NOTE: Parentheses indicate negative numbers. aFigures for total immigrants derive either from the sum of African and non-African immigrants (Tables 8–2, 8–3, 8–4, 8–5, and 8–7) or from the total foreign-born population figures in Table 8–15. Discrepancies between these two sources are reflected in the column “Unspecified origin or residual.” bBecause several countries in the table do not distinguish African from non-African immigrants, this percentage cannot be calculated for all countries. cTotal population figures are World Bank estimates for mid-1973 from Population Growth and Policies (1986). |
|||||||
TABLE 8–9 Refugees, by Asylum Country, 1987, 1988, 1990
|
Asylum Country |
1987 |
1988 |
1990a |
|
Western |
|
||
|
Benin |
3,700 |
3,000 |
800 |
|
Burkina Faso |
180 |
200 |
300 |
|
Côte d’Ivoire |
600 |
800 |
270,500 |
|
The Gambia |
– |
– |
800 |
|
Ghana |
140 |
100 |
8,000 |
|
Guinea Bissau |
– |
– |
1,600 |
|
Guinea |
– |
– |
325,000 |
|
Liberia |
110 |
200 |
– |
|
Mali |
– |
– |
10,600 |
|
Mauritania |
– |
– |
22,000 |
|
Niger |
– |
– |
800 |
|
Nigeria |
4,800 |
5,100 |
5,300 |
|
Senegal |
5,600 |
5,200 |
55,300 |
|
Sierra Leone |
200 |
100 |
125,000 |
|
Togo |
1,700 |
500 |
– |
|
Middle |
|
||
|
Angola |
92,000 |
95,700 |
11,900 |
|
Cameroon |
7,300 |
4,700 |
6,900 |
|
Central African Republic |
5,100 |
3,000 |
6,300 |
|
Chad |
100 |
– |
– |
|
Congo |
1,200 |
2,100 |
3,400 |
|
Gabon |
100 |
100 |
800 |
|
Zaire |
338,000 |
325,700 |
370,900 |
|
Eastern and Sudan |
|
||
|
Burundi |
76,000 |
76,000 |
90,700 |
|
Djibouti |
13,500 |
2,000 |
67,400 |
|
Ethiopia |
220,000 |
700,500 |
783,000 |
|
Kenya |
9,000 |
10,600 |
14,400 |
|
Malawi |
420,000 |
630,000 |
909,000 |
|
Mozambique |
500 |
400 |
700 |
|
Rwanda |
19,000 |
20,600 |
21,500 |
|
Somalia |
430,000 |
365,000 |
358,500 |
|
Sudan |
817,000 |
693,600 |
726,500 |
|
Tanzania |
266,000 |
266,200 |
266,200 |
|
Uganda |
120,400 |
125,500 |
156,000 |
|
Zambia |
151,500 |
149,000 |
133,950 |
|
Zimbabwe |
150,500 |
171,500 |
186,000 |
|
Southern |
|
||
|
Botswana |
5,200 |
2,700 |
1,000 |
|
Lesotho |
2,000 |
4,000 |
1,000 |
|
Namibia |
– |
– |
25,000 |
|
South Africa |
180,000 |
180,000 |
201,000 |
|
Swaziland |
67,000 |
70,700 |
47,200 |
|
Total |
3,408,430 |
3,914,800 |
5,215,250 |
|
NOTE: —: no refugees reported. aIncludes 6,500 that are not accounted for in Tables 8–10 through 8–13 because their source countries are unknown. SOURCE: Data from U.S. Committee for Refugees (1988; 1989; 1991). |
|||
TABLE 8–10 Refugees, by Source and Asylum Countries, 1990: Western Africa
|
|
Source Country |
||||
|
Asylum Country |
Guinea Bissau |
Liberia |
Mauritania |
Niger |
Senegal |
|
Côte d’Ivoire |
|
270,000 |
|
||
|
The Gambia |
|
800 |
|||
|
Ghana |
8,000 |
|
|||
|
Guinea-Bissau |
|
1,600 |
|||
|
Guinea |
325,000 |
|
|||
|
Mali |
100 |
10,000 |
500 |
|
|
|
Mauritania |
|
22,000 |
|||
|
Nigeria |
1,700 |
|
|||
|
Senegal |
5,000 |
|
50,100 |
|
|
|
Sierra Leone |
|
125,000 |
|
||
|
NOTE: These figures exclude interregional refugees and refugees from unknown source countries. See Table 8-14. SOURCE: Data from U.S. Committee for Refugees (1991). |
|||||
TABLE 8–11 Refugees, by Source and Asylum Countries, 1990: Middle Africa
|
|
Source Country |
|||
|
Asylum Country |
Angola |
Central African Republic |
Chad |
Zaire |
|
Angola |
|
9,500 |
||
|
Cameroon |
|
6,500 |
|
|
|
Central African Republic |
1,200 |
|||
|
Congo |
|
300 |
2,300 |
400 |
|
Zaire |
312,700 |
|
||
|
NOTE: These figures exclude interregional refugees and refugees from unknown source countries. See Table 8–14. SOURCE: Data from U.S. Committee for Refugees (1991). |
||||
TABLE 8–12 Refugees, by Source and Asylum Countries, 1990: Eastern Africa and Sudan
|
|
Source Country |
|||||||||
|
Asylum Country |
Burundi |
Ethiopia |
Kenya |
Malawi |
Mozambique |
Rwanda |
Somalia |
Sudan |
Uganda |
|
|
Burundi |
|
80,600 |
100 |
|
||||||
|
Djibouti |
|
6,400 |
|
61,000 |
|
|||||
|
Ethiopia |
|
385,000 |
398,000 |
|
||||||
|
Kenya |
|
3,000 |
|
2,000 |
1,000 |
|
5,100 |
|||
|
Malawi |
|
909,000 |
|
|||||||
|
Rwanda |
21,500 |
|
||||||||
|
Somalia |
|
355,000 |
3,500 |
|
||||||
|
Sudan |
700,000 |
|
2,000 |
|||||||
|
Tanzania |
154,700 |
|
72,000 |
22,300 |
|
|||||
|
Uganda |
|
87,000 |
1,500 |
64,000 |
|
|||||
|
Zambia |
|
250 |
22,000 |
|
1,200 |
|||||
|
Zimbabwe |
|
185,000 |
|
|||||||
|
NOTE: These figures exclude interregional refugees and refugees from unknown source countries. See Table 8–14. SOURCE: Data from U.S. Committee for Refugees (1991). |
||||||||||
TABLE 8–13 Refugees, by Source and Asylum Countries, 1990: Southern Africa
|
|
Source Country |
|
|
Asylum Country |
Lesotho |
South Africa |
|
Botswana |
|
1,000 |
|
Lesotho |
1,000 |
|
|
South Africa |
1,000 |
|
|
Swaziland |
|
7,700 |
|
NOTE: These figures exclude interregional refugees and refugees from unknown source countries. See Table 8–14. SOURCE: Data from U.S. Committee for Refugees (1991). |
||
TABLE 8–14 Interregional Refugees in Sub-Saharan Africa, 1990
|
|
Source Region |
|||
|
Asylum Region |
Western |
Middle |
Eastern and Sudan |
Southern |
|
Western |
– |
5,200a |
0 |
0 |
|
Middle |
0 |
– |
63,100b |
2,400c |
|
Eastern and Sudan |
0 |
158,800d |
– |
8,200e |
|
Southern |
0 |
25,000f |
239,500g |
– |
|
Total |
0 |
189,000 |
302,600 |
10,600 |
|
NOTE: Cell totals include all interregional migration; country-to-country migrations of 2,000 or more refugees are detailed in the footnotes. aIncludes 3,300 from Chad to Nigeria. bIncludes 5,100 from Sudan to Central African Republic; 10,000 from Burundi to Zaire; 12,000 from Rwanda to Zaire; 32,000 from Sudan to Zaire; and 4,000 from Uganda to Zaire. cIncludes 2,100 from South Africa to Angola. dIncludes 10,000 from Zaire to Burundi; 16,000 from Zaire to Tanzania; 98,000 from Angola to Zambia; 9,000 from Zaire to Zambia; 20,000 from Chad to Sudan; and 4,500 from Zaire to Sudan. eIncludes 2,000 from South Africa to Uganda and 3,500 from South Africa to Zambia. fAll of these refugees are from Angola to Namibia. gIncludes 200,000 from Mozambique to South Africa and 39,500 from Mozambique to Swaziland. SOURCE: Data from U.S. Committee for Refugees (1991). |
||||
TABLE 8–15 Foreign-Born Population in Selected Sub-Saharan African Countries
|
|
Foreign-Born Population |
||||||
|
Country or Area |
Reference Date |
Total Population |
Total |
Proportion of Total Population |
Male |
Female |
Sex Ratio Male to Female |
|
Western |
|
||||||
|
Benin |
1979 |
3,331,000 |
41,284a |
1.2 |
21,268 |
20,016 |
1.06 |
|
Burkina Faso |
1975 |
5,638,000 |
110,681 |
2.0 |
52,854 |
57,827 |
0.91 |
|
Côte d’Ivoire |
1975 |
6,710,000 |
1,474,469a |
22.0 |
874,073 |
600,396 |
1.46 |
|
The Gambia |
1973 |
493,000 |
54,554 |
11.1 |
33,334 |
21,220 |
1.57 |
|
Ghana |
1970 |
8,559,000 |
562,132a |
6.6 |
323,978 |
238,154 |
1.36 |
|
Guinea-Bissau |
1979 |
768,000 |
12,931 |
1.7 |
6,471 |
6,460 |
1.00 |
|
Liberia |
1974 |
1,503,000 |
59,458 |
4.0 |
35,759 |
23,699 |
1.51 |
|
Mali |
1976 |
6,395,000 |
146,089 |
2.3 |
73,458 |
72,631 |
1.01 |
|
Mauritania |
1977 |
1,339,000 |
28,168a |
2.1 |
16,488 |
11,680 |
1.41 |
|
Sierra Leone |
1974 |
2,735,000 |
79,414a |
2.9 |
48,336 |
31,078 |
1.56 |
|
Togo |
1970 |
1,951,000 |
143,620 |
7.4 |
69,294 |
74,326 |
0.93 |
|
Middle |
|
||||||
|
Cameroon |
1976 |
7,132,000 |
218,069 |
3.1 |
120,442 |
97,627 |
1.23 |
|
Central African Republic |
1975 |
1,781,000 |
44,583 |
2.5 |
21,844 |
22,739 |
0.96 |
|
Congo |
1984 |
1,909,000 |
96,639 |
5.1 |
47,797 |
48,842 |
0.98 |
|
Eastern |
|
||||||
|
Burundi |
1979 |
4,028,000 |
82,851 |
2.1 |
42,147 |
40,704 |
1.04 |
|
Kenya |
1979 |
15,327,000 |
157,371 |
1.0 |
82,298 |
75,073 |
1.10 |
|
Malawi |
1977 |
5,547,000 |
288,744 |
5.2 |
140,421 |
148,323 |
0.95 |
|
Mozambique |
1980 |
11,674,000 |
39,142a |
0.3 |
19,759 |
19,383 |
1.02 |
|
Rwanda |
1978 |
4,832,000 |
41,911a |
0.9 |
21,411 |
20,500 |
1.04 |
|
|
Foreign-Born Population |
||||||
|
Country or Area |
Reference Date |
Total Population |
Total |
Proportion of Total Population |
Male |
Female |
Sex Ratio Male to Female |
|
Eastern |
|
||||||
|
Tanzania |
1978 |
17,513,000 |
415,684 |
2.4 |
219,188 |
196,496 |
1.12 |
|
Zambia |
1980 |
5,662,000 |
231,354 |
4.1 |
121,436 |
109,918 |
1.10 |
|
Southern |
|
||||||
|
Botswana |
1981 |
941,000 |
15,619a |
1.7 |
8,788 |
6,831 |
1.29 |
|
South Africa |
1985 |
23,386,000 |
1,862,192 |
8.0 |
1,209,967 |
652,225 |
1.86 |
|
Swaziland |
1976 |
495,000 |
26,460 |
5.4 |
12,554 |
13,906 |
0.90 |
|
Northern |
|
||||||
|
Sudan |
1973 |
14,114,000 |
227,906 |
1.6 |
113,028 |
114,878 |
0.98 |
|
aClassified as foreign nationals, not foreign born. SOURCE: Data from United Nations (1989a). |
|||||||
TABLE 8–16 Sub-Saharan African Source Countries, 1990, Ranked by Refugee Stocks
|
Source Country |
Region |
Number |
Percent of Total |
Cumululative Percentage |
|
Mozambique |
Eastern |
1,427,500 |
27.4 |
27.4 |
|
Ethiopia |
Eastern |
1,064,400 |
20.4 |
47.8 |
|
Liberia |
Western |
729,800 |
14.0 |
61.8 |
|
Sudan |
Northern |
499,100 |
9.6 |
71.3 |
|
Somalia |
Eastern |
448,600 |
8.6 |
79.9 |
|
Angola |
Middle |
435,700 |
8.4 |
88.3 |
|
Rwanda |
Eastern |
203,900 |
3.9 |
92.2 |
|
Burundi |
Eastern |
186,200 |
3.6 |
95.8 |
|
Mauritania |
Western |
60,100 |
1.2 |
96.9 |
|
Zaire |
Middle |
50,700 |
1.0 |
97.9 |
|
Chad |
Middle |
35,200 |
0.7 |
98.6 |
|
Senegal |
Western |
24,400 |
0.5 |
99.0 |
|
South Africa |
Southern |
20,000 |
0.4 |
99.4 |
|
Uganda |
Eastern |
12,300 |
0.2 |
99.7 |
|
Guinea-Bissau |
Western |
5,000 |
0.1 |
99.9 |
|
Kenya |
Eastern |
3,500 |
0.1 |
100.0 |
|
Lesotho |
Southern |
1,000 |
0.0 |
100.0 |
|
Niger |
Western |
500 |
0.0 |
100.0 |
|
Namibia |
Southern |
300 |
0.0 |
100.0 |
|
Central African Republic |
Middle |
300 |
0.0 |
100.0 |
|
Malawi |
Eastern |
250 |
0.0 |
100.0 |
|
Othera |
|
6,500 |
|
|
|
Total refugee population |
5,215,250 |
|||
|
aSource country not specified. SOURCE: Data from U.S. Committee for Refugees (1991). |
||||
TABLE 8–17 Sub-Saharan African Asylum Countries, 1990, Ranked by Refugee Stocks
|
Asylum Country |
Region |
Number |
Percent of Total |
Cumululative Percentage |
|
Malawi |
Eastern |
909,000 |
17.43 |
17.43 |
|
Ethiopia |
Eastern |
783,000 |
15.01 |
32.44 |
|
Sudan |
Northern |
726,500 |
13.93 |
46.37 |
|
Zaire |
Middle |
370,900 |
7.11 |
53.49 |
|
Somalia |
Eastern |
358,500 |
6.87 |
60.36 |
|
Guinea |
Western |
325,000 |
6.23 |
66.59 |
|
Côte d’Ivoire |
Western |
270,500 |
5.19 |
71.78 |
|
Tanzania |
Eastern |
266,200 |
5.10 |
76.88 |
|
South Africa |
Southern |
201,000 |
3.85 |
80.74 |
|
Zimbabwe |
Eastern |
186,000 |
3.57 |
84.30 |
|
Uganda |
Eastern |
156,000 |
2.99 |
87.29 |
|
Zambia |
Eastern |
133,950 |
2.57 |
89.86 |
|
Sierra Leone |
Western |
125,000 |
2.40 |
92.26 |
|
Burundi |
Eastern |
90,700 |
1.74 |
94.00 |
|
Djibouti |
Eastern |
67,400 |
1.29 |
95.29 |
|
Senegal |
Western |
55,300 |
1.06 |
96.35 |
|
Swaziland |
Southern |
47,200 |
0.91 |
97.26 |
|
Namibia |
Southern |
25,000 |
0.48 |
97.74 |
|
Mauritania |
Western |
22,000 |
0.42 |
98.16 |
|
Rwanda |
Eastern |
21,500 |
0.41 |
98.57 |
|
Kenya |
Eastern |
14,400 |
0.28 |
98.85 |
|
Angola |
Middle |
11,900 |
0.23 |
99.07 |
|
Mali |
Western |
10,600 |
0.20 |
99.28 |
|
Ghana |
Western |
8,000 |
0.15 |
99.43 |
|
Cameroon |
Middle |
6,900 |
0.13 |
99.56 |
|
Central African Republic |
Middle |
6,300 |
0.12 |
99.68 |
|
Nigeria |
Western |
5,300 |
0.10 |
99.79 |
|
Congo |
Middle |
3,400 |
0.07 |
99.85 |
|
Guinea-Bissau |
Western |
1,600 |
0.03 |
99.88 |
|
Lesotho |
Southern |
1,000 |
0.02 |
99.90 |
|
Botswana |
Southern |
1,000 |
0.02 |
99.92 |
|
Benin |
Western |
800 |
0.02 |
99.93 |
|
The Gambia |
Western |
800 |
0.02 |
99.95 |
|
Niger |
Western |
800 |
0.02 |
99.97 |
|
Gabon |
Middle |
800 |
0.02 |
99.98 |
|
Mozambique |
Eastern |
700 |
0.01 |
99.99 |
|
Burkina Faso |
Western |
300 |
0.01 |
100.00 |
|
Total asylum population |
5,215,250 |
|
||
|
SOURCE: Data from U.S. Committee for Refugees (1991). |
||||
TABLE 8–18 Lesotho Population: 1976 and 1986 Censuses
|
Characteristics |
1976 |
1986 |
1976–1986 |
|
De jure population |
|
||
|
Total |
1,216,815 |
1,577,536 |
|
|
Male |
587,348 |
760,472 |
|
|
Female |
629,467 |
817,064 |
|
|
De facto population |
|
||
|
Total |
1,064,188 |
1,443,853 |
|
|
Male |
458,260 |
648,021 |
|
|
Female |
605,928 |
795,832 |
|
|
Sex ratio (male to female) |
|
||
|
De jure |
0.93 |
0.93 |
|
|
De facto |
0.76 |
0.81 |
|
|
Absentees |
|
||
|
Total |
152,627 |
133,683 |
|
|
Male |
129,088 |
112,451 |
|
|
Female |
23,539 |
21,232 |
|
|
Percentage of total de jure population |
12.5 |
8.5 |
|
|
Intercensal growth rate |
|
||
|
De jure |
|
2.6 |
|
|
De facto |
3.1 |
||
|
SOURCE: Data from Lesotho (1987). |
|||
TABLE 8–19 Mauritania Population: 1977 Census
|
|
Foreign Nationals |
Mauritanians |
Total |
||||||
|
Age |
Male |
Female |
Total |
Male |
Female |
Total |
Male |
Female |
Total |
|
Number |
|
||||||||
|
0–14 |
4,440 |
4,592 |
9,032 |
300,797 |
278,909 |
579,706 |
305,237 |
283,501 |
588,738 |
|
15–59 |
11,642 |
6,745 |
18,387 |
307,481 |
346,015 |
653,496 |
319,123 |
352,760 |
671,883 |
|
60+ |
406 |
343 |
749 |
33,553 |
43,907 |
77,460 |
33,959 |
44,250 |
78,209 |
|
All ages |
16,488 |
11,680 |
28,168 |
641,831 |
668,831 |
1,310,662 |
658,319 |
680,511 |
1,338,830 |
|
Percentage |
|
||||||||
|
0–14 |
15.8 |
16.3 |
32.1 |
23.0 |
21.3 |
44.2 |
22.8 |
21.2 |
44.0 |
|
15–59 |
41.3 |
23.9 |
65.3 |
23.5 |
26.4 |
49.9 |
23.8 |
26.3 |
50.2 |
|
60+ |
1.4 |
1.2 |
2.7 |
2.6 |
3.4 |
5.9 |
2.5 |
3.3 |
5.8 |
|
All ages |
58.5 |
41.5 |
100.0 |
49.0 |
51.0 |
100.0 |
49.2 |
50.8 |
100.0 |
|
Dependency ratioa |
|
53.2 |
|
100.6 |
|
99.3 |
|||
|
Sex ratio (male to female) |
|
|
|
||||||
|
0–14 |
0.97 |
1.08 |
1.08 |
||||||
|
15–59 |
1.73 |
0.89 |
0.90 |
||||||
|
60+ |
1.18 |
0.76 |
0.77 |
||||||
|
All ages |
1.41 |
0.96 |
0.97 |
||||||
|
aCalculated using 0–14 and 60+ as dependent age groups. SOURCE: Data from République Islamique de Mauritanie (no date). |
|||||||||
TABLE 8–20 Malawi Population: 1977 Census
|
|
Foreign Born |
Malawian |
Total |
||||||
|
Age |
Male |
Female |
Total |
Male |
Female |
Total |
Male |
Female |
Total |
|
Number |
|
||||||||
|
0–9 |
13,635 |
13,928 |
27,562 |
925,587 |
955,477 |
1,881,063 |
939,221 |
969,404 |
1,908,626 |
|
10–19 |
27,242 |
26,461 |
53,702 |
528,545 |
531,002 |
1,059,547 |
555,786 |
557,463 |
1,113,249 |
|
20–29 |
23,184 |
27,410 |
50,594 |
376,265 |
460,438 |
836,703 |
399,449 |
487,848 |
887,297 |
|
30–39 |
17,075 |
19,519 |
36,595 |
260,218 |
286,888 |
547,107 |
277,293 |
306,408 |
583,701 |
|
40–49 |
15,222 |
17,725 |
32,946 |
185,219 |
204,881 |
390,100 |
200,440 |
222,606 |
423,046 |
|
50–59 |
13,803 |
15,159 |
28,962 |
116,807 |
132,955 |
249,762 |
130,610 |
148,113 |
278,724 |
|
60+ |
30,261 |
28,122 |
58,383 |
141,131 |
152,844 |
293,975 |
171,392 |
180,966 |
352,357 |
|
All ages |
140,421 |
148,323 |
288,744 |
2,533,771 |
2,724,485 |
5,258,256 |
2,674,192 |
2,872,808 |
5,547,000 |
|
Percentage |
|
||||||||
|
0–9 |
9.7 |
9.4 |
9.5 |
36.5 |
35.1 |
35.8 |
35.1 |
33.7 |
34.4 |
|
10–19 |
19.4 |
17.8 |
18.6 |
20.9 |
19.5 |
20.2 |
20.8 |
19.4 |
20.1 |
|
20–29 |
16.5 |
18.5 |
17.5 |
14.9 |
16.9 |
15.9 |
14.9 |
17.0 |
16.0 |
|
30–39 |
12.2 |
13.2 |
12.7 |
10.3 |
10.5 |
10.4 |
10.4 |
10.7 |
10.5 |
|
40–49 |
10.8 |
12.0 |
11.4 |
7.3 |
7.5 |
7.4 |
7.5 |
7.7 |
7.6 |
|
50–59 |
9.8 |
10.2 |
10.0 |
4.6 |
4.9 |
4.7 |
4.9 |
5.2 |
5.0 |
|
60+ |
21.6 |
19.0 |
20.2 |
5.6 |
5.6 |
5.6 |
6.4 |
6.3 |
6.4 |
|
All ages |
100.0 |
100.0 |
100.0 |
100.0 |
100.0 |
100.0 |
100.0 |
100.0 |
100.0 |
|
|
Foreign Born |
Malawian |
Total |
||||||
|
Age |
Male |
Female |
Total |
Male |
Female |
Total |
Male |
Female |
Total |
|
Dependency ratioa |
|
42.4 |
|
70.5 |
|
68.8 |
|||
|
Sex ratio (male to female) |
|
|
|
||||||
|
0–9 |
0.98 |
0.97 |
0.97 |
||||||
|
10–19 |
1.03 |
1.00 |
1.00 |
||||||
|
20–29 |
0.85 |
0.82 |
0.82 |
||||||
|
30–39 |
0.87 |
0.91 |
0.90 |
||||||
|
40–49 |
0.86 |
0.90 |
0.90 |
||||||
|
50–59 |
0.91 |
0.88 |
0.88 |
||||||
|
60+ |
1.08 |
0.92 |
0.95 |
||||||
|
All ages |
0.95 |
0.93 |
0.93 |
||||||
|
aCalculated using 0–9 and 60+ as dependent age group. SOURCE: Data from Malawi (1984). |
|||||||||
TABLE 8–21 Congo 1984 Census Results
|
|
Foreign Born |
Congolese |
Total de Jure Population |
||||||
|
Age |
Male |
Female |
Total |
Male |
Female |
Total |
Male |
Female |
Total |
|
Number |
|
||||||||
|
0–9 |
10,279 |
10,646 |
20,925 |
294,671 |
292,358 |
587,029 |
304,950 |
303,004 |
607,954 |
|
10–19 |
5,615 |
7,265 |
12,880 |
219,249 |
224,341 |
443,590 |
224,864 |
231,606 |
456,470 |
|
20–29 |
13,031 |
13,379 |
26,410 |
136,757 |
145,582 |
282,339 |
149,788 |
158,961 |
308,749 |
|
30–39 |
8,638 |
7,302 |
15,940 |
79,776 |
89,774 |
169,550 |
88,414 |
97,076 |
185,490 |
|
40–49 |
3,965 |
3,275 |
7,240 |
61,977 |
67,420 |
129,397 |
65,942 |
70,695 |
136,637 |
|
50–59 |
2,236 |
1,708 |
3,944 |
44,480 |
55,998 |
100,478 |
46,716 |
57,706 |
104,422 |
|
60–69 |
1,062 |
839 |
1,901 |
28,701 |
37,428 |
66,129 |
29,763 |
38,267 |
68,030 |
|
70+ |
478 |
399 |
877 |
14,057 |
17,526 |
31,583 |
14,535 |
17,925 |
32,460 |
|
Undetermined |
555 |
476 |
1,031 |
3,575 |
4,430 |
8,005 |
4,130 |
4,906 |
9,036 |
|
Total |
45,859 |
45,289 |
91,148 |
883,243 |
934,857 |
1,818,100 |
929,102 |
980,146 |
1,909,248 |
|
Percentage |
|
||||||||
|
0–9 |
22.4 |
23.5 |
23.0 |
33.4 |
31.3 |
32.3 |
32.8 |
30.9 |
31.8 |
|
10–19 |
12.2 |
16.0 |
14.1 |
24.8 |
24.0 |
24.4 |
24.2 |
23.6 |
23.9 |
|
20–29 |
28.4 |
29.5 |
29.0 |
15.5 |
15.6 |
15.5 |
16.1 |
16.2 |
16.2 |
|
30–39 |
18.8 |
16.1 |
17.5 |
9.0 |
9.6 |
9.3 |
9.5 |
9.9 |
9.7 |
|
40–49 |
8.6 |
7.2 |
7.9 |
7.0 |
7.2 |
7.1 |
7.1 |
7.2 |
7.2 |
|
50–59 |
4.9 |
3.8 |
4.3 |
5.0 |
6.0 |
5.5 |
5.0 |
5.9 |
5.5 |
|
60–69 |
2.3 |
1.9 |
2.1 |
3.2 |
4.0 |
3.6 |
3.2 |
3.9 |
3.6 |
|
70+ |
1.0 |
0.9 |
1.0 |
1.6 |
1.9 |
1.7 |
1.6 |
1.8 |
1.7 |
|
Undetermined |
1.2 |
1.1 |
1.1 |
0.4 |
0.5 |
0.4 |
0.4 |
0.5 |
0.5 |
|
Total |
100.0 |
100.0 |
100.0 |
100.0 |
100.0 |
100.0 |
100.0 |
100.0 |
100.0 |
|
|
Foreign Born |
Congolese |
Total de Jure Population |
||||||
|
Age |
Male |
Female |
Total |
Male |
Female |
Total |
Male |
Female |
Total |
|
Dependency ratioa |
|
35.7 |
|
60.8 |
|
59.4 |
|||
|
Sex ratio (male to female) |
|
|
|
||||||
|
0–9 |
0.97 |
1.01 |
1.01 |
||||||
|
10–19 |
0.77 |
0.98 |
0.97 |
||||||
|
20–29 |
0.97 |
0.94 |
0.94 |
||||||
|
30–39 |
1.18 |
0.89 |
0.91 |
||||||
|
40–49 |
1.21 |
0.92 |
0.93 |
||||||
|
50–59 |
1.31 |
0.79 |
0.81 |
||||||
|
60–69 |
1.27 |
0.77 |
0.78 |
||||||
|
70+ |
1.20 |
0.80 |
0.81 |
||||||
|
Undetermined |
1.17 |
0.81 |
0.84 |
||||||
|
Total |
1.01 |
0.94 |
0.95 |
||||||
|
aCalculated using 0–9 and 60 and over as dependent age groups. SOURCE: République Populaire du Congo (1984: Tables 203, 204). |
|||||||||
REFERENCES
Adegbola, O. 1990 Demographic effects of economic crisis in Nigeria: The brain drain component. Presented at the Conference on the Role of Migration in African Development Issues and Policies for the 90s, Union for African Population Studies, Nairobi. In Adepoju, ed., 1990 South-North Migration: The African Situation. International Organization for Migration (IOM), Ninth IOM Seminar on Migration, Document No. 1.1. Geneva, December 4–6.
Adepoju, A. 1988 International migration in Africa south of the Sahara. In R.T.Appleyard, ed., International Migration Today, Vol.1: Trends and Prospects. Paris: UNESCO.
1990 South-North migration: The African situation. International Organization for Migration (IOM), Ninth IOM Seminar on Migration, Document No. 1.1. Geneva, December 4–6.
Afolayan, A.A. 1988 Immigration and expulsion of ECOWAS aliens in Nigeria. International Migration Review 22(1):4–27.
Choucri, N. 1985 A study of Sudanese nationals working abroad. Unpublished manuscript, Massachusetts Institute of Technology, Cambridge, Mass.
De Vletter, F. 1985 Recent trends and prospects of black migration to South Africa. International Migration for Employment Working Paper MIG WP.20. Geneva: International Labour Office.
1988 Migrant labour squeezed. People (Southern Africa) 15(2).
Financial Mail 1987 Migrant labour: Quest for reform. (South Africa) 103:31–32.
Gould, W.T.S. 1985 International migration of skilled labour within Africa: A bibliographical review. International Migration 23(1):5–27.
Haub, C., and M.Kent 1986 1986 World Population Data Sheet. Washington, D.C.: Population Reference Bureau
Lesotho 1987 1986 Population Census Preliminary Results. Maseru: Bureau of Statistics.
Makinwa-Adebusoye, P. 1987 International migration in tropical Africa: Current trends. International Union for the Scientific Study of Population Workshop on International Migration Systems and Networks, University of Benin, Nigeria.
Malawi 1984 Malawi Population Census 1977, Analytical Report, Vol. I: Population Characteristics. Zomba: National Statistics Office.
Momsen, J.H., and J.G.Townsend 1987 Geography of Gender in the Third World. London: Hutchinson.
Orubuloye, I.O. 1988 Recent immigration of West African citizens into Nigeria. African Population Conference, sponsored by the International Union for the Scientific Study of Population, Union for African Population Studies, and Central Statistical Office, Senegal. Dakar, Senegal, November 7–12.
République Islamique de Mauritanie No date Recensement Général de la Population 1977, Résultats Prioritaires, Tome I. Nouakchott: Ministère de l’Economie et des Finances, Direction de la Statistique.
République Populaire du Congo 1984 Recensement General de la Population du Congo 1984, Tome III. Brazzaville: Ministère Délégué Auprès du Premier Ministre Charge du Plan, Centre National de la Statistique et des Etudes Economiques, Direction des Statistiques Démographiques et Sociales.
République Unie du Cameroun 1976 Recensement Général de la Population et de l’Habitat d’Avril 1976. Yaoundé: Ministère de l’Economie et du Plan, Direction de la Statistique et de la Comptabilite Nationale, Bureau Central du Recensement.
Ricca, S. 1989 International Migration in Africa: Legal and Administrative Aspects. Geneva: International Labour Office.
Russell, S.S., K.Jacobsen, and W.D.Stanley 1990 International Migration and Development in Sub-Saharan Africa, Vol. I: Overview. World Bank Discussion Papers, Africa Technical Department Series, No. 101. Washington, D.C.: The World Bank.
SOPEMI 1991 Continuous Reporting System on Migration, 1990. Paris: Organisation for Economic Co-operation and Development.
Taylor, J. 1990 The reorganization of mine labor recruitment in Southern Africa: Evidence from Botswana. International Migration Review 24(2):250–272.
United Nations 1989a World Migrant Populations: The Foreign Born. New York: United Nations Population Division.
1989b World Population Trends and Policies: 1989 Monitoring Report. New York: United Nations Population Division.
United Nations Economic Commission for Africa 1988 An Enabling Environment to Retain Africa’s High-Level Manpower. International Conference on the Human Dimension of Africa’s Economic Recovery and Development, Khartoum, Sudan, March 5–8.
United Nations High Commissioner for Refugees 1979 Collection of International Instruments Concerning Refugees. HCR/IP/1/ENG. New York: UNHCR.
U.S. Committee for Refugees 1988 World Refugee Survey 1988. Washington, D.C.: American Council for Nationalities Service.
1989 World Refugee Survey 1989. Washington, D.C.: American Council for Nationalities Service.
1991 World Refugee Survey 1991. Washington, D.C.: American Council for Nationalities Service.
Widgren, J. 1987 International migration: New challenges to Europe. Report prepared for the Third Conference of European Ministers Responsible for Migration, organized by the Council of Europe. Porto, Portugal, May 13–15. Reprinted in Migration News (2), Geneva: International Catholic Migration Commission.
World Bank 1986 Population Growth and Policies on Sub-Saharan Africa. Washington, D.C.: The World Bank.
1989 Sub-Saharan Africa, From Crisis to Sustainable Growth: A Long-Term Perspective Study. Washington, D.C.: The World Bank.
1990 World Development Report 1990. Washington, D.C.: The World Bank.
Zachariah, K.C., and J.Condé 1981 Migration in West Africa: Demographic Aspects. New York: Oxford University Press for the World Bank.


