
2
The Nature and Problem of Obesity
The pressing need for criteria for evaluating weight-loss programs stems from the scope of the problem of obesity in this country and the evidence that it is worsening, in spite of extensive individual and programmatic efforts to achieve weight control. In its Healthy People 2000 report published in 1991, the federal government proposed that no more than 20 percent of adults in this country aged 20 and older and no more than 15 percent of adolescents aged 12 through 19 should be overweight by the turn of the twenty-first century (DHHS, 1991; see Figure 2-1). Studies over the past two decades, however, show that our country is moving farther from, rather than closer to, this goal. As shown later in this chapter, the prevalence of overweight and obesity is rising, not falling, among most population groups as characterized by gender, age, and race.
Paradoxically, at the same time as the prevalence of obesity is increasing, tens of millions of people in this country are dieting at any given time. An obese individual faces a continuous, lifelong struggle with no expectation that the struggle required will diminish with time. For most people, even a brief abatement in effort will be met with a significant setback in control. Studies in controlled settings show that individuals who complete weight-loss programs lose approximately 10 percent of their body weight, but gain two-thirds of it back within 1 year and almost all of it back within 5 years (NIH Technology Assessment Conference Panel, 1993).
Obesity is one of the most prevalent diet-related health problems in
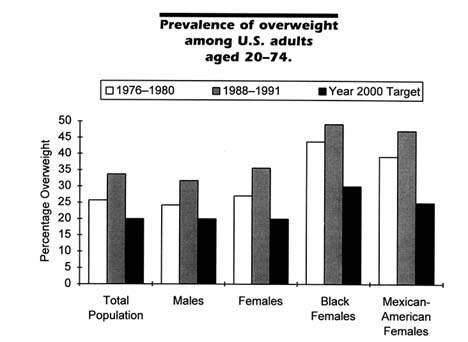
FIGURE 2-1 Data are from the National Health and Nutrition Examination Surveys (NHANES) II (1976–1980) and III (Phase 1, 1988–1991), conducted by the National Center for Health Statistics, and target goals are from Healthy People 2000 (DHHS, 1991).
the United States, increasing the population's risk for chronic diseases such as hypertension, other cardiovascular and cerebrovascular diseases, some forms of cancer, and non-insulin-dependent diabetes mellitus. Obesity is a heterogeneous disease in which genetic, environmental, psychological, and other factors are involved. It occurs when energy intake exceeds the amount of energy expended over time. Only in a small minority of cases is obesity caused by illnesses such as hypothyroidism or the result of taking medications, such as steroids, that can cause weight gain.
One remarkable feature of obesity is that its management requires a great deal of effort from the individual. Health-care providers or counselors can offer only advice and technical support at this time. In virtually every other field that involves a chronic disease, there is the expectation that drugs are required and may be effective in treating and possibly curing these diseases. While researchers expect that the development and long-term use of new drugs and combinations of drugs will help in the chronic management of obesity, few drugs are available at present. For
the relatively small number of very obese individuals, there are favorable long-term outcomes with gastric surgery (NIH, 1992). However, for the majority of obese individuals, there is currently no hope of a cure or spontaneous resolution, no expectation that the disease will stabilize, and no hope that the symptoms can be diminished. There are few diseases in which health-care providers can offer so little for those who struggle so much.
Another remarkable feature of obesity is that its victims suffer discrimination. Perhaps most lay persons, health-care providers, and even obese individuals themselves do not perceive the metabolic nature of the disease and thus view obesity as a problem of willful misconduct—eating too much and exercising too little (Stunkard and Sørensen, 1993). For example, a survey by Price et al. (1987) found that two-thirds of 318 responding family practice physicians believed their obese patients to lack self-control; 39 percent described them as "lazy," and 34 percent characterized them as "sad." Another study found third-year medical students to perceive very obese individuals as "unpleasant, worthless, and bad," even after direct contact with them in a psychiatry rotation over 8 weeks (Blumberg and Mellis, 1985). We believe strongly that it is important for the lay public and health-care providers alike to change the common misperception that the obese are largely responsible for their disorder and deserve to be discriminated against if they do not reduce to a more socially desirable weight.
In this chapter, we provide an overview of the problem of overweight and obesity in the United States, its incidence and prevalence, and the weight-loss practices of individuals. We then review current findings about the specific benefits of weight loss and summarize the tremendous personal and societal costs of obesity.
OBESITY IN THE UNITED STATES
There is a surprising amount of variation in the terminology used to describe excess weight and in the definition of these terms (see box titled "Obesity and Its Measurement"). This variation leads to difficulties in estimating precisely the extent of these disorders and in trying to compare the results of different studies. Not only are the terms overweight and obesity often used interchangeably, there is considerable disagreement concerning how to identify those at increased risk from excess weight (Kuczmarski, 1992).
The problems involved in defining obesity are similar to those encountered in defining physical activity, hypertension, and hypercholesterolemia, in which continuous variables such as weight, blood pressure, energy expenditure, and blood cholesterol concentration are categorized
into distinct risk groups. While there is a general increase in risk as the measure increases, categorizing these variables assumes that, at one or more points on the distribution, risk increases substantially.
There are two ways to identify the points of increased risk. First, empirical examination of the relationship between the risk factor and the health outcome can identify the appropriate cutoff points. Alternatively, it is possible to base the cutoff on the distribution of the risk factor itself and to identify those at the upper end of the distribution as being in the high-risk category.
|
OBESITY AND ITS MEASUREMENT Overweight and obesity are terms that have distinct though related meanings and are often used interchangeably. Overweight refers to an excess amount of total body weight that includes all tissues (e.g., fat, bone, and muscle) and water. Obesity refers specifically to an excess of body fat. It is possible to be overweight without being obese, as might be the case with a body builder who gains a substantial amount of muscle mass. It is also possible, though not as common, to be obese without being overweight, a situation that might affect sedentary "couch potatoes" and some elderly persons. For practical purposes, however, most overweight people are also obese. Obesity can be measured by several methods, such as weighing a person underwater, measuring skinfold thickness in several parts of the body, scanning by dual-energy X-ray absorptiometry (DEXA), and using bioelectric impedance analysis (which involves sending a very small amount of electric current through the body) and total body electrical conductivity (TOBEC) analysis (based on an interaction between the body and a varying magnetic field). Because some of these tests require sophisticated equipment and experienced, trained personnel, they are not practical in most settings. When total body fat is used as an index, men with more than 25 percent and women with more than 30 percent body fat are considered to be obese (NIDDK, 1993b). The most common and easily determined indirect techniques for assessing obesity are the body mass index (BMI) and weight-for-height tables. In this report, we will use the term obesity consistently in referring to the condition of excess body weight. The body mass index (BMI) is a mathematical formula correlated highly with body fat, It is the measurement of choice used by health-care providers and investigators studying obesity. BMI is expressed as weight in kilograms divided by height in meters squared (BMI = kg/m 2). Table 2-1 presents BMI values on the basis of the more familiar height in inches and weight in pounds. NOTE TO TABLE 2-1: Body mass index, originally referred to as the Quetelet Index (QI), is weight in kilograms divided by height in meters squared. Each entry gives the body weight in pounds for a person of a given height and body mass index. Pounds have been rounded off. To use the table, find the appropriate height in the left-hand column. Move across the row to a given weight. The number at the top of the column is the body mass index for that weight and height. |
TABLE 2-1 Body Weight (in pounds) According to Height (in inches) and Body Mass Index
|
|
|
|
|
|
|
|
Body Mass Index |
|||||||||
|
|
19 |
20 |
21 |
22 |
23 |
24 |
25 |
26 |
27 |
28 |
29 |
30 |
31 |
32 |
33 |
34 |
|
Height |
Body Weight |
|||||||||||||||
|
58 |
91 |
95 |
100 |
105 |
110 |
114 |
119 |
124 |
129 |
133 |
138 |
143 |
148 |
152 |
157 |
162 |
|
59 |
94 |
99 |
104 |
109 |
114 |
119 |
124 |
129 |
134 |
139 |
144 |
149 |
154 |
159 |
164 |
169 |
|
60 |
97 |
102 |
107 |
112 |
117 |
122 |
127 |
132 |
138 |
143 |
148 |
153 |
158 |
163 |
168 |
173 |
|
61 |
101 |
106 |
111 |
117 |
122 |
127 |
132 |
138 |
143 |
148 |
154 |
159 |
164 |
169 |
175 |
180 |
|
62 |
103 |
109 |
114 |
120 |
125 |
130 |
136 |
141 |
147 |
152 |
158 |
163 |
168 |
174 |
179 |
185 |
|
63 |
107 |
113 |
119 |
124 |
130 |
135 |
141 |
147 |
152 |
158 |
164 |
169 |
175 |
181 |
186 |
192 |
|
64 |
111 |
117 |
123 |
129 |
135 |
141 |
146 |
152 |
158 |
164 |
170 |
176 |
182 |
187 |
193 |
199 |
|
65 |
114 |
120 |
126 |
132 |
138 |
144 |
150 |
156 |
162 |
168 |
174 |
180 |
186 |
192 |
198 |
204 |
|
66 |
118 |
124 |
131 |
137 |
143 |
149 |
156 |
162 |
168 |
174 |
180 |
187 |
193 |
199 |
205 |
212 |
|
67 |
121 |
127 |
134 |
140 |
147 |
153 |
159 |
166 |
172 |
178 |
185 |
191 |
198 |
204 |
210 |
217 |
|
68 |
125 |
132 |
139 |
145 |
152 |
158 |
165 |
172 |
178 |
185 |
191 |
198 |
205 |
211 |
218 |
224 |
|
69 |
128 |
135 |
142 |
149 |
155 |
162 |
169 |
176 |
182 |
189 |
196 |
203 |
209 |
216 |
223 |
230 |
|
70 |
133 |
140 |
147 |
154 |
161 |
168 |
175 |
182 |
189 |
196 |
203 |
210 |
217 |
224 |
231 |
237 |
|
71 |
136 |
143 |
150 |
157 |
164 |
171 |
179 |
186 |
193 |
200 |
207 |
214 |
221 |
229 |
236 |
243 |
|
72 |
140 |
148 |
155 |
162 |
170 |
177 |
185 |
192 |
199 |
207 |
214 |
221 |
229 |
236 |
244 |
251 |
|
73 |
143 |
151 |
158 |
166 |
174 |
181 |
189 |
196 |
204 |
211 |
219 |
226 |
234 |
241 |
249 |
257 |
|
74 |
148 |
156 |
164 |
171 |
179 |
187 |
195 |
203 |
210 |
218 |
226 |
234 |
242 |
249 |
257 |
265 |
|
75 |
151 |
159 |
167 |
175 |
183 |
191 |
199 |
207 |
215 |
223 |
231 |
239 |
247 |
255 |
263 |
271 |
|
76 |
156 |
164 |
172 |
181 |
189 |
197 |
205 |
214 |
222 |
230 |
238 |
246 |
255 |
263 |
271 |
279 |
|
|
|
|
|
|
|
|
Body Mass Index |
|||||||||
|
|
35 |
36 |
37 |
38 |
39 |
40 |
41 |
42 |
43 |
44 |
45 |
46 |
47 |
48 |
49 |
50 |
|
Height |
Body Weight |
|||||||||||||||
|
58 |
167 |
172 |
176 |
181 |
186 |
191 |
195 |
200 |
205 |
210 |
214 |
219 |
224 |
229 |
233 |
238 |
|
59 |
174 |
179 |
184 |
188 |
193 |
198 |
203 |
208 |
213 |
218 |
223 |
228 |
233 |
238 |
243 |
248 |
|
60 |
178 |
183 |
188 |
194 |
199 |
204 |
209 |
214 |
219 |
224 |
229 |
234 |
239 |
244 |
250 |
255 |
|
61 |
185 |
191 |
196 |
201 |
207 |
212 |
217 |
222 |
228 |
233 |
238 |
244 |
249 |
254 |
260 |
265 |
|
62 |
190 |
196 |
201 |
206 |
212 |
217 |
223 |
228 |
234 |
239 |
245 |
250 |
255 |
261 |
266 |
272 |
|
63 |
198 |
203 |
209 |
214 |
220 |
226 |
231 |
237 |
243 |
248 |
254 |
260 |
265 |
271 |
277 |
282 |
|
64 |
205 |
211 |
217 |
223 |
228 |
234 |
240 |
246 |
252 |
258 |
264 |
269 |
275 |
281 |
287 |
293 |
|
65 |
210 |
216 |
222 |
228 |
234 |
240 |
246 |
252 |
258 |
264 |
270 |
276 |
282 |
288 |
294 |
300 |
|
66 |
218 |
224 |
230 |
236 |
243 |
249 |
255 |
261 |
268 |
274 |
280 |
286 |
292 |
299 |
305 |
311 |
|
67 |
223 |
229 |
236 |
242 |
248 |
255 |
261 |
268 |
274 |
280 |
287 |
293 |
299 |
306 |
312 |
319 |
|
68 |
231 |
238 |
244 |
251 |
257 |
264 |
271 |
277 |
284 |
290 |
297 |
304 |
310 |
317 |
323 |
330 |
|
69 |
236 |
243 |
250 |
257 |
263 |
270 |
277 |
284 |
290 |
297 |
304 |
311 |
317 |
324 |
331 |
338 |
|
70 |
244 |
251 |
258 |
265 |
272 |
279 |
286 |
293 |
300 |
307 |
314 |
321 |
328 |
335 |
342 |
349 |
|
71 |
250 |
257 |
264 |
271 |
279 |
286 |
293 |
300 |
307 |
314 |
321 |
329 |
336 |
343 |
350 |
357 |
|
72 |
258 |
266 |
273 |
281 |
288 |
295 |
303 |
313 |
317 |
325 |
332 |
340 |
347 |
354 |
362 |
369 |
|
73 |
264 |
272 |
279 |
287 |
294 |
302 |
309 |
317 |
324 |
332 |
340 |
347 |
355 |
362 |
370 |
377 |
|
74 |
273 |
281 |
288 |
296 |
304 |
312 |
319 |
327 |
335 |
343 |
351 |
358 |
366 |
374 |
382 |
390 |
|
75 |
279 |
287 |
294 |
302 |
310 |
318 |
326 |
334 |
342 |
350 |
358 |
366 |
374 |
382 |
390 |
398 |
|
76 |
287 |
296 |
304 |
312 |
320 |
328 |
337 |
345 |
353 |
361 |
370 |
378 |
386 |
394 |
402 |
411 |
|
SOURCE: Adapted and expanded from NIDDK, 1993b. |
||||||||||||||||
Both methods have been used to assess obesity. Weight-for-height tables are examples of the empirical approach. Based on these tables, the suggested weight for an adult 35 years or older at a height of 5 feet, 7 inches in 134 to 172 pounds. Such a person weighing more than the cutoff point of 172 pounds would be considered to have exceeded a desirable or healthy weight. While cutpoints are useful because they are conceptually easy to understand, they present some methodological problems. Inconsistencies in the results obtained from different empirical studies make it difficult to identify a single cutpoint representing excess risk. These inconsistencies can result from differences across studies in the definition of endpoints, the duration of follow-up, and the inclusion of other covariates (e.g., how fat is distributed on the body or whether obesity is associated with other chronic diseases). Cutpoints derived from empirical studies will also tend to change over time as the science on which they are based advances.
An alternative approach to establishing points of increased risk is used by the National Center for Health Statistics (NCHS), which identifies two categories of excess weight: overweight and severe overweight. The term obesity is not used. Given that weight generally increases with age and that this weight gain represents a potential health risk, NCHS uses the extremes of the distribution of BMI for young adults (aged 20–29 years) to identify those at most risk of being overweight. Data from the Second National Health and Nutrition Examination Survey (NHANES II) conducted during 1976–1980 are used to identify the cutpoints. The cutpoints for overweight and severe overweight correspond to the sex-specific 85th and 95th percentiles of BMI, respectively (27.8 and 31.1 for males; 27.3 and 32.3 for females), in the 1976–1980 survey. Of course, BMI distributions in other populations or in other years could result in different cutpoints if populations differ in how BMI is distributed, as is usually the case, or if there is a change over time in the weight of a population. NCHS uses these cutpoints from NHANES II as the reference against which to compare results from its other surveys. Although the NCHS cutpoints are based on the observed distribution of BMI, these cutpoints are closely related to those derived from studies of the relationship between BMI and health outcomes. They are comparable to a body weight 20 and 40 percent, respectively, above the so-called ideal body weight derived from the popular weight-for-height tables issued by Metropolitan Life Insurance Company in 1983.
The meaning of the term healthy weight as well as how best to measure it remains the subject of scientific debate. Research on identifying optimal weights continues (see, for example, AIN, 1994; Hammond and Garfinkel, 1969; Lew and Garfinkel, 1979; Lindsted et al., 1991; Society of Actuaries, 1980; Sorkin et al., in press; Waaler, 1984) and should be encouraged.
However, given the complexity of the relationships between weight and health outcomes, it may only be possible to develop general guidelines as to what constitute healthy weights. Care must be taken in applying weight standards to individuals, and it may not be possible to set weight goals for particular individuals by using a single table or set of cutpoints.
|
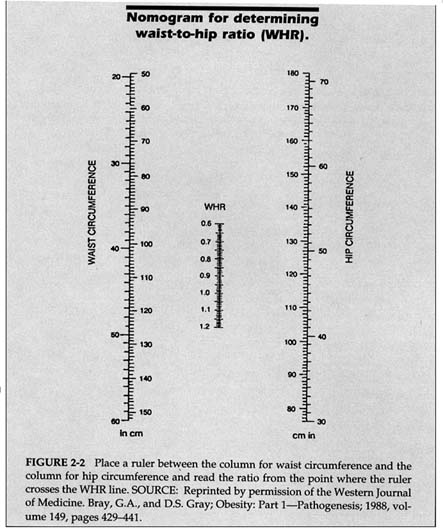
THE CLASSIFICATION OF OBESITY What is a ''healthy" or "unhealthy" weight? There is no sure answer to this question. The National Institutes of Health (NIH) National Task Force on Prevention and Treatment of Obesity stated that, in general, individuals are obese if their BMI is 25 or more through age 34 and 27 or more beyond age 34 (NIDDK, 1993b). Obesity is also assessed by using weight-for-height tables. Some of the most widely used tables come from the life insurance industry, which has height, weight, and mortality data on some 5 million individuals who have chosen to obtain life insurance policies. The 1959 and 1983 Metropolitan Life Insurance Company tables of desirable weight are still among the most popular in use. In 1990, the federal government issued a table of suggested weights for adults based on height and age. Table 2-2 provides a generous range of "healthy" weights for a given height. For individuals 19-34 years of age, the BMI range given is 19 to 25; for those age 35 and older, the BMI range is 21 to 27. These figures suggest that it is acceptable for weight to increase with age (see also Andres et al., 1993), though there is disagreement about this point (see, for example, Willett et al., 1991, and Bray, 1993a). One criticism of the NIH and federal government guidelines is that they imply that it is acceptable to gain some 10–20 pounds after age 34; critics argue that individuals who gain small amounts of weight over time should learn better lifestyle habits that might eliminate or minimize weight gain. As the scientific discourse about this matter continues, we have adopted the recommendations of the NIH National Task Force. We will often use the term comorbidity in this report to refer to the concomitant pathologic processes and diseases associated with obesity. Comorbidities linked to obesity include coronary heart disease, stroke, hypertension, obstructive sleep apnea, diabetes mellitus, gout, dyslipidemia, osteoarthritis of weight-bearing joints (such as the knees and hips), gallstones and cholecystitis, reduced fertility, reduced physical agility and increased risk of accidents, and impaired obstetrical performance (IFT, 1994; Pi-Sunyer, 1993a). Some of these health risks of obesity are more likely to occur when fat is concentrated in the abdominal or visceral area rather than the gluteal area. A measurement called the waist-to-hip ratio (WHR) is used clinically to assess whether weight is collected primarily in the hips and buttocks (producing what is known |
|
as a "pear" shape, common in females) or in the abdomen (an "apple" shape, common in males). the WHR is determined by measuring the waist with a non-stretchable tape measure at its smallest point (between the rib cage and navel) and the hips at their widest point (around the buttocks). (See Figure 2-2 to calculate WHR.) A WHR of more than 1.0 in males and 0.8 in females suggests a weight distribution that poses increased risks to health compared to the excess weight alone. Abdominal diameter in the saggital plane is a marginally better measure than WHR, and scanning techniques (such as dual-energy x-ray absorptiometry) are even more accurate in evaluating abdominal obesity. TABLE 2-2 Suggested Weights for Adults
|
||||||||||||||||||||||||||||||||||||||||||||||||||||||||||||||||||
INCIDENCE AND PREVALENCE
The most recent data on the prevalence of obesity in the United States come from the Third National Health and Nutrition Examination Survey (NHANES III) conducted by NCHS. Although the survey will not be completed until the end of 1994, information on BMI from the first 3 years of data collection (Phase 1, 1988–1991) has been reported (Kuczmarski et al., 1994). If NCHS's BMI cutpoints are used, 33 percent
of the U.S. population aged 20 and over is overweight, and 14 percent is severely overweight. We believe that this large prevalence of obesity qualifies as an epidemic, using the common definition of this term—affecting many individuals in a population.
The prevalence of overweight varies considerably by age, gender, race, and socioeconomic status (SES). Data from 1988 to 1991 show that among those 20 years of age and over, the percent overweight increases with age, with the highest rates occurring in the 60–69-year-old group among males (42.2 percent overweight) and the 50–59-year-old group among females (52.0 percent). Based on age-adjusted data from this time period, 31.6 percent of white, non-Hispanic males and 32.1 percent of white, non-Hispanic females were overweight, as were 31.2 percent of black, non-Hispanic males; 48.5 percent of black, non-Hispanic females; 39.1 percent of Mexican-American males; and 47.2 percent of Mexican-American females (Kuczmarski et al., 1994). There is also great variability in percent overweight by SES. When educational attainment is used as an indicator of SES, 39 percent of those with less than a high-school education were overweight, compared to 36 percent of those with a high-school degree and 29 percent of those with some college education. These SES differentials hold for both genders (unpublished data from NHANES III, Phase 1, 1988–1991, provided by NCHS).
There also has been a dramatic increase in the prevalence of overweight over time, as shown from surveys conducted by NCHS. Because of differences in population coverage across the surveys, comparisons here are limited to those 20–74 years of age. Compared to the 33.3 percent of the population considered overweight in 1988–1991, only 24.4 percent was so defined in 1960–1962. This increase occurred among males and females and among blacks and whites (NCHS, 1994). Figures 2-3 and 2-4 show the increase in the prevalence of overweight over time among females and males, respectively, at various ages. The proportion overweight is highest in the 1988–1991 period in all age groups for both males and females; proportions overweight were relatively similar for the two earlier periods (1971–1974 and 1976–1980). For males, the greatest differential over time occurs in the older age groups, whereas for females the differential is smallest among those aged 65–74. It is clear that the U.S. population is rapidly moving further away from the government's public health goal that no more than 20 percent of adults be overweight by the turn of the century (see Figure 2-1).
Changes in prevalence of obesity over time can occur in many ways. For example, there could be a general shift to the right in the distribution of BMI, indicating that the total population is getting heavier, or there could be a more limited movement from the categories just below overweight into the overweight group. An examination of the total BMI distribution
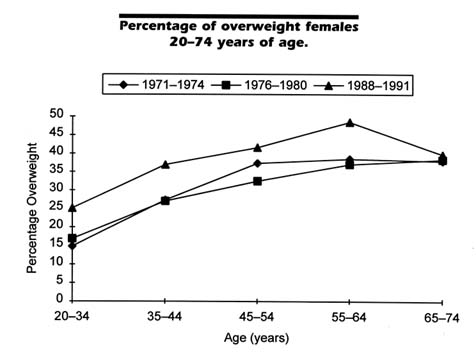
FIGURE 2-3 Data are from NHANES I (1971–1974), II (1976–1980), and III (during 1988–1991), conducted by NCHS. Overweight individuals are those at or above the 85th percentile for persons 20–29 years, age and gender specific, in NHANES II.
reveals that the former has taken place. There has been a decrease in the proportion of the population at healthier weights (e.g., BMI <25 was 57.2 percent in 1960–1962, 54.2 percent in 1971–1974, 54.4 percent in 1976–1980, and 48.1 percent in 1988–1991) and a general increase in the group at risk for weight-related problems (see Figure 2-5). The change in the BMI distribution can also reflect changes in the distribution of other behaviors. For example, smoking is highly related to weight and weight gain, and there has been a general decline in the proportion of the U.S. population that smokes (NCHS, 1994). However, adjusting for the effects of changes in smoking prevalence does not account for the increase in the proportion overweight from 1976–1980 to 1988–1991 (unpublished data from NHANES III, Phase 1, 1988–1991, provided by NCHS).
Cross-sectional data give valuable information on the status of the U.S. population at a given point in time, but longitudinal data are needed
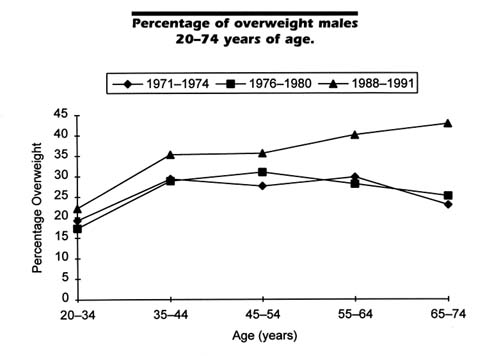
FIGURE 2-4 Data are from NHANES I (1971–1974), II (1976–1980), and III (during 1988–1991), conducted by NCHS. Overweight individuals are those at or above the 85th percentile for persons 20–29 years, age and gender specific, in NHANES II.
to describe weight change patterns adequately. Williamson et al. (1990) analyzed data from a national sample in which subjects were weighed at two points 10 years apart. Among those 25–74 years old at the initiation of the study, the incidence of major weight gain (defined as an increase in BMI by 5 or more points) was highest in those 25–34 years old and then decreased with age. This pattern holds for both men and women, but the incidence of major weight gain was approximately twice as high among women within all age groups. The magnitude of gain decreased with increasing age until age 55, after which both men and women lost weight over the 10-year period. Among the nonover weight group, men and women 35–44 years old were most likely to become overweight, with the incidence of overweight decreasing with increasing age. Compared to white females, black women 35–44 years old gained more weight on average, were more likely to have experienced a major weight gain, and were more likely to become overweight (Williamson et al., 1990).
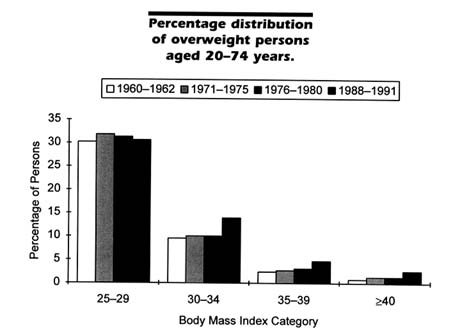
FIGURE 2-5 The change in distribution of individuals with a BMI <25 was 57.2 percent in 1960–1962, 54.2 percent in 1971–1974, 54.4 percent in 1976–1980, and 48.1 percent in 1988–1991. Data are from NHES (National Health Examination Survey, Cycle 1, 1960–1962) and NHANES I (1971–1974), II (1976–1980), and III (Phase 1, 1988–1991), conducted by NCHS.
Figure 2-6 provides a schematic illustration of the problem of obesity in this country. While the prevalence of obesity is of epidemic proportions, the gradation indicates that most individuals are not obese, most obese persons are not severely so, and even some severely obese individuals may not have obesity-related comorbidities. An individual at any given BMI is at increased risk when one or more comorbidities are present or family history is positive for these comorbidities (see Figure 2-7). Prevention of obesity, of weight regain after loss, and of further weight gain is discussed in detail in Chapters 7 and 9.
While obesity has been increasing in the U.S. population as a whole and among major demographic subgroups, relevant comorbidities have not shown the same trend. Data from Phase I of NHANES III indicate that the prevalence of hypertension has declined over the past two decades. For example, 38.3 percent of the U.S. population aged 20–74 years (age adjusted) either had elevated blood pressure or were taking antihypertensive medication in 1971–1974. In 1988–1991, the hypertension
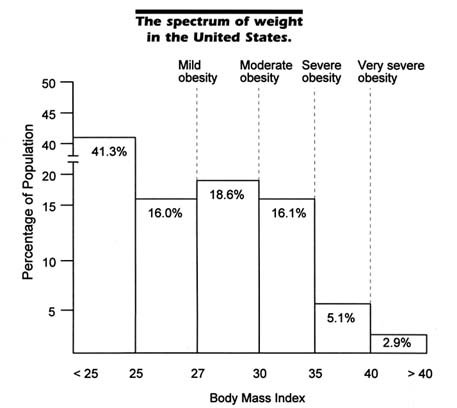
FIGURE 2-6 The various descriptors of the degree of obesity apply to individuals aged 35 and older and are associated with particular BMIs (mild obesity at a BMI of approximately 27, moderate obesity at 30, severe obesity at 35, and very severe obesity at approximately 40 or more). Approximately 41.3 percent of the population has a BMI of <25. Obesity may or may not be associated with one or more comorbidities except at the stage of severe obesity and beyond, when at least one comorbidity is almost always present. Younger adults are more likely to have no comorbidities (except for psychosocial ones) associated with their obesity. However, obese persons are at increased risk for developing comorbidities, especially over time as they get older.
prevalence declined to 23.4 percent. This decline was evident among both men and women, in all age groups, among non-Hispanic whites and African-Americans, but not among Mexican-Americans (NCHS, 1994). A similar trend has been found for blood cholesterol concentrations. In 1971–1974, 27.2 percent of the U.S. population 20-74 years of age (age adjusted) had cholesterol concentrations ≥ 240 mg/dl, decreasing to 19.7
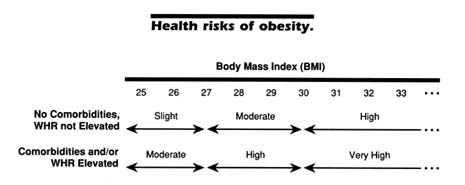
FIGURE 2-7 The risks are increased when adipose tissue is concentrated in the abdominal or visceral region (which is clinically assessed by calculating the waist-to-hip ratio [>1.0 for males and >0.8 for females]) and the presence of comorbidities such as high blood pressure (>140/90), lipid concentrations (cholesterol >200 mg/dl; triglycerides >225 mg/dl), non-insulin-dependent diabetes mellitus, osteoarthritis, sleep apnea, and premature death in the family from coronary heart disease. This figure presents general guidelines; each obese person requires individual evaluation.
percent in 1988–1991. As with hypertension, only Mexican-Americans did not share in this decline (NCHS, 1994).
The question naturally arises as to why the prevalence of obesity has increased substantially over the last several decades. Unfortunately there is no satisfactory answer at the present time since the underlying causes of this imbalance between energy intake and expenditure are still largely unknown. It is undoubtedly true that obesity is a complex, multifactorial disease of appetite regulation and energy metabolism involving the disciplines of genetics, physiology, biochemistry, and neuroscience as well as environmental, psychosocial, and cultural factors.
One explanation often advanced for the increased prevalence of obesity is that obesity is a disease of affluence. Dr. Bernadine Healy, a former director of the National Institutes of Health, made the point as follows: "One might say that overweight has been the deadly undertow of our nation's rising tide of prosperity in the 20th century" (Healy, 1993). The paradox is that it is the poor and disadvantaged in affluent, westernized countries who suffer disproportionately from obesity; the affluent themselves are usually much less affected.
For most people in the United States and in other westernized countries, the food supply is plentiful and savory, many people eat more than they need, and one can generally live well without being physically active. Our diet is relatively high in fat and calories and low in fiber-rich plant products. National surveys show that total energy and fat intakes
in this country are increasing (Lenfant and Ernst, 1994) and that no more than one in five adults can be considered to be vigorously physically active (DHHS, 1991). What is also clear, however, is that obesity involves defects in fundamental biological processes that are genetic in nature (Bouchard and Pérusse, 1993b). This is shown by many animal studies, by the well-known observation that obesity runs in families, and from both twin and adoption studies (Meyer and Stunkard, 1993).
It is sometimes suggested that the generally poor results of efforts to prevent obesity may be the result of the powerful influence of genetic factors (Bouchard, 1994). It is true that estimates of genetic influences on human obesity, based on twin studies, yielded very high estimates of heritability (Meyer and Stunkard, 1993). More recent adoption and segregation analyses, however, have agreed on a more modest estimate of heritability, on the order of 33 percent (Vogler et al., in press). Although it is clear that genetics has a modest influence on obesity on a population basis, by far the largest amount of the variance in body weight is due to environmental influences. Fortunately, the environment can be changed, but the results of efforts at preventing obesity to date suggest that we have not been very successful in changing it (see Chapter 9).
Genetic influences largely determine whether a person can become obese, with environmental influences determining whether and to what extent he or she does become obese (Meyer and Stunkard, 1993). While research continues to identify the fundamental biological defects that underlie obesity and how to manage and ultimately repair them, we must at the same time endeavor to improve the success of obesity treatments available now. This report is directed to the latter purpose. It may well turn out, however, that the best way to substantially decrease the prevalence of obesity in affluent countries in the long run will be through a better understanding of biomedicine in the future.
WEIGHT-LOSS PRACTICES
Many people in the United States desire to lose weight; their reasons include improving their appearance, increasing self-esteem, feeling better, reducing the risks of disease, and reducing the severity of medical problems and diseases that already exist. Of course, depending on the choice of the weight-loss approach and the number of pounds one wants to lose, the effort can be appropriate or inappropriate and improve health or make it worse. The National Health Interview Survey conducted by NCHS in 1990 concluded that approximately 44 million persons 25 years and older (23.3 percent of men and 40.1 percent of women) were trying to lose weight by eating less, increasing their physical activity, or both (Horm and Anderson, 1993). In fact, the actual figure is higher, since
these estimates excluded persons who were told to lose weight by their physicians.
Since 1985, the proportion trying to lose weight by increasing physical activity has increased, while those trying to lose weight by eating less has remained constant (Horm and Anderson, 1993). Commercial weight-loss centers report that, over the course of a year, people are most likely to join their programs in January (just after the festive season) and May (shortly before the summer bathing-suit season) (personal communication with Barbara J. Moore, Ph.D., Special Expert, Division of Nutrition Research Coordination, National Institutes of Health).
In the NCHS survey, approximately 45 percent of the population considered themselves to be overweight; of this group, 58.6 percent were trying to lose weight. However, 4.0 percent of those who considered themselves to be underweight and 11.4 percent of those who thought their weight was about right were also trying to lose weight. Of particular concern, the proportion of those considering themselves to be underweight yet trying to lose weight increased from 0.7 to 4.0 percent between 1985 and 1990 (Horm and Anderson, 1993). There is a segment of normal-weight or slightly overweight women in this country who are obsessed with dieting and weight loss (Horm and Anderson, 1993). Sociocultural factors, which change over time, are driving the current emphasis on thinness in this and many other affluent countries, particularly among females, and affect the weight-related attitudes of all (Rodin, 1993). This is not to say, however, that slightly overweight individuals who wish to reduce to improve their appearance and enhance self-esteem should be dissuaded from doing so. Some of them may be at the first stages of disease, and treatment might prevent further problems. Some may be individuals who were formerly obese and now are only somewhat overweight, struggling to sustain their weight loss. In addition, some of them may in fact be at medical risk for comorbidities, depending, for example, where on the body their excess fat tends to aggregate.
The 1992 Weight Loss Practices Survey sponsored by the U.S. Food and Drug Administration and the National Heart, Lung, and Blood Institute found that 13 percent of adult males and 15 percent of adult females trying to lose weight were using commercial meal replacements (Levy and Heaton, 1993). Of these, 7 and 14 percent, respectively, were using over-the-counter and prescription weight-loss pills, and 5 and 13 percent, respectively, were in organized weight-loss programs. Approximately 40 percent of the sample said they had checked with their doctor before trying to lose weight; the likelihood of checking increased with increasing BMI. Other popular weight-loss approaches include cutting down on
high-calorie and high-fat foods, using low-fat and low-calorie foods and drinks, and skipping meals (CCC, 1993).
BENEFITS OF WEIGHT LOSS
Obese individuals who lose even small amounts of weight are likely to improve their health in the short run by reducing their risk of comorbidities associated with obesity. The long-term benefits of weight loss are not yet well studied, although important new data are becoming available from randomized, controlled clinical trials.
Small Weight Losses Linked to Health Benefits
Small weight losses, of as little as 10 to 15 percent of initial body weight, can generally help reduce obesity-related comorbidities (e.g., hypertension, abnormal glucose tolerance, and abnormal lipid concentrations), decrease the risk of depression, and increase self-esteem. In many cases, the obese person finds that weight loss helps to resolve the symptoms of a comorbidity or slow its progression.
Diabetes
Non-insulin-dependent diabetes mellitus (NIDDM) affects approximately 10 million people in this country. Approximately 80–90 percent of them are obese (NIH, 1987). The direct costs of NIDDM in 1990 were $15.5 billion, of which $8.8 billion can be attributed to diabetes resulting from obesity (Wolf and Colditz, 1994). Individuals with NIDDM show improvements in their blood glucose levels within days of starting a weight-loss program—be it from conventional diets of 1,200–1,500 kcal/day (Doar et al., 1975; Hadden et al., 1975) or very-low-calorie diets of 300–800 kcal/day (Amatruda et al., 1988; Anderson et al., 1992; Genuth et al., 1974; Henry et al., 1986). The short-term effect of dieting in reducing blood glucose concentrations is probably a direct result of lowered energy intake. However, as weight loss is maintained, insulin sensitivity improves, as shown by lowered blood glucose concentrations and decreased concentrations of glycosylated hemoglobin (Wing et al., 1991a). Fitz et al. (1983) reported that many diabetic patients who lost an average of 9.3 kg were able to discontinue taking insulin or oral antidiabetic agents. Similarly, Kirschner et al. (1988) reported that, after a 23-kg weight loss (22 percent of initial body weight), all patients taking oral glucose-lowering agents and 87 percent of those requiring daily insulin injections were able to discontinue the medication. In addition, a 10-year follow-up
of 479 very obese patients who had gastric bypass surgery revealed that, of the 101 patients with NIDDM and 62 who had impaired glucose tolerance prior to surgery, 141 reverted to normal and only 22 continued to have problems in controlling their carbohydrate metabolism (Pories et al., 1992). Preliminary results from the Swedish Obesity Study reveal that among severely obese but healthy patients followed for 2 years, only 0.5 percent of those who underwent gastric surgery for their obesity and lost an average of 30 percent of initial weight developed NIDDM. This was in comparison to 7.8 percent in the control group who developed NIDDM (Sjöström et al., 1994a).
Recent studies in nonhuman primates with a propensity to develop obesity and NIDDM have shown that preventing obesity can delay indefinitely or prevent the development of overt NIDDM. These data are promising for the likely impact of the prevention of obesity on a large portion of NIDDM in humans (Hansen and Bodkin, 1993).
Hypertension
Hypertension is usually defined as a systolic blood pressure (SBP) ≥ 140 mm Hg, a diastolic blood pressure (DBP) ≥ 90 mm Hg, or both. High normal blood pressure is classified as an SBP of 130–139 mm Hg and a DBP of 85–89 mm Hg (JNCDETHBP, 1993). Epidemiological studies validate the association between increased body weight and hypertension (Dustan, 1983), and the experimental evidence is conclusive that hypertension improves in overweight persons who lose weight. Hypertension accounts for more physician office visits in this country than any other disorder, and antihypertensive medications are the most frequently prescribed drugs (Kanders and Blackburn, 1992). In the largest study on hypertension and weight loss, Schotte and Stunkard (1990) found that a weight loss of 10.4 kg among obese hypertensive patients not receiving antihypertensive medication reduced their blood pressure by 15.8 mm Hg systolic and 13.6 mm Hg diastolic. Furthermore, blood pressure rose more slowly than did body weight in those patients who subsequently regained weight. Results from the Framingham study showed a 15 percent decrease in weight to be associated with a 10 percent reduction in systolic blood pressure (Kannel et al., 1967). In the Evans Country longitudinal study, obese individuals who lost an average of 8 kg with the help of a weight-loss program had an average decrease of 18 and 13 mm Hg in their systolic and diastolic blood pressures, respectively (Tyroler et al., 1975). Reisin and colleagues (1978) reported that patients who averaged a weight loss of 10.5 kg on a diet of 800–1,200 kcal/day (without salt restriction) showed decreases in both systolic and diastolic blood pressures of approximately 20 mg Hg. Even though these patients did not reach
their normal weight, about three-quarters had their blood pressure return to normal. MacMahon and colleagues (1985) reported a 1 mm Hg decrease in both systolic and diastolic blood pressure per kilogram of weight loss in a group of young, obese women. Eliahou et al. (1981) found that two-thirds of obese, hypertensive patients who followed their program became normotensive, even though as a group they only lost about half their excess weight. Foley et al. (1992) studied the impact of gastric restrictive surgery on hypertension and found hypertension resolved in 66 percent of the patients, even though their follow-up weights averaged 133 to 170 percent of their ideal body weights. So clear are the benefits of weight loss to lowering blood pressure that the Fifth Joint National Committee on Detection, Evaluation, and Treatment of High Blood Pressure continues to advise weight reduction as an important goal for obese, hypertensive individuals (NHBPEP, 1993). A companion report also recommends weight reduction for the primary prevention of hypertension (NHBPEPWG, 1993).
Cardiovascular Disease
Many obese individuals have elevated blood triglycerides, reduced high-density lipoprotein cholesterol (HDL-C), and an elevated ratio of low-density lipoprotein cholesterol (LDL-C) to HDL-C, putting them at increased risk of cardiovascular disease (CVD). The direct costs of obesity-related CVD in 1990 were estimated to be $29.4 billion (Wolf and Colditz, 1994). CVD risk-factor profiles are often improved with weight loss. In particular, small weight losses of 5 to 10 percent of initial weight will increase blood HDL concentrations (Schwartz, 1987; Wood et al., 1988). In a study of cholesterol levels in obese patients, Osterman et al. (1992) found that the percentage decrease in total serum cholesterol positively correlated with the amount of weight loss in those with hypercholesterolemia. Weight loss associated with a lower total fat and calorie intake can favorably affect serum lipoprotein levels (Grundy et al., 1979; Kesaniemi and Grundy, 1983). In a study of 41 people on a 6-week, low-calorie (1,200 kcal for women, 1,500 kcal for men), low-fat diet, Seim and Holtmeier (1992) found that weight loss averaged 4.7 kg (5.8 percent of their average original weight), BMI decreased 6.0 percent for women and 5.3 percent for men, total cholesterol decreased 16 percent, LDL-C decreased 12 percent, and HDL-C decreased 18 percent.
Sleep Apnea
One of the most serious complications of obesity is sleep apnea, defined as very brief periods of time during sleep when breathing ceases,
occurring as often as 100 or more times a night. Not only does sleep apnea contribute to somnolence and impaired alertness during the day, it is also a risk factor for premature death (Young et al., 1993). Obesity is the single most important cause of sleep apnea, and weight reduction is remarkably effective in its control (Young et al., 1993). Unfortunately, a major problem with sleep apnea is that it is often not recognized by those suffering from it. Such recognition entails first becoming aware of the possibility of its occurrence and then enlisting the help of someone who sleeps with the individual. Alerted to the phenomenon, helpers have little difficulty in making a provisional diagnosis that can be readily confirmed by study in a sleep laboratory. The possibility of using obesity treatment programs as a means of identifying cases of sleep apnea has great potential as a public health measure. We recommend that these programs conduct such a brief (and effective) case-finding measure.
Osteoarthritis
Joint symptoms, in particular osteoarthritis of the knee, hip, and back, are strongly associated with obesity (Anderson and Felson, 1988; de Gennes, 1993). Weight loss significantly reduced the risk of developing symptomatic knee osteoarthritis among women participating in the Framingham Knee Osteoarthritis Study (Felson et al., 1992). Weight loss decreases the symptoms and improves the management of osteoarthritis in other weight-bearing joints.
Long-Term Benefit of Weight Loss Are Uncertain
While excess weight has been shown to be related to adverse health outcomes, the literature on the long-term health effects of weight loss is less consistent (Andres et al., 1993; Pamuk et al., 1992, 1993; Williamson et al., 1993). Most of the current information is derived from observational cohort studies that use mortality as an endpoint, although some data exist on other health outcomes.
Many of the epidemiologic studies of mortality suggest that weight loss is associated with increased risk (Andres et al., 1993; Pamuk et al., 1992; Williamson et al., 1993). Data from the NHANES I Epidemiologic Follow-up Study, a longitudinal study of persons examined as part of NHANES I (1971–1975), show that for men and women whose maximum BMI was between 26 and 29, the risk of death as of 1987 increased with increasing weight loss. Those who lost 15 percent or more of their maximum weight had more than twice the mortality risk of those who lost less than 5 percent, after adjustment for age, race, smoking, parity, preexisting
illness, and maximum BMI. For those with BMIs of 29 or greater, weight losses of 5 to 14 percent were protective for men but not for women, for whom mortality risk increased with amount of weight lost (Pamuk et al., 1992). A relationship between weight loss and incident disability was also found in this cohort among those 60–74 years of age at baseline. While increasing BMI was associated with increasing incidence of disability, weight loss was associated with a twofold risk of disability among those 60–74 at baseline. Weight change was not associated with incident disability among those 45–59 years of age at baseline (Launer, 1994).
Several methodological problems of observational studies limit their generalizability. It is often difficult to determine the reason for the weight loss in observational studies, and it is possible that weight loss itself is an indicator of subclinical disease. Changes in smoking status could also affect the relationship between weight loss and mortality because those who stop smoking would be less likely to lose weight and would have a survival advantage. Many of the studies showing increased mortality with weight loss have attempted to eliminate these methodological problems by eliminating deaths in the early years of follow-up and controlling for smoking status. These controls generally do not eliminate the risk associated with weight loss (Pamuk et al., 1993). It is also possible that unhealthy dieting practices are putting those losing weight at additional risk, although the data on the effects of weight cycling are inconclusive (see box titled ''Weight Cycling").
Preliminary results of a clinical study just being reported provide possible evidence of the long-term health benefits of weight loss. The ongoing two-part Swedish Obesity Study (SOS) consists of a registry study to examine the health of 10,000 severely obese subjects and an intervention study examining the long-term effects on morbidity and mortality of weight loss by surgical means (e.g., gastric banding, vertical-banded gastroplasty, and gastric bypass) among 2,000 subjects compared to weight loss by conventional means (n = 2,000) (Nabro et al., 1994). Between 1987 and 1992, a nationwide sample of obese subjects (n = 3,700) from 37 to 59 years of age was recruited, from which 856 candidates for surgical weight reduction and 856 matched controls were selected (Lissner et al., 1994). Initial BMI among these candidates and controls averaged 37.5 in men and 40.6 in women. Among 442 surgical cases followed for 2 years, body weight decreased from 121 ± 16 to 93 ± 17 kg compared to only a 0.6 ± 8.9 kg decrease among controls (Sjöström et al., 1994b). Although the SOS is not yet complete, preliminary results in initially healthy obese subject showed that the highest BMI was associated with the highest relative risk of all-cause mortality (Lissner et al., 1994). Fat distribution, fasting blood insulin concentrations, and smoking were
|
WEIGHT CYCLING Some concerns have been raised that the repeated loss and regain of weight, a process known as weight cycling, may pose additional risks to health or have detrimental effects on body composition and energy metabolism. (Weight cycling is popularly called "yo-yo dieting" when the cause is due to repeated failed attempts at long-term weight loss.) Several prospective epidemiological studies show increased risk for all-cause and cardiovascular-disease mortality in individuals with large variations in body weight when compared to those whose weights are stable (Blair et al., 1993; Hamm et al., 1989; Lee and Paffenbarger, 1992; Lissner et al., 1991). These results are paradoxical given the established direct association between body composition and clinical status (e.g., blood pressure, lipid profile, and glucose tolerance) and risk of chronic diseases such as NIDDM, hypertension, and coronary heart disease. At least two other studies show no association between weight cycling and mortality (Lissner et al., 1990; Stevens and Lissner, 1990). Therefore, the application of the weight-variation and weight-loss study findings is unclear with respect to implications for clinical practice or public health policy. Although the weight-variation and weight-loss study results are intriguing, the evidence is not sufficient to warrant ignoring overweight as a health risk or to recommend against appropriate weight-loss efforts in overweight persons. Furthermore, in studies with experimental animals, food restriction in both genetically lean and obese animals is associated with decreased mortality and increased median life span (Lane and Dickie, 1958; Masoro et al., 1982). In ongoing studies with nonhuman primates, food restriction is associated with decreased morbidity, specifically NIDDM (Hansen and Bodkin, 1993). Further study of these provocative issues is needed, with particular emphasis on elucidating possible biological mechanisms and with improved designs and methods in epidemiological studies of humans. Three recent reviews of the subject are NTF, 1994b; Reed and Hill, 1993 (which focuses on weight cycling in animals); and Wing, 1992 (weight cycling in humans). |
also independent predictors of mortality. Obesity-related risk factors improved only in the surgical group. Marked improvements in current health, mood patterns, and obesity-specific problems were also found in 346 of the surgical cases compared to 346 controls (Sullivan et al., 1994). These results suggest that in a severely obese population, significant weight reduction decreases morbidity and ultimately should decrease mortality. They are consistent with the results of studies in experimental animals where restricting the food intake of genetically obese mice results in decreased mortality compared to obese controls fed ad libitum (Lane and Dickie, 1958). Further research is needed to confirm that sustained weight loss in the obese reduces the overall risks of morbidity and premature death over time.
Despite the fact that additional research on the relationship between weight loss and mortality is needed, we believe that it is prudent for
obese individuals to lose weight to improve their health and to maintain the weight loss over time, particularly if they have one or more comorbidities associated with their obesity. Although supporting data are unavailable, it seems reasonable that weight loss is most likely to be safe and successful if done by following reputable programs and approaches and with the help of, or at least under the supervision of, a health-care provider with training in weight management. Even without weight loss, obese individuals are likely to derive health benefits from improving their health-care practices and dietary patterns and incorporating more physical activity into their lives.
THE COSTS OF OBESITY
The high prevalence of obesity in this country together with its link to numerous chronic diseases leads to the conclusion that this disease is responsible for a substantial proportion of total health-care costs. Herman et al. (1987), for example, estimated that half of all NIDDM could be prevented by controlling obesity. Colditz (1992) calculated the economic costs of obesity in relation to NIDDM, cardiovascular disease, gall bladder disease, hypertension, and breast and colon cancer. Costs were measured as both direct costs (resources that could be allocated to other uses in the absence of disease, such as professional services and hospital care) and indirect ones (the value of lost output because of cessation or limitation of productivity, such as wages lost or the present value of future earnings lost by people who die prematurely). Colditz estimated conservatively that obesity was responsible for $39.3 billion, or 5.5 percent, or the costs of illness in 1986. If musculoskeletal disorders such as osteoarthritis were included, the economic costs of obesity increased to 7.8 percent of the costs of illness in 1986.
Further work by Colditz and a colleague led them to an estimate of $68.8 billion as the economic cost of obesity in 1990 (Wolf and Colditz, 1994). To this figure can be added the more than $33 billion spent yearly on weight-reduction products and services, for an estimated total of more than $100 billion per year as the economic cost of obesity.
This estimate does not include the psychosocial costs of obesity, which can range from lowered self-esteem to the more serious binge-eating disorders and clinical depression. A recent prospective study examined the social and economic consequences of obesity among a national random sample of obese adolescents and young adults (6 to 24 years of age) in 1981 who were reinterviewed in 1988 (Gortmaker et al., 1993). Compared to subjects of normal weight who were healthy and to those who suffered from other chronic health conditions, the obese female subjects over the 7-year period were significantly less likely to be
married, had lower household incomes, and had a higher rate of household poverty, independent of their baseline socioeconomic status and aptitude-test scores. The overweight men fared somewhat better since they were only less likely to be married.
People, including physicians, have an unfortunate tendency to ascribe personal failings to the obese on the basis of discredited notions as to how this disorder comes about (Stunkard, 1993). The idea that self-indulgence or hedonism is a cause of obesity assaults obese people every day and, we believe, leads to discrimination. "Fat is the last preserve for unexamined bigotry," notes one obese professional woman (Coleman, 1993). Given the fact that treatment of obesity under the most optimal conditions is often unsuccessful in the long run, health-care providers must be especially sensitive to the weight-related intentions of obese individuals.
At this time, it is too early to know when and what kind of health-care reform bill will be passed by Congress and become law, so one cannot know whether and to what extent obesity treatment provided by or monitored by physicians, dietitians, psychologists, or other allied health professionals will be part of a benefits package. It is notable, however, that many managed-care programs and health insurance plans specifically exclude obesity treatment from their benefits package (personal communication with F. Xavier Pi-Sunyer, M.D., M.P.H., Director of the Obesity Research Center at St. Luke's-Roosevelt Hospital Center in New York City). At least one managed-care program has begun to offer special health-promotion packages that include incentives for weight loss by discounting the costs of a nonclinical weight-loss program and offering reimbursements for the costs of a program for achieving and maintaining weight loss (personal communication with Linda Webb Carilli, M.S., R.D., General Manager, Corporate Affairs, Weight Watchers International, Inc.). Some insurance companies will reimburse for the surgical treatment of morbid obesity, but Oregon's uniform health coverage no longer includes gastric bypass surgery (Chase, 1994). This is in the face of scientific evidence that such surgery can produce significant weight loss that can be maintained by many morbidly obese patients for long periods of time (NIH, 1992). Weight loss in the very obese improves functional status, reduces work absenteeism, decreases the prevalence and severity of sleep apnea, decreases blood pressure, reduces hyperglycemia, and improves social interaction (NIH Technology Assessment Conference Panel, 1993). As this country debates how to reform its health-care system, it is important that obese individuals not be discriminated against in receiving appropriate treatment and care for their disease that is covered by insurance.
The intractability of obesity has spawned an antidieting movement
that advocates greater acceptance of individuals regardless of their weight and defends the rights of the obese to be protected from job discrimination and social biases (Brownell and Rodin, 1994). The movement questions whether effective obesity treatments exist and points out the potential negative consequences of dieting on psychological and physical well-being. An International No-Diet Day has been organized each year since 1992 to encourage people to appreciate the varied sizes and shapes of human bodies (Tufts, 1994). We agree, of course, that there should be more appreciation and acceptance of diversity in the physical attributes of people, more discouragement of dieting in vain attempts to attain unrealistic physical ideals, and no obsession with weight loss by individuals who are at or near desirable or healthy weights. However, it is inappropriate to argue that obese individuals should simply accept their body weight and not try to reduce, particularly if the obesity is increasing their risk for developing other medical problems or diseases.
CONCLUDING REMARKS
This chapter has laid the foundation for what is to come in the remainder of this report. While the bad news is that the prevalence of obesity in this country is increasing, the good news is that obese individuals do not need to return to some ideal, non-obese weight to improve the risk factors, including hypertension and hypercholesterolemia, that predispose them to developing a variety of chronic diseases. Several studies demonstrate that small losses in general (approximately 10 to 15 percent of initial body weight) help reduce obesity-related comorbidities and that improvements in these risk factors persist with maintenance of these modest weight losses. They are an important component of the foundation for a new perspective on obesity-treatment outcomes that we present later in this report. The following chapter provides some additional background on the types of obesity treatment programs currently available and discusses the broad approaches to treatment used by them.


