
2
The Need and Demand for New Contraceptive Methods
Issues of Terminology
In the context of family planning and contraception, the terms "need" and "unmet need" are applied, qualitatively and quantitatively, in several overlapping and intersecting ways, depending on the purposes of their application. They may incorporate the notions of "demand,'' "unmet demand," or "potential demand" or even be used interchangeably with those terms; and all terms are almost inevitably entangled with various conceptualizations of "preferences" and "intentions." The definition and computation of who "needs," "demands," "prefers," and "intends" what, and under which circumstances, have been debated for well over a decade. The debate is, however, far from an arid academic exercise: Its results have always been significant for the design, implementation, and evaluation of family planning programs. Because the terminology debate is vitally connected to the commodities, that is, the fertility regulation technologies that are essential to family planning, it has large and necessary implications for the pace and direction of contraceptive research and development, as well as for the involvement of industry in R&D processes.
Accordingly, this chapter begins with issues of terminology and its quantitative implications, as a basis for thinking about the personal and public health components of current needs for contraceptive technologies in the United States and worldwide. Some of these needs are general , in the sense that they are needs for contraception; others, addressed more fully in Chapter 5, are specific needs for new contraceptive technologies which have, in the eyes of this committee, clear implications for the market. "General needs" include the consequences of
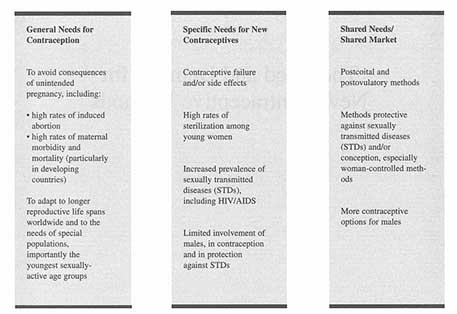
Figure 2-1
General needs for contraception, specific needs for new contraceptive methods, and the market created by these shared needs.
unintended pregnancy, notably abortion and maternal mortality, and the changing requirements of the reproductive life span. "Specific needs" include sexually transmitted reproductive tract infections; lack of involvement of males in contraception; and contraceptive failure and side effects. Figure 2-1 presents this breakdown in graphic form.
Market Demand
In economics, "demand" has both volitional and authoritative dimensions, since it comprises the notions of desire to purchase and possess, as well as the power to do so. In classical microeconomic theory, demand has an iterative relationship with supply, a relationship that is mediated by the market, which transmits information about prices, quantities, and elasticities in each.
However, application of traditional supply-and-demand concepts to understanding the role of demand in processes of technological innovation has not been very illuminating (Lotz 1993; Mowery and Rosenberg 1982). A more rewarding perspective is offered by marketing research, which distinguishes between "needs," "wants," and "demands'' in ways that are useful for thinking about development of new medical technologies in general and contraception in particular. In one analysis, a human need is defined as "a state of felt deprivation of
some basic satisfaction," wants as "desires for specific satisfiers of these deeper needs," and demands as "wants for specific products that are backed up by an ability and willingness to buy them." The more explicitly needs are articulated as demands, the higher the likelihood that the "demander'' will be willing to pay for satisfaction of those needs (Kotler 1988).
The concept of market demand introduces the important notion of "signals," or expressions that come from a potential user—or third-party population—with both the willingness and ability to pay for satisfying needs and wants that are assumed to be in some way "unmet" (Lotz 1993; Nelson and Winger 1977). These may be (a) very specific signals about product specifications; (b) signals about a roughly described product; (c) signals about product class; (d) signals about demand for some kind of functions; or (e) no signals whatsoever, even if demands exist. The degree to which these can be determined will have a lot to do with the probabilities that investment will be attracted and that innovation will occur (Teubal et al. 1976). The sending and receiving of signals and the overall influence of demand factors on investment—in this case, investment in medical innovation—is not at all straightforward or linear; on the contrary, it is highly iterative (Gelijns and Pannenborg 1973; Lotz 1993; Mowery and Rosenberg 1982). It is also highly dependent on knowledge about the "owners" of the needs, that is, the "users," their preferences, and the expression of those preferences in patterns of adoption.
In this framework, the populations that are germane to conceptualizing the market for the outputs from contraceptive research and development are
- the population that
-
(a)
has been defined as having an unmet need for family planning, and
-
(b)
has evidenced a desire to actively use contraception in response to that need; and
Thus, the "market demand" population is always the smallest subpopulation in the set. If it cannot be identified somehow as substantial, there is no incentive for a potential product developer or seller to invest in this particular market. Therefore, from a commercial perspective it is crucial to determine what fraction of the "unmet need" population represents a true market opportunity.
Calculating the Unmet Need for Contraceptives
Like "demand," "unmet need" is an elusive concept, changing according to how survey questions are posed, what assumptions are made, and the criteria used for exclusion and inclusion (Dixon-Mueller and Germain 1992). All these elements affect quantification of the ultimate size of the population defined as
needing contraceptive protection, as well as estimates of what is needed in the way of services and commodities. The definition of unmet need is surely crucial for computing the market for contraceptive technologies.
Over the past 15 years, there have been numerous alternative calculations of the need and demand for contraceptives. The most generally accepted have been those authored by Westoff (e.g., Westoff and Ochoa 1991), which have been enormously useful in defining national family planning policies and prioritizing the need for international assistance. However, these approaches have been revisited recently from a women's health perspective and revised in a way that defines the base population more broadly (Dixon-Mueller and Germain 1992 and 1994; Guttmacher Institute 1995a; Wulf 1995) (see Table 2-1). The rationale for "casting a wider net" is that conventional definitions, which essentially restrict the unmet-need concept to married women1 and nonusers of contraception, respond neither to the contemporary realities of women's (or men's) lives, nor to the statistical realities concerning contraceptive utilization, effectiveness, and appropriateness.
The expanded definition adds to the basic conventional definition the following population groups:
- sexually active, unmarried women;
- women with postpartum amenorrhea;
- women who are using a less effective contraceptive method but who definitely want to avoid or postpone childbearing;
- women who are using a more effective method but who are using it incorrectly, are dissatisfied, or should not be using it for health reasons;
- women with unwanted pregnancies; and
- women with related reproductive health problems (Dixon-Mueller and Germain 1994).
Both the conventional and expanded definitions can be used to calculate need in national population subgroups by residence, age, and even subculture, and to compare countries in terms of magnitudes and characteristics of need and the ability of women in those countries to realize their reproductive wishes. Nonetheless, the effects of their different premises on calculation of unmet need can be strikingly large in the aggregate, ranging from an estimated 120 million (Ketting 1994; Robey et al. 1992) to 228 million women at risk of unplanned pregnancy even though they do not want to have a child (Guttmacher Institute 1995a).
Reproductive Preferences
Reproductive preferences have been a routine part of fertility and family planning surveys from their inception, as these surveys have sought to quantify
and measure fertility norms (desired or ideal number of children), reproductive intentions (intentions to postpone or terminate childbearing), spacing intentions (preferred length of the next birth interval), and wanted and unwanted births (intendedness).
Reproductive preferences are also integral to defining unmet need. While preference data were for a long time viewed as the "soft" part of demographic surveys, recent methodological research has raised confidence in their predictive validity, although that is variable. For example, using the "ideal" or ''desired" number of children has been thought to lack any particularly predictive utility, because it reflects societal norms more than it truly reflects individual intentionality. However, though there may be some erosion in individual preferences in response to personal, family, or societal pressures (Freedman 1990), the percentage of women who state that they want no more children is a good short-term predictor of fertility rates (Westoff 1991). As such, it is a reasonable indicator for purposes of user-based market analysis, despite the inevitable divergence between the number of children women say they wanted or would want in the future and the number they actually have (the "KAP [knowledge, attitudes, and practices] gap").2
Since there have been some dramatic changes in fertility levels worldwide during the past two decades, it is reasonable to assume that there has been some kind of fit between women's preferences and their actual behavior. The fact that the fit is imperfect does not invalidate the measure. At the same time, even the most meticulously shaped definition of either unmet need or unmet demand omits a number of qualitative variables that are crucial to conceptualizing the market for new contraceptive technologies. Discounting the force of various dimensions of local culture—for example, politics, gender roles, and the values assigned to fertility—and assuming that women everywhere will behave in the same ways given equivalent knowledge, resources, and options, is as risky for calculating a market as it is for implementing family planning programs.
Third-Party and Public Health Perspectives
Having defined a population with an unmet demand for contraception, it is then possible to address the question of what fraction of that population represents true market demand. As suggested at the beginning of this chapter, there are two very different subpopulations to be accounted for: Subpopulation 1, consisting of those able and willing to spend their own resources; and Subpopulation 2, consisting of those for whom some third party is prepared to pay. This latter, "third-party" category contains considerable variety: private insurance companies, managed care organizations, hybrid network arrangements, and government programs for the poor in the United States and other developed nations, as well as national family planning and public health sector programs in develop-
TABLE 2-1 Comparison of Two Approaches to Calculating Unmet Need for Family Planning
|
|
Westoff and Ochoa (1991) |
AGI (1995) Includes |
|
|
Population |
Include as Having an |
as Having an Unmet |
Assumptions Underlying |
|
Characteristics |
Unmet Need for Contraception: |
Need for Contraception: |
AGI Calculations |
|
Union status |
All women currently in union |
All women of reproductive age |
Many single women also have a need to avoid pregnancy |
|
Age |
Aged 15-49 |
Aged 15-44 |
Women aged 45-49 are probably infecund in any event |
|
Pregnancy |
All women who did not want most recent pregnancy and were not contracepting at time of that conception |
All women who do not want current pregnancy, whether or not contracepting at time of that conception |
Some women are unable to use any method effectively or are using a method with high failure rates |
|
Amenorrhea postpartum |
All women who did not want most recent pregnancy and were not contracepting at the time of that conception |
All women who do not want another child, soon or ever, and are not using an effective method of contraception |
All have a need even if, technically, they cannot conceive at the moment |
|
Use of postpartum abstinence |
Women using postpartum abstinence |
|
Although the abstinence may not be intended to prevent pregnancy, it nonetheless has assured contraceptive effect, so that women maintaining postpartum abstinence are not in need |
|
Method use |
|
Women using traditional methods of contraception (rhythm, withdrawal, etc.) |
Traditional methods can have high failure rates and thus do not offer effective protection from unintended pregnancy |
ing and industrializing countries, often at least partly subsidized by overseas development assistance.
These subpopulations also have slightly different perspectives regarding the "value" or cost-effectiveness of contraception. Individuals, who do not as directly bear some of the broader social costs of increased population size that result from less-than-optimal levels of contraception, give primary emphasis to efficacy, side effects, out-of-pocket costs, and personal concerns such as convenience and autonomy. In contrast, third-party payers are more likely to be sensitive to the costs of unintended pregnancies, in terms of the cost and risks of abortion and the costs and risks of carrying unintended pregnancies to term.
In the developing world, there is more heterogeneity in perspectives on family planning and contraception, depending on the history of a given country, its culture and religions, and where it is demographically, economically, and epidemiologically. Some countries, particularly those whose fertility rates remain high, must continue to worry about population growth rates, sizes, and densities. A growing number of other countries, further along in the demographic and epidemiologic transitions, must address both an "unfinished agenda" of high mortality, infectious disease, and malnutrition and a swelling agenda of noncommunicable and chronic diseases in adults and the elderly (Mosley et al. 1993). All countries, sooner or later, will find themselves obliged to somehow add to their priorities the new agenda, articulated at Cairo and ratified at Beijing, relating to the empowerment of women and their reproductive health and rights. The fact that these economies must take into account all these valid and pressing agendas and must do so with persistently constrained health sector resources means that they, like the established market economies and the formerly socialist economies of Europe, are also having to focus hard on issues of cost containment, cost-effectiveness, and cross-sectoral externalities and trade-offs in development investment (World Bank 1993). But here, too-and this is important-individuals have the same concerns and needs as do individuals in developed countries: they do not voluntarily choose to use contraception primarily because of national demographic or macroeconomic concerns.
There is a third area where individual and societal health needs coincide because their nature is such that, left unsatisfied, they incur costs of some kind which can be quantified, albeit in different ways. The costs of contraception can then be compared to the costs of nonsatisfaction of these shared individual and public health needs so that, in some cases, it is possible to develop cost-benefit or cost-effectiveness ratios. At a minimum, it is possible (though not necessarily simple) to calculate the various costs of a given case of "nonsatisfaction" to whoever the payer is: the society at large, some third-party payer, or an individual. These shared unmet needs include unintended pregnancy, abortion, maternal mortality and morbidity, and sexually transmitted disease, needs which can be especially acute and especially costly in populations of particular vulnerability owing to such covariates as age, parity, ethnicity, or socioeconomic status.
The societal costs of all of these are high and, in some instances, can only increase, either because the magnitude of the need itself increases, or because it will simply become more expensive to deal with, or both. Contraception offers very cost-effective and risk-reducing alternatives to unwanted pregnancies, whether those pregnancies are terminated by abortion or allowed to go to term, as well as to morbidity (Lee and Stewart 1995; Trussell et al. 1995). At present in the United States, a majority of third-party payers would seem to be missing a major investment by not offering a broad range of contraceptives as a cost-containment strategy that has potential economic payoff well in excess of many other forms of health care. We will argue in Chapter 5 that contraception that includes or is accompanied by protection against sexually transmitted diseases is even more cost-effective and surely risk-reducing. As more and more third-party payers assume long-term responsibility for covering large, stable populations over a long period of time for a broad range of health care services, it is reasonable to assume that they will look to those savings that can be derived from prevention and, therefore, see the economic value and consequent logic of substantially increasing their investment in contraceptive and reproductive health services as a major cost-containment tool. This will not be an overnight process. Ongoing restructuring of the managed care industry and the current mobility of subscribers shopping for the best care at the best price will, for a while, affect the potential for a given HMO to realize a payback from investment in prevention. At the same time, the payback from pregnancy prevention, with its rapid "turnaround" and transparent causal attribution, can be realized much faster than, for instance, the payback from nutrition education and prevention of high-cost chronic diseases.
A Life Span Perspective
There is a growing constituency in the public health community for a more inclusive and integrative model of individual and family health and well-being, and use of the phrases "life cycle" and "life span" to define a perspective have acquired a certain currency, particularly in connection with women's health and well-being. The basic premise of this perspective is that human health and illness are not a haphazard affair, but express the accumulation of conditions that begin early in life, in some respects before birth. A second premise is that the factors that favor good health and precipitate ill health are not purely genetic or biological but can be social, economic, cultural, and psychological, and can work together or against one another across the span of an individual's life in ways that we are only beginning to understand. The third premise is that no reasonable public health strategy can ignore these dynamics and what constitutes a continuity of risk over an entire lifetime (Institute of Medicine [IOM] 1996; Tinker et al. 1994; UNFPA 1994; World Bank 1994). The importance of the life span concept to this report is straightforward enough: At different points across their life
spans, women have different reproductive intentions, different pressures on their lives, different needs for contraception, and different overall reproductive health requirements. Contraceptive research and development has to take all of these life span dimensions into account since, to a large extent, they shape the structure of demand.
In developed countries, the portion of the female life span that can be described as the "potential reproductive years," that is, the years between menarche and menopause, constitutes about half of a woman's total life span; in developing countries, where life expectancies are generally shorter, that portion can be well over half. This means that a typical woman in the United States is at biological risk of pregnancy for approximately 36 years (Hatcher et al. 1994). Fourteen percent of those potential reproductive years (or years at biological risk of pregnancy) is spent in Stage 1, the years between menarche and first intercourse, and 19 percent in Stage 2, the years between first intercourse and marriage; during these two stages, the large majority of women will be trying to avert or postpone pregnancy. Stage 3 comprises the years between marriage and first birth, or 5 percent of the years at risk, during some part of which some women will be averting or postponing pregnancy. Stage 4, the years between first birth and attainment of desired family size, represents 11 percent of the potential reproductive years, during which the emphasis for most women is on spacing births. The years that follow, that is, the years between attainment of desired family size to menopause (Stage 5) occupy 51 percent of the whole span of potential reproductive life. This span of years consists of two periods, the boundary between which is typically blurred except for women who are surgically sterile. The first is the period between the age of intending no more children and presumed3 sterility, during which many women will want to avert pregnancy; the second comprises the years from presumed sterility to menopause, when there is no concern for contraception. Nevertheless, during Stage 5 and into the postmenopausal period (Stage 6), many women will still require protection from sexually transmitted infection, as is increasingly the case for many women throughout their reproductive years (Forrest 1993).
For women who want a certain number of children, these proportions change somewhat to account for the years spent in pregnancy, postamenorrheic abstinence or infecundity, or sexual inactivity. The hypothetical woman who is sexually active between ages 20 and 45 and wants two children will need protection from pregnancy for approximately 20 years, that is, 82 percent of her 25-year reproductive life. The woman who wants four children will need protection for about 16 years, or 64 percent of her reproductive life. Even the woman who wants six children will need nearly 12 years of protection, or 46 percent of her reproductive life (see Table 2-2). For women who begin childbearing in their teenage years, these estimates are, of course, conservative. The general rule is that, for all women, everywhere, the younger they are when they begin their reproductive lives, the older they are at menopause; the fewer children they want,
TABLE 2-2 Proportions of Female Reproductive Life During Which Protection from Pregnancy Is Needed
the longer they must spend in need of some kind of contraception (Guttmacher Institute 1995a).
The stages in the potential reproductive years can be further characterized according to the ways they differ from one another biologically, socially, and psychologically, as well as in the balance required among prevention of pregnancy, protection from disease, and preservation of fertility (Fathalla 1992; Forrest 1993; Fortney 1989; King and Smith 1994). Obviously, transition from stage to stage is not uniform among women or among societies. Women do not transit at the same age or in the same order, and some women in some situations may even skip a stage or advance into a next stage in ways that can be biologically or socially worrisome. Unduly early or unduly late pregnancies are prime examples: The fact that many women in the world have their first baby while they are still adolescents can have high costs: Even when prepregnancy disadvantages are taken into account, early childbearing appears to have a causal and adverse effect on the health and social and economic well-being of children and, in varying measure, on their mothers (IOM 1995; Kubicka et al. 1995).4
Table 2-3 examines each stage of female reproductive life in terms of a few key biological, social, and psychological variables; fertility goals, sexual behavior, and contraceptive use; and the qualities of contraception that are particularly necessary at certain times. The table includes the postmenopausal years even though this period lies beyond what are biomedically defined as the reproductive years, since many women continue to be sexually active; because of menopause-associated physiological changes (e.g., structural changes in vaginal tissues), those women remain vulnerable to sexually transmitted infections. This means that continued protection against those infections may be required later in the course of women's lives than is usually thought to be the case, a dimension that is appropriate to thinking about prospects for new reproductive technologies.
The principal message that emerges from this scrutiny of the texture of the female reproductive life span is that, at various points in their lives, women everywhere have different reproductive intentions and, consequently, different needs for family planning and the maintenance of their reproductive health. This means that, first of all, contraceptive services need to offer a full range of methods that are responsive to these changing requirements. Second, viewing contraceptive technology from the perspective of the overall reproductive life span makes it clear that there are periods of that span that are not now served well or appropriately by the current array of methods; most strikingly, there are considerable limitations in what is available for very young women and for women later in life who wish to preserve their fertility but who cannot use the long-term, high-effectiveness methods that are currently on the market.
Preferences and Intentions
Over the past four decades in the United States, as part of the National
Survey of Family Growth (NSFG) and its predecessors,5 a series of questions has been regularly asked of women about the timing and intentionality of their pregnancies. Efforts to capture responses of this type are difficult at best, and many vulnerabilities and complexities intrude. The fragility of human recall, changes in circumstance, ambivalence, differences of meaning, shifts in intensity of feeling, all come into play. However, the NSFG has developed very specific terminology and definitions to measure "unintended pregnancy," using the following definitions of "intended" and "unintended'':
- intended at conception: wanted at the time, or sooner, irrespective of whether or not contraception was being used; or
- unintended at conception: if a pregnancy had not been wanted at the time conception occurred, irrespective of whether or not contraception was being used.
Among unintended pregnancies, a further distinction is made between mistimed and unwanted:
- mistimed conceptions are those that were wanted by the woman at some time, but which occurred sooner than they were wanted; and
- unwanted conceptions are those that occurred when the woman did not want to have any more pregnancies at all (IOM 1995).
These definitions have been applied in a large number of national and international surveys in ways that are similar enough to be considered comparable. As suggested in the preceding section, by these definitions almost all women—and this is true worldwide—are at risk6 for unintended pregnancy throughout most of their reproductive years (Forrest 1994). The next sub-sections present the ways in which these various elements of unintended pregnancies are expressed, internationally and in the United States.
Unintended Pregnancy Worldwide
Everywhere in the world, there is often a gap between the number of children women say they want and the number they actually have. Substantial percentages of women report everywhere that they have had all the children they want or that they do not want another pregnancy for at least two years. Many also report that their most recent birth was unwanted or mistimed.7 And, for many of the world's women, the alternative to carrying an unintended birth to term, whether that birth was mistimed or unwanted, was abortion (see Figure 2-2).
The ranges of each of those categories of intention, preference, and action differ from region to region and from country to country, as one would expect (Table 2-4 and Table 2-5). The highest regional percentage of wanted births, 76
TABLE 2-3 Life Span Factors in Women's Reproductive Lives
|
|
Stage 1 |
Stage 2 |
|
|
Menarche-Intercourse |
Intercourse-Marriage |
|
Biologic variables |
Menarche |
First intercourse High reproductive capacity High risk of exposure to STDs High risk of unintended pregnancy High maternal/child mortality and morbidity from too-early pregnancy |
|
Social variables |
Politically most contentious stage Restricted provision of family planning services Constrained access to information about sexuality and contraception |
Politically contentious Laws governing age at marriage Restricted provision of family planning services |
|
Psychological variables |
Limited future orientation/ ability to judge risks/consequences/defer gratification Heightened sense of unique invulnerability Need to establish adult identity/peer intimacy Constrained ability to negotiate use of coitus-related methods Ambivalence |
Constrained ability to negotiate use of coitusrelated methods Ambivalence |
|
Fertility goals: |
|
|
|
Childbearing Future fertility |
Postpone Preserve |
Postpone Preserve (high need) |
|
|
|
Stage 4 |
|
|
|
|
Stage 3 |
1st Birth-Attainment of |
Stage 5 |
Stage 6 |
|
|
Marriage-1st Birth |
Desired Family Size |
Menopause |
Postmenopause |
|
Biologic variables |
Marriage High reproductive capacity Possible fetal wastage/ectopic pregnancy/infertility |
Intend no more children High reproductive capacity |
Sterility/infertility |
|
|
|
|
|
|
Increased incidence and severity of many gynecologic problems |
|
Social variables |
|
Parity requirements for sterilization |
Irrelevant |
|
|
Psychological variables |
Greater intellectual/ emotional maturity/ ability to judge consequences |
|
Heightened maturity |
|
|
Fertility goals: |
|
|
|
|
|
Childbearing |
Postpone |
Space |
Stop |
|
|
Future fertility |
Preserve (high need) |
Preserve (diminishing need) |
Irrelevant |
|
|
|
|
Stage 4 |
|
|
|
|
Stage 3 |
1st Birth-Attainment of |
Stage 5 |
Stage 6 |
|
|
Marriage-1st Birth |
Desired Family Size |
Menopause |
Postmenopause |
|
Sexual behavior: |
|
|
|
|
|
No. of partners |
Variable Challenge to discern infidelity/self-protect against STDs |
Variable |
Variable |
Variable |
|
Frequency of intercourse |
Variable |
Variable |
Variable |
Variable |
|
Coital predictability |
High |
High |
High |
High |
|
Contraceptive use |
|
|
|
|
|
Most common methods |
Sterilization |
Sterilization |
Irrelevant |
|
|
Next most common |
Pill, condom |
|
|
|
|
Importance of method characteristics: |
|
|
|
|
|
Conception prevention |
High |
Irrelevant |
Irrelevant |
|
|
Reversibility |
Low |
Low to irrelevant |
Irrelevant |
|
|
Not coitus-linked |
Moderate |
Irrelevant |
Irrelevant |
|
|
STD prevention |
Low (if monogamous) |
Low (if monogamous) |
Low (if monogamous) |
Low (if monogamous) |
|
Safety during breastfeeding |
Moderate |
Irrelevant |
Irrelevant |
|
|
Technology, 16th revised ed., New York, Irvington Publishers, 1994. We have added Stage 6, the postmenopausal period, since many women remain sexually active despite termination of fertility, and may require protection from sexually transmitted infections. |
||||
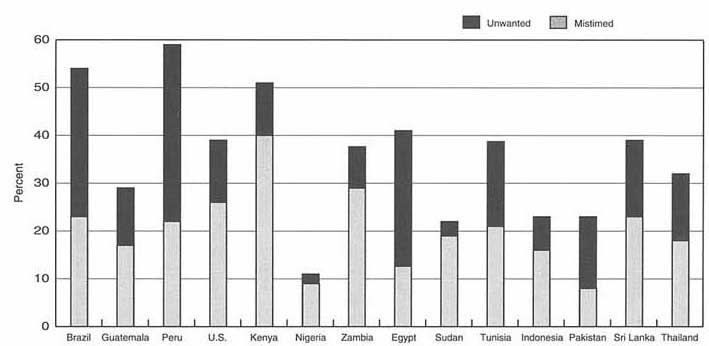
TABLE 2-4 Distribution of Pregnancies by Outcome, Selected Developing Regions and Developed Countries (various dates, in percentages and millions of pregnancies)
|
|
|
Wanted |
Mistimed |
Unwanted |
Abortion |
||||
|
Region |
Number of Pregnanciesa |
% |
No.a |
% |
No.a |
% |
No.a |
% |
No.a |
|
Sub-Saharan Africa (1994) |
28.9 |
76 |
22.0 |
10 |
2.9 |
3 |
0.9 |
11 |
3.2 |
|
North Africa and Middle East (1994) |
11.6 |
58 |
6.7 |
12 |
1.4 |
18 |
2.1 |
12 |
1.4 |
|
South and Southeast Asia (1994) |
65.4 |
63 |
41.2 |
10 |
6.5 |
9 |
5.9 |
18 |
11.8 |
|
Latin America (1994) |
16.4 |
38 |
6.2 |
15 |
2.5 |
19 |
3.1 |
28 |
4.6 |
|
China (1990) |
40.4 |
47 |
19 |
13 |
5.3 |
10 |
4.0 |
30 |
12.1 |
|
Japan (1992) |
1.9 |
36 |
0.68 |
36 |
0.68 |
3 |
0.06 |
25 |
0.47 |
|
France (1991) |
1.1 |
66 |
0.73 |
12 |
0.14 |
3 |
0.03 |
19 |
0.21 |
|
United States (1988) |
6.5 |
43 |
2.8 |
19 |
1.2 |
9 |
0.59 |
29 |
1.9 |
|
a All numbers are in millions. Sources: This table was derived from a graphic presentation in: Alan Guttmacher Institute, Hopes and Realities: Closing the Gap Between Women's Aspirations and Their Reproductive Experiences, p. 25, New York, Alan Guttmacher Institute, 1995. That graphic was, in turn, constructed from the following sources: For the developing regions of the world, the number of abortions and live births: Alan Guttmacher Institute, Women, Families and the Future, New York, 1995. For China, the number of abortions: Henshaw SK, Induced abortion: A world review, Family Planning Perspectives 22:76-89, 1990; the number of live births: United Nations, World Population Prospects: The 1994 Revision, New York, 1995. For France, the number of abortions and live births: Council of Europe, Recent Demographic Developments in Europe, 1993. For Japan, the number of abortions: Ministry of Health and Welfare, The Report on the Statistics Relating to Eugenics Protection, Tokyo, 1993; the number of live births: Vital Statistics of Japan 1992, Tokyo, 1994. For the United States, the number of abortions: Henshaw SK, J Van Vort, Abortion services in the United States, 1987 and 1988, Family Planning Perspectives 22:102-109, 1990; the number of live births: National Center for Health Statistics, Monthly Vital Statistics Report, Vol. 38, No. 6, 1989. |
|||||||||
TABLE 2-5 Planning Status, Last Birth, and Preferences for Next Birth (selected countries, various survey years)
|
|
Average Number of Children |
% Whose Last Birth Was Unplanned |
% Who Want to Stop or Postpone |
||||||
|
Country and Survey Year |
Wanted |
Havea |
"GAP" |
Mistimedb |
Unwantedc |
TOTAL |
Stopd |
Postponee |
TOTAL |
|
Cameroon, 1991 |
6.7 |
5.5 |
- |
17 |
5 |
22 |
45 |
14 |
59 |
|
Nigeria, 1990 |
5.9 |
6.2 |
+ |
9 |
3 |
12 |
53 |
9 |
62 |
|
Pakistan, 1990-1991 |
5.3 |
5.9 |
+ |
8 |
16 |
24 |
21 |
40 |
61 |
|
Jordan, 1990 |
4.9 |
5.4 |
+ |
12 |
26 |
38 |
28 |
53 |
81 |
|
Guatemala, 1987 |
4.2 |
5.1 |
+ |
16 |
13 |
29 |
40 |
47 |
87 |
|
Kenya, 1993 |
3.8 |
6.0 |
++ |
36 |
20 |
56 |
33 |
52 |
85 |
|
Egypt, 1992 |
3.5 |
3.7 |
+ |
9 |
33 |
42 |
19 |
67 |
86 |
|
Indonesia, 1991 |
3.4 |
2.8 |
- |
16 |
8 |
24 |
32 |
54 |
86 |
|
Mexico, 1987 |
3.2 |
3.0 |
- |
24 |
27 |
51 |
18 |
62 |
80 |
|
Philippines, 1992 |
3.2 |
3.8 |
+ |
26 |
21 |
47 |
25 |
63 |
88 |
|
|
Average Number of Children |
% Whose Last Birth Was Unplanned |
% Who Want to Stop or Postpone |
||||||
|
Country and Survey Year |
Wanted |
Havea |
"GAP" |
Mistimedb |
Unwantedc |
TOTAL |
Stopd |
Postponee |
TOTAL |
|
China, 1987-88 |
2.8 |
2.0 |
- |
u |
u |
u |
17 |
64 |
81 |
|
Thailand, 1987 |
2.8 |
2.1 |
- |
18 |
15 |
33 |
23 |
66 |
89 |
|
Colombia, 1990 |
2.6 |
2.6 |
= |
17 |
21 |
38 |
20 |
64 |
84 |
|
Japan, 1992 |
2.6 |
1.5 |
- |
48 |
4 |
52 |
7 |
82 |
89 |
|
United States, 1988 |
2.6 |
2.1 |
- |
26 |
13 |
39 |
23 |
64 |
87 |
|
France, 1994 |
2.3 |
1.7 |
- |
15 |
4 |
19 |
u |
u |
u |
|
Notes: u = Data unavailable; + = have more children than wanted; - = have fewer children than wanted; = = have number of children wanted. a United Nations estimate of total fertility rate. b Percentage of women 15-49 who had a child in the previous five years and whose last birth was not planned at that time. c Percentage of women 15-49 who had a child in the previous five years and whose last birth was not planned at any time. d Percentage of women 15-49 who want no more children. e Percentage of women 15-49 who want to delay the next birth. Source: Derived from Appendix Table 5 (Columns 1 and 5, 18 and 19, and 20 and 21), Alan Guttmacher Institute, Hopes and Realities: Closing the Gap Between Women's Aspirations and Their Reproductive Experience, New York, The Alan Guttmacher Institute, 1995. |
|||||||||
percent, was reported by Sub-Saharan Africa, the next highest by South and Southeast Asia with 63 percent, followed by North Africa and the Middle East with 58 percent, and a low 28 percent of wanted births in Latin America. Although these are huge aggregations, it is worth noting that in Sub-Saharan Africa, where fertility norms are high, about one-fourth of most recent births were nonetheless unwanted. In the North Africa-Middle East region, close to half of recent births were unwanted, with most of that percentage deriving from unwanted rather than mistimed births. The highest regional abortion rates were in South and Southeast Asia, where 18 percent of all recent births were so terminated.
There is inevitably variation among countries in almost all respects. First, there is gap between the family size women say they want and the family size they actually have: the "KAP gap." In some countries, for example, Colombia, Egypt, and Nigeria, women are close to having the total number of children they want; in fact, in Colombia, women say they are having exactly the number they want. (At the same time, 38 percent of Colombian women reported that their latest birth had been unintended, with intentionality divided almost equally between unwanted and mistimed births.) In contrast, in Guatemala, Jordan, Kenya, Pakistan, and the Philippines, the gap between the total number of children women want and the number they actually have was large. Not surprisingly, in countries where national policies discourage more than two children per family, notably China and Indonesia, some women would like more children than they actually have. However, the same was true in countries where there are no constraining policies—France, Japan, Mexico, Thailand, and the United States (Guttmacher Institute 1995a).
The structure of unintendedness of the most recent birth varies internally according to the percentage of mistimed as opposed to unwanted pregnancies. The highest rates of overall unintendedness were reported by Japan, Kenya, Mexico, the Philippines, and Egypt, where close to half of latest births were unintended; Colombia, Jordan, Thailand, and the United States were close behind, with at least one-third of all births unintended. Within this structure, however, ranges differed. Rates of unwanted pregnancies ranged from 48 percent in Japan to 8 and 9 percent in Egypt, Nigeria, and Pakistan. The range for mistimed pregnancies was narrower, from 33 percent in Egypt to 3 and 4 percent in Nigeria, France, and the United States. Of the countries and regions for whom percentages of births ending in abortion were calculated, the highest rates were reported in China (30 percent), the United States (29 percent), Latin America (28 percent), Japan (25 percent), and France (19 percent); the lowest rates were in Sub-Saharan Africa (11 percent) (Guttmacher Institute 1995a).
In sum, the large majority of women in virtually every country surveyed have indicated that they somehow wish to control future childbearing, either by not having another pregnancy (stopping) or postponing the next pregnancy for at least two years (spacing). The proportion of women actively wanting to become pregnant was very low—less than one in five—in developing and most devel-
oped countries. In the same sample analyzed in Table 2-4, the lowest percentages of women who want to either stop childbearing altogether or postpone it were in Sub-Saharan Africa yet, even there, these percentages were two-thirds of all women surveyed. Everywhere else, the percentages of women who wanted to control the occurrence or timing of their next pregnancy ran around 80 to 90 percent. Nevertheless, even in a number of countries where unintendedness rates were high (France, Japan, Thailand, and the United States, for example), the average woman nonetheless indicated that she would—overall—like slightly more children than she actually had. This suggests that attitudes toward family size are often ambivalent and highly sensitive to circumstance (Guttmacher Institute 1995a), so that timing of births and the ability to determine their spacing are crucial. Another message from these figures is related to the global nature of unintendedness. The Guttmacher Institute analysis notes: ''If these proportions are an indication of the success with which women plan their pregnancies, many women in the developed world appear to be doing no better than women in developing regions" (Guttmacher Institute 1995a).
Unintended Pregnancy in the United States
Of all pregnancies in the United States in 1987 (5.4 million), 57 percent were unintended at the time of conception. This figure includes pregnancies that were aborted, as well as both mistimed and unwanted pregnancies that led to live births (IOM 1995) (Table 2-6). In other words, of the estimated pregnancies in that year, less than half—43 percent, to be exact—were actually intended at conception and resulted in live births. The breakdown of unintended pregnancies shows that, while the majority of births from unintended pregnancies were from mistimed rather than unwanted pregnancies, half of all unintended pregnancies ended in abortion in that year. Whether the pregnancy was mistimed or unwanted does not affect the proportion of pregnancies ending in abortion: 51 percent of mistimed pregnancies and 50 percent of unwanted pregnancies end in abortion (Forrest 1994).
Furthermore, the trend toward increase in unintendedness seems to be worsening. During the 1970s and early 1980s in the United States, a decreasing proportion of births were unintended at the time of conception. Between 1982 and 1988, this trend reversed and there was an overall increase in the proportion of unintended pregnancies among both unmarried and married women, and particularly among poor women (IOM 1995; Williams and Pratt 1990).
Stratified analysis of these data upsets a number of preconceptions. First of all, women of all socioeconomic, marital-status, and age groups contribute to the pool of unintended pregnancies; adults as well as teenagers are having difficulty planning and preventing pregnancy. Second, although marital status, which is highly correlated with age, is also strongly related to whether a pregnancy is unintended, 4 out of 10 pregnancies among currently married women were either
TABLE 2-6 Estimated Proportions of Pregnancies (excluding miscarriages) by Outcome and Intention, Percentage of Pregnancies Unintended, and Percentage of Unintended Pregnancies Ending in Abortion, United States, 1987, by Marital Status, Age at Outcome, and Poverty Status at Interview
|
All Pregnancies (miscarriages excluded) |
||||||
|
Demographic Characteristics |
Total Pregnancies |
Intended Pregnancies Ending in Births |
Unintended Pregnancies Ending in Births |
Abortions |
Percentage of Pregnancies Unintended |
Percentage of Unintended Pregnancies Ending in Abortion |
|
Total |
100.1 |
42.8 |
28.4 |
28.9 |
57.3 |
50.4 |
|
Marital status |
|
|
|
|
|
|
|
Currently married |
100.0 |
59.9 |
29.7 |
10.4 |
40.1 |
25.9 |
|
Formerly married |
100.0 |
31.5 |
32.4 |
36.1 |
68.5 |
52.7 |
|
Never married |
100.0 |
11.8 |
22.0 |
66.2 |
88.2 |
75.1 |
|
Age |
|
|
|
|
|
|
|
15-19 |
100.0 |
18.3 |
40.0 |
41.7 |
81.7 |
51.0 |
|
20-24 |
100.0 |
39.4 |
29.7 |
30.9 |
60.6 |
51.0 |
|
25-29 |
100.0 |
54.8 |
23.8 |
21.4 |
45.2 |
47.3 |
|
30-34 |
100.0 |
57.9 |
21.0 |
21.1 |
42.1 |
50.1 |
|
35-39 |
100.0 |
44.1 |
25.1 |
39.7 |
55.9 |
55.1 |
|
40-44 |
100.0 |
23.1 |
31.3 |
45.6 |
76.9 |
59.3 |
|
Poverty Status |
|
|
|
|
|
|
|
<100% |
100.0 |
24.6 |
35.6 |
39.8 |
75.4 |
52.8 |
|
100-199% |
100.0 |
36.0 |
26.8 |
37.2 |
64.0 |
58.1 |
|
>200% |
100.0 |
55.0 |
25.7 |
19.3 |
45.0 |
42.9 |
|
Source: Institute of Medicine, The Best Intentions: Unintended Pregnancy and the Well-Being of Children and Families, S Brown, L Eisenberg, eds., Washington, DC: National Academy Press, 1995, based on: Forrest JD, Epidemiology of unintended pregnancy and contraceptive use, American Journal of Obstetrics and Gynecology 170:1485-1488, 1994. |
||||||
mistimed or unwanted. Third, the high rate of unintendedness in the United States is not explained by a higher incidence of abortion among minority women; it is simply that the total U.S. pregnancy rate, the total rate of unintended pregnancy, and the U.S. abortion rate are all higher than those rates in other Western nations, among all U.S. women (IOM 1995; Henshaw and Van Vort 1994). Fourth, although in 1987 82 percent of pregnancies in teenagers aged 15-19 were described as having been unintended, the same was true of 61 percent of pregnancies in women aged 20-24, 56 percent of pregnancies in women aged 35-39, and 77 percent of pregnancies in women over age 40; even among women aged 2534, between 42 and 45 percent of all pregnancies were described as unintended (IOM 1995). Fifth, while unmarried status is the most important factor in determining whether an unintended pregnancy will end in abortion, it is still the case that 1 in 4 unintended conceptions is aborted by currently married women. Sixth, while adolescents as a group do have the highest rate of unintended pregnancies—82 percent of all adolescent pregnancies are unintended—the proportion of unintended pregnancies among adolescents that end in abortion is not substantially different from other age groups and actually lower than in the older age groups (Forrest 1994).
The Consequences of Unintended Pregnancy
The consequences of unintended pregnancy are of various kinds—biological, social, economic, and emotional—and will also vary among regions, countries, and individuals. In addition, they will vary in their gravity from setting to setting, yet there is little evidence that unintended pregnancy is ever a truly trivial event. This section focuses on abortion and maternal mortality and morbidity as the principal biological consequences of unintended pregnancy. It also addresses the matter of the sexually transmitted diseases as a correlate of sexual activity that, more and more, must be taken into account in thinking about women's reproductive health in general and contraception in particular.
Abortion
Everywhere in the world, unintendedness in pregnancy is the antecedent of virtually all induced abortions (Chen 1995). The reasons for which women everywhere seek abortion reside in three fundamental causes: nonuse of contraception; contraceptive misuse or method failure; and lack of postovulatory or postcoital methods that a woman can use if she has been exposed to unprotected sex, in order to obviate the need to confront the dilemmas of abortion.
The 40 million to 60 million abortions that take place worldwide each year represent 20-30 percent of all the world's pregnancies, or from 30 to 45 abortions per 1,000 women of reproductive age annually (WHO 1991).8 From 26 million to 31 million of these are legal; the remainder—somewhere around 20 million—
are nonlegal and mostly definable as "unsafe." This means that there is 1 unsafe abortion to every 10 of the world's pregnancies, or a ratio of one unsafe abortion to every seven births (WHO 1994). Of the total number of unsafe abortions, 17.6 million (88 percent) take place in the less developed countries, although there are significant variations among and within regions in terms of incidence of abortion and related mortality (WHO 1994) (see Table 2-7).
Important to note is that, owing to the lack of appropriate contraceptives and counseling services, abortion was, and remains, the principal means of fertility regulation in the countries of central and eastern Europe (CCEE) and the newly independent states of the former USSR (NIS), sometimes equaling the number of live births and even exceeding it by two or three times. As a possible consequence of the economic crisis in which these countries find themselves, women fear that bringing up children is simply not affordable. At the same time, these governments are concerned about rapid decline of fertility rates to levels under replacement (Brandrup-Lukanow 1995).
First-trimester abortion, performed with appropriate sterile technique by trained personnel, is a very safe surgical procedure and rates of complications have been decreasing in the United States (IOM 1995). However, unsafe abortions are characteristically performed by the woman herself, by nonmedical individuals, or by health workers in unhygienic conditions, and most occur where abortion is either illegal or, if it is legal, where service access and quality are limited (WHO 1994).
In developing countries, the risk of death following complications of unsafe abortion procedures may be between 100 and 500 times higher than the risk of an abortion performed professionally under safe conditions (WHO 1994). The number of deaths worldwide each year that result from an abortion complication is estimated to be at least 70,000,9 but the margin of error in such statistics is so large that these numbers could be as low as 50,000 or as high as 100,000. Risk of death due to unsafe abortion is at least 15 times higher in developing countries than it is in developed countries and, in some regions, may be as much as 40 to 50 times higher. Looked at a bit differently, mortality from unsafe abortion in developing countries is around 55 per 100,000 live births; in developed countries, that figure is 4 per 100,000 (WHO 1994) (see Table 2-7). Not surprisingly, the complications of unsafe abortions are a leading cause of maternal deaths, over 98 percent of which occur in the developing world, where they account for around 13 percent (1 in 8) of all pregnancy-related deaths (WHO 1994). Urban rates in developing countries may be much higher: One well-designed study in the early 1980s in Addis Ababa, Ethiopia, found that 54 percent of maternal deaths in that city were due to illegal abortion (Kwast et al. 1986). Nonetheless, limitations in data-collection systems make it highly likely that rural abortion rates are underestimated.
While the evidence is patchy and always fragile, there does appear to have been some overall decline in mortality from unsafe abortion. This may be due to
TABLE 2-7 Global and Regional Estimates of Incidence of, and Mortality from, Unsafe Abortions
|
Region |
Number of Unsafe Abortions (thousands)a |
Unsafe Abortions per 1,000 Women Aged 15-49 |
Number of Deaths from Unsafe Abortionsa |
Mortality from Unsafe Abortions per 100,000 Live Births |
Maternal Deaths |
|
World Total |
20,000 |
15 |
70,000 |
49 |
13 |
|
More Developed countriesb |
2,340 |
8 |
600 |
4 |
14 |
|
Less Developed countries |
17,620 |
17 |
69,000 |
55 |
13 |
|
Africa |
3,740 |
26 |
23,000 |
83 |
13 |
|
Eastern Africa |
1,340 |
31 |
10,000 |
101 |
15 |
|
Middle Africa |
180 |
12 |
2,000 |
77 |
11 |
|
Northern Africa |
510 |
16 |
1,000 |
23 |
7 |
|
Southern Africa |
230 |
22 |
500 |
36 |
13 |
|
Western Africa |
1,480 |
34 |
10,000 |
104 |
14 |
|
Asia |
9,230 |
12 |
40,000 |
47 |
12 |
|
Eastern Asiac |
|
|
|
|
|
|
Southeastern Asia |
2,850 |
25 |
5,000 |
43 |
13 |
|
Southern Asia |
6,000 |
21 |
33,000 |
81 |
14 |
|
Western Asia |
380 |
13 |
1,000 |
22 |
8 |
|
Europe |
260 |
2 |
100 |
2 |
10 |
|
Eastern Europe |
110 |
5 |
<100 |
4 |
13 |
|
Northern Europec |
|
|
|
|
|
|
Southern Europe |
150 |
4 |
<100 |
2 |
16 |
|
Western Europec |
|
|
|
|
|
|
Latin America |
4,620 |
41 |
6,000 |
48 |
24 |
|
Caribbean |
170 |
19 |
400 |
50 |
19 |
|
Central America |
890 |
31 |
800 |
23 |
14 |
|
South America |
3,560 |
47 |
5,000 |
58 |
26 |
|
Northern Americac |
|
|
|
|
|
|
Oceania |
20 |
17 |
<100 |
29 |
5 |
|
USSR (former) |
2,080 |
30 |
500 |
10 |
23 |
|
Note: Figures may not add to totals owing to rounding. a Based on 1990 U.N. projections of births. b Japan, Australia, and New Zealand have been excluded from the regional estimates but are included in the total for developed countries. c For regions where the incidence is negligible, no estimates have been made. Source: World Health Organization. Abortion: A Tabulation of Available Data on the Frequency and Mortality of Unsafe Abortion, 2nd ed. Geneva: Division of Family Health. 1994. |
|||||
TABLE 2-8 Mortality Risks Associated with Pregnancy and Selected Health Procedures
|
|
Deaths per 100,000 Cases |
|
|
Procedure |
United States |
Developing Countriesa |
|
Legal abortion |
1 |
4-6 |
|
Female sterilization |
4 |
10-100 |
|
Delivery of live birth |
14 |
250-800 |
|
Cesarean section |
41 |
160-220 |
|
Illegal abortionb |
50 |
100-1,000 |
|
Hysterectomy |
160 |
300-400 |
|
a Estimated. b Performed by untrained practitioners or outside medical facilities. Source: Population Crisis Committee, World Abortion Trends, Briefing Paper No. 9, September 1982. Cited in: World Health Organization. Abortion: A Tabulation of Available Data on the Frequency and Mortality of Unsafe Abortion, 2nd ed. Geneva: Division of Family Health. 1994. |
||
changes in abortion laws and increased access to safe medical abortions and menstrual regulation; increased fertility regulation through contraception; and increased provider skills both within and outside formal health systems. However, this overall picture of decline masks an increase among certain groups in all parts of the world, notably unmarried adolescents in urban areas, where they may represent the majority of all abortion seekers. At the same time, as we will see below in the case of the United States, the general, popular image of the woman who seeks abortion does not accord with statistical reality. In the developing world, many women who seek abortions are married or live in stable unions, already have several children, may be using abortion to limit family size or space births, or may be resorting to abortion as a consequence of contraceptive failure or lack of access to modern contraception (WHO 1994).
In addition to the hemorrhage so often associated with induced abortion, there are other primary and secondary complications which, if they do not produce fatality, may well produce serious and chronic disability. Infections may spread throughout the reproductive tract and produce acute pelvic inflammatory disease (PID), with tubal damage, secondary infertility, predisposition to ectopic pregnancy, chronic pain, and, in severe cases, formation of abdominopelvic abscess requiring emergency surgery and occasionally resulting in death (Meheus 1992). The procedure itself may cause mechanical damage to vagina, uterus, or adjoining structures; cervical lacerations may be responsible for subsequent miscarriage or premature births; and, where the procedure involves introduction of chemicals into the vagina, resulting tissue destruction may also contribute to
infection. There may be additional sequelae in the form of negative effects on subsequent pregnancy outcomes, notably, low birth weight, midtrimester spontaneous abortion, and premature delivery.
Abortion in the United States
The majority of all pregnancies in the United States can be considered unintended and half of those are resolved by abortion. As indicated earlier, of all the pregnancies in the United States in 1987 (6.3 million), 57 percent (3.5 million) were unintended at the time of conception and, of those unintended pregnancies, 51 percent ended in abortion. Of the total number of pregnancies in 1987 in the United States, 29 percent were terminated by abortion (IOM 1995). The number of reported abortions in the United States increased substantially between 1972 and 1989 in the wake of the 1973 Roe v. Wade Supreme Court decision legalizing abortion. In 1972, approximately 600,000 legal abortions were reported; in 1978, 1.1 million were reported. However, through the 1980s, the annual number of abortions in the United States has remained more or less stable, with approximately a million and a half legal abortions each year during the 1980s; 1.6 million in 1990; and 1.5 million in 1991 and 1992, respectively (Henshaw and Van Vort 1993; Koonin et al. 1992).
Overall, women undergoing abortions tend to have had no previous live births and are having the procedure for the first time. The majority are unmarried, white, and young (24 percent under age 19, 33 percent between ages 20-24). About half of all abortions are performed before the eighth week of gestation, five out of six before the thirteenth week; younger women tend to obtain abortions later in pregnancy (Koonin et al. 1992).
From the perspective of proportion of unintended pregnancies that end in abortion, these patterns persist. The most powerful predictor remains marital status: 75 percent of all unintended pregnancies among unmarried women in the United States in 1987 terminated in abortion, compared to 53 and 26 percent among formerly married and currently married women, respectively.
Age is less consistently predictive. Fifty-one percent of unintended pregnancies among women aged 15-19 and women aged 20-24 end in abortion, then there is a slight decline to 47 and 50 percent in women aged 25-29 and 30-34, respectively. The rates jump to 55 percent in women aged 35-39 and to 59 percent in women aged 40-44; in other words, about 6 out of 10 women aged 4044 who experience an unintended pregnancy seek abortion. Poverty status is the weakest predictor: The percentage of women obtaining an abortion to resolve an unintended pregnancy is only slightly lower among affluent women than it is among low-income women (IOM 1995) (refer back to Table 2-6).
There has been a slight diminution in the U.S. abortion rate since the early 1980s. However, it remains two to four times higher than rates in other comparable market economies,10 of which very few have abortion rates even approach-
ing those in the United States, even though access to abortion in those countries is often easier than it is in the United States (see Table 2-9). The high U.S. rate is not a function of a higher incidence of abortion among minority women, as is often thought to be the case; the U.S. abortion rate is higher overall than rates in other market economies, among whites as well as among all U.S. women. The high U.S. rate is due entirely to its higher total pregnancy rate (average number of pregnancies [births plus abortions]) and the high proportion of those pregnancies that are unintended (IOM 1995).
All in all, the popular image of the U.S. woman most likely to elect abortion to resolve an unintended pregnancy—the poor minority teenager—is inaccurate (Kaiser/Harris 1995). Substantial percentages of U.S. women in every age and socioeconomic category terminate unintended pregnancies with abortion; even among currently married women, that proportion is still 26 percent.
Maternal Mortality
Significant gains have been made in infant and child survival in developing countries over the past few decades; much less progress has been made in maternal survival (Rosenfield and Maine 1985). Recent recalculations by WHO and UNICEF indicate that maternal mortality is higher than previously estimated, with some 590,000 maternal deaths worldwide as of 1990, compared to the 509,000 figure calculated from an earlier model (WHO 1996; WHO 1991). The most significant differences between the old and new models are in Africa; estimates for Asia and Latin America changed little. In Africa, the overall revised maternal mortality ratio11 for 1990 was 880 maternal deaths per 100,000 live births, compared to the earlier estimate of 630 per 100,000, with a range from 1,061 in Eastern Africa to 343 in Northern Africa. The ratio for the less developed regions as a group was 586 maternal deaths per 100,000 live births; the overall maternal mortality ratio for the more developed regions in 1990 was 27 (WHO 1996). Expressed somewhat differently, the chance of dying from pregnancy-related causes between 1975 and 1984 ranged from 1 in 9,850 in Western Europe to 1 in 19 in Western Africa (Herz and Measham 1987). Table 2-8 compares the mortality risks associated with pregnancy and selected health procedures—legal abortion, female sterilization, delivery of live birth, cesarean section, illegal abortion, and hysterectomy—in the United States and in the developing countries.
These are much greater discrepancies in maternal mortality rates between developed and developing countries than those observed in connection with infant mortality rates (Rosenfield 1989). Furthermore, there are many reasons for believing that these figures are gross underestimates. Even in the United States in the 1980s, official statistics on maternal mortality were thought to underestimate incidence by 20 to 30 percent, with underestimates in the developing world significantly higher (Rosenfield and Maine 1985). This overall picture is compli-
TABLE 2-9 Abortion Rates per 1,000 Women Aged 15-44, by Country, 1980 and 1985-1992
|
Country |
1980 |
1985 |
1986 |
1987 |
1988 |
1989 |
1990 |
1991 |
1992 |
|
Australia |
13.9 |
15.6 |
16.4 |
16.3 |
16.6 |
— |
— |
— |
— |
|
Belgium |
— |
7.5 |
— |
— |
— |
— |
— |
— |
— |
|
Canada |
12.6 |
11.3 |
11.2 |
11.3 |
11.6 |
12.6 |
14.6 |
14.7 |
14.9 |
|
Denmark |
21.4 |
17.6 |
17.7 |
18.3 |
— |
— |
18.2 |
— |
— |
|
Finland |
— |
12.4 |
— |
11.7 |
— |
— |
11.5 |
— |
— |
|
Francea |
15.3 |
14.6 |
13.9 |
13.3 |
13.2 |
— |
— |
— |
— |
|
Federal Republic of Germany (former)a |
6.6 |
6.1 |
6.3 |
6.6 |
6.3 |
5.6 |
5.8 |
— |
— |
|
Irelandb |
4.8 |
5.2 |
5.2 |
4.8 |
5.0 |
4.9 |
5.4 |
— |
— |
|
Italya |
18.7 |
16.8 |
16.0 |
15.3 |
15.3 |
— |
12.7 |
— |
— |
|
The Netherlandsc |
6.2 |
5.1 |
5.3 |
5.1 |
5.1 |
5.1 |
5.2 |
— |
— |
|
New Zealand |
8.5 |
9.3 |
10.5 |
11.3 |
12.8 |
12.9 |
14.0 |
14.4 |
— |
|
Norway |
16.3 |
16.3 |
17.1 |
16.8 |
17.1 |
17.9 |
16.7 |
— |
— |
|
United States |
29.3 |
28.0 |
27.4 |
26.9 |
27.3 |
26.8 |
27.4 |
26.3 |
25.9 |
|
United States, |
|
|
|
|
|
|
|
|
|
|
whitesd |
24.3 |
22.6 |
21.8 |
21.2 |
21.2 |
20.9 |
21.5 |
20.3 |
— |
|
a Statistics for France, Germany, and Italy may be incomplete. b Abortion is illegal in Ireland and the reported rate is based on abortions obtained in England and Wales by women reporting Irish addresses. c Data from the Netherlands are for residents only. d Data for whites in the United States include most Hispanic women. Sources: Alan Guttmacher Institute. Unpublished data, 1994. Henshaw S, E Morrow. Induced Abortion: A World Review, 1990 Supplement. New York: The Alan Guttmacher Institute, 1990. Henshaw S, J Van Vort. Abortion Services in the United States, 1991 and 1992. Family Planning Perspectives 26:100-106: Table 1, 1993. Canadian Center for Health Information. Therapeutic Abortions, 1991. Ottawa, Ontario: Statistics Canada, 1993. United Nations. Abortion Policies: A Global Review. Vol. II. New York: Department of Economic and Social Development, United Nations, 1993. |
|||||||||
cated by the fact that rates in some population subgroups can be significantly higher. In terms of age, a very early first birth increases a woman's risk of dying from pregnancy-related causes, and adolescent first-births and births at the end of a woman's reproductive period generally are associated with a higher likelihood of pregnancy-related complications.12 Residence also skews the numbers, since rural mortality rates are almost inevitably higher, as they are for very underserved urban slum peripheries. What is clear is that, in general, the likelihood that a woman will die in pregnancy or childbirth depends on how many times she is pregnant. This means that the lifetime risk of maternal mortality is many times greater than ratios indicate because the ratio ignores the effect of repeated pregnancies; each pregnancy adds to total lifetime risk (Walsh et al. 1993).
Sexually Transmitted Reproductive Tract Infections
Of all the health problems that women confront, infection of the reproductive tract is most closely connected with family planning programs. Reproductive tract infections (RTIs), notably the sexually transmitted reproductive tract infections,13 are also positioned at the nexus between female health, safe motherhood, child survival, and HIV prevention, for each of which they have profound implications (Cates and Stone 1992; Wasserheit and Holmes 1992).
Reproductive tract infections, particularly those that are sexually transmitted, are hardly new and, until now, have been traditionally unrecognized in most developing countries as either a necessary or an appropriate component of health programs. What is new is the heightened attention accruing to them as a category of "emerging diseases" (IOM 1992). The recognition that sex is the primary mode of transmission of the HIV virus that results in AIDS, together with the size and flow of donor resources to combat that disease, have ratcheted up interest in RTIs in general and sexually transmitted diseases (STDs) in particular. Interest has also been heightened by recognition of STDs as implicated in cervical cancer and, possibly, hepatocellular cancer and, as diagnostic technology has improved, the sheer number—over 50—of STDs has been revealed. Finally, the momentum of demographic change, intra- and international mobility, relentless urbanization, and economic and political volatility have demonstrated that the burden of morbidity and mortality these diseases generate is a large and global matter (Brunham and Embree 1992; IOM 1992a; Over and Piot 1993).
Any complacency about having conquered the "first-generation" STDs—gonorrhea, syphilis, and chancroid-has been amply challenged both by their recent resurgence virtually worldwide, as well as by a "second generation" of sexually transmitted organisms. The essentially new syndromes associated with four major pathogens—chlamydia, herpes simplex virus (HSV), human papilloma virus (HPV), and the human immunodeficiency virus (HIV)-are more difficult to identify, treat, and control, and they impose a much larger burden of chronic morbidity, disability, and death.
TABLE 2-10 Sexually Transmitted Disease Microbial Agents and the Conditions They Produce in Women and Children
|
Etiologic Agenta Conditions |
Acute Disease |
Pregnancy-associated |
Chronic |
|
Bacteria |
|
|
|
|
Neisseria |
Urethritis |
Premature delivery |
Infertility |
|
gonorrhoeae |
Cervicitis Salpingitis |
Septic abortion Postpartum endometritis Conjunctivitis neonatorum |
Ectopic pregnancy Disseminated gonococcal infection |
|
Chlamydia trachomatis |
Urethritis Cervicitis Salpingitis Reiter's syndrome |
Conjunctivitis Infant pneumonia Postpartum endometritis |
Trachoma Ectopic pregnancy Infertility |
|
Treponema pallidum |
Primary and secondary syphilis |
Spontaneous abortion Stillbirth Congenital syphilis |
Neurosyphilis Cardiovascular syphilis Gumma |
|
Viruses |
|
|
|
|
Human immunodeficiency virus (HIV) |
Acute viral syndrome |
Perinatal HIV Prematurity Stillbirth |
AIDS and related conditions |
|
Human papillomavirus (HPV) |
Genital warts |
Laryngeal papilloma in infants |
Squamous epithelial neoplasias of genitalia |
|
Herpes simplex virus (HSV-2) |
Genital ulcer |
Spontaneous abortion Premature delivery Neonatal herpes and associated mortality Aseptic meningitis |
Primary and recurrent genital herpes Neurological sequelae |
|
Hepatitis B virus (HBV) |
Acute hepatitis |
Perinatal HBV |
Chronic hepatitis Cirrhosis Hepatoma Vasculitis |
|
a Other bacterial STD agents include Mycoplasma hominis , Ureaplasma urealyticum , Gardnerella vaginalis , Calymmatobacterium granulomatis , and Group B ß-hemolytic streptococcus. Other viral STD agents include cytomegalovirus, molluscum contagiosum virus, and human T-lymphotropic virus (HTLV- 1). Trichomonas vaginalis, a protozoan, and Candida albicans, a fungus, are also STD agents. Sources: Brunham RC, JE Embree. Sexually transmitted diseases: Current and future dimensions of the problem in the Third World. IN Reproductive Tract Infections: Global Impact and Priorities for Women's Reproductive Health, A Germain, KK Holmes, P Piot, JN Wasserheit, eds. New York: Plenum. 1992. Cates W Jr. Sexually transmitted diseases. IN Reproductive Health Care for Women and Babies: Analysis of Medical, Economic, Ethical, and Political Issues, BP Sachs, R Beard, et al., eds. New York: Oxford University Press. 1995. Over M, P Piot. HIV infection and sexually transmitted diseases. IN Disease Control Priorities in Developing Countries, DT Jamison, WH Mosley, AR Measham, JL Bobadilla, eds. New York: Oxford University Press, for the World Bank. 1993. |
|||
Sexually transmitted diseases generate a variety of acute and chronic sequelae, particularly for females14 and children (see Table 2-10). In addition, there is an ''epidemiological synergy" between HIV and other STDs, since a number of STDs act in various ways, some poorly understood, as pivotal cofactors in the transmission or acquisition of HIV (Alexander 1990; Laga 1992; Wasserheit 1992). HIV is, of course, incurable and almost inevitably lethal, and perinatal transmission occurs in about 20 to 30 percent of births in each pregnancy to infected mothers (Gwinn et al. 1991). However, a number of other STDs (HSV, HPV, and hepatitis B [HBV]) are also incurable, are transmissible perinatally, and produce high levels of morbidity in both mother and child. And, beyond their large biomedical and emotional burdens, the STDs as a group—particularly HIV/AIDS—produce sizable socioeconomic costs to societies and individuals everywhere; their dimensions are discussed in Chapter 5 (Over and Piot 1993). This is acutely distressing since, at least in theory, all RTIs are preventable or treatable and a number of nonviral infections are curable, although drug resistance is emerging in some strains (Chen et al. 1992; Germain et al. 1992; Stein 1990; Wasserheit and Holmes 1992).
Like unintended pregnancy, STDs display what has been called "biological sexism," since they discriminate biologically against women. Females and males alike are at risk of sexually transmitted disease. However, female physiology and symptomatology, as well as the behavior patterns associated with these diseases, put females at greater risk of (a) acquiring an STD, especially at an earlier age; (b) acquiring a sexually transmitted infection from any single sexual encounter; (c) more difficult diagnosis; (d) speedier progression of concurrent disease; (e) more severe, long-term, systemic sequelae, including PID, ectopic pregnancy, chronic pain, and cervical cancer; and (f) inappropriate or untimely medical care (Cates and Stone 1992; Hatcher et al. 1994).
Because both pregnancy and infection are "transmitted" through sexual intercourse, women need three types of effective protection, depending on their own reproductive desires and circumstances. If they do not wish to become pregnant, they require protection against both conception and infection simultaneously. If they have no reason to anticipate sexually transmitted infection, they still may require protection against conception. Finally, if women want to become pregnant but also require protection against infection, they need another kind of protection, usually labeled a microbicide. Women have a much higher risk of acquiring an STD from a single coital event—in the case of gonorrhea, risk of acquisition is 25 percent for men and 50 percent for females—so that every single coital event must be protected.
At the present time, only abstinence provides complete protection against sexually transmitted reproductive tract infections.15 Male and female condoms, when used properly, also provide good protection, although many women encounter male resistance to using either type of condom. All other contraceptives
TABLE 2-11 Effects of Contraceptives on Bacterial and Viral Sexually Transmitted Diseases (STDs)
|
Contraceptive Methods |
Bacterial STD |
Viral STD |
||||
|
Condoms |
Protective |
Protective |
||||
|
Spermicides |
Protective against cervical gonorrhea and chlamydia |
Undetermined in vivo |
||||
|
Diaphragms |
Protective against cervical infection; associated with vaginal anaerobic overgrowth |
Protective against cervical infection |
||||
|
Hormonal |
Associated with increased cervical chlamydia; protective against symptomatic pelvic inflammatory disease (PID) |
Not protective |
||||
|
Intrauterine Device |
Associated with PID in first 20 days after insertion |
Not protective |
||||
|
Natural family planning |
Not protective |
Not protective |
||||
|
Source: Cates W Jr, KM Stone. Family planning: The responsibility to prevent both pregnancy and reproductive tract infections. IN Reproductive Tract Infections: Global Impact and Priorities for Women's Reproductive Health, A Germain, KK Holmes, P Piot, JN Wasserheit, eds. New York: Plenum Press. 1992. |
||||||
provide protection against only some STDs (see Table 2-11), although this is not trivial since other STDs are part of the susceptibility pattern for HIV/AIDS (Laga 1992). In sum, only one modern contraceptive is currently on the market that protects men and women against sexually transmitted disease: the condom, whose protective power depends heavily on perfect use.16 In all cases, women must contend with the power imbalance between the sexes that favors men (Aral and Guinan 1984; Cates and Stone 1992; Larson 1989). Thus, there is a compelling need for safe and effective contraceptive and microbicidal methods that women can use without the cooperation, or consent, of their male partner (Claypool 1994; Stein 1990).
Involvement of Males in Contraception
The Alan Guttmacher Institute recently commented that, since men's role in contraceptive use is so typically small, the question about what couples are doing to avoid unintended pregnancies should be, What are women doing? The 1995
TABLE 2-12 Percentage of Couplesa Using Male Methods of Contraception b
|
Country |
% |
Country |
% |
|
Japan |
54 |
Jordan |
5 |
|
United States |
22c |
Pakistan |
4 |
|
China |
12 |
Cameroon |
3 |
|
Philippines |
9 |
Egypt |
3 |
|
Colombia |
8 |
Guatemala |
3 |
|
Thailand |
8 |
Indonesia |
2 |
|
France |
7 |
Kenya |
2 |
|
Mexico |
6 |
Nigeria |
1 |
|
a In the countries of North Africa, the Middle East, and Asia, only currently married women aged 15-49 are included; data for all other countries are for married women and those in other sexual relationships. b Male methods include withdrawal, condom, and vasectomy. c Data for the United States are from special analyses of the 1988 National Survey of Family Growth, which surveyed 8,450 women of all marital statuses aged 15-44, supplemented by data from other national sources. This figure may be higher: Hatcher et al. give a figure of 25.7 percent for couples (women aged 15-44) in the United States using male methods (Hatcher RA, J Trussell, F Stewart, et al., Contraceptive Technology-16th Revised Edition, New York, Irvington Publishers, 1994, Table 5-1). Source: Alan Guttmacher Institute. Hope and Realities: The Gap Between Women's Aspirations and Their Reproductive Experiences. New York: The Alan Guttmacher Institute. 1995. |
|||
Guttmacher analysis of the latest data from the Demographic and Health Surveys (DHS) finds that the proportion of couples relying on male methods-the condom, withdrawal, or vasectomy-ranges from 1 to 12 percent in most countries. In Japan, where the condom is the leading contraceptive method in overall use, the proportion of couples who rely on male methods is 54 percent; in the United States, where the condom and vasectomy are both important, estimates of couple use of male methods range from 22 percent (Guttmacher Institute 1995a) to 27.5 percent (Hatcher et al. 1994)(see Table 2-12). The Guttmacher analysis also found that, in the limited number of countries where the DHS collected such information, even when husbands know of at least one contraceptive method, they do not commonly discuss family planning with their wives, at least as reported by women (see Table 2-13 and Table 2-14).
In a slightly different set of countries, with only one exception (Burundi),
women wanted a smaller family size than did their husbands, although in all the Sub-Saharan African countries women still desired rather large families (see Table 2-15). In this same sample, however, while smaller proportions of husbands than of wives said that they did not want any more children, the differences between husbands and wives in this respect were not very large, ranging from 4 to 9 percentage points (Guttmacher Institute 1995a).
The presumption has been that men's limited involvement in contraception is driven by the fundamental gestalt that, in virtually all societies, defines the roles, status, and power of females as inferior and subordinate to those of males. This presumption has, in turn, driven the historical emphasis placed by family planning programs on women, to the virtually a priori exclusion of men (Kabeer 1992; Sachs 1994; Sadik 1995). Except for the Population Council's intramural basic science research program, which has included attention to development of male contraceptives, that presumption has also driven the investment in contraceptive research and development, at least partly because of the view that male interest in being involved in contraceptive use was quite limited in most populations. As a consequence, men did not benefit from the first contraceptive revolution.
That view has been something of a self-fulfilling prophecy (Population Reports 1994) and has been tested in only a fragmentary way; most reports on male attitudes toward contraception have come from women. However, as some countries have gathered data on male perceptions of contraception in connection with the Demographic and Health Surveys, there appears to be more heterogeneity in male attitudes than might be expected, even in Africa, where high fertility has deep cultural and socioeconomic roots (UNFPA 1995). At the same time, there is no question that greater male involvement in contraception is a large and commanding need in terms of public health and the well-being of children and the family.
The need is no less in the United States, where one in 15 men fathers a child while he is a teenager (Marsiglio 1987) and where attention is now being given to the possibility of expanding family planning clinic services to men (Burt et al. 1994). The rationales include the need to include male partners in STD testing, treatment, and education; adding services for men as part of managed care marketing strategies; and the national emphasis on male responsibility in welfare and child support enforcement programs, an integral part of every welfare reform program currently under consideration by the U.S. Congress (Schulte and Sonenstein 1995). The topic of male participation in contraception is taken up in more detail in the next chapter in connection with the use of male methods and the market for contraceptives.
Concluding Comment
At the outset of this chapter, "needs" were defined as "a state of felt depriva-
TABLE 2-13 Husbands' Involvement in Family Planning Decisions (selected countries)
|
Country and Survey Year |
No. of Intervieweesa |
% Who Know of at Least One Method |
% Approving of Family Planning (FP) |
% Who Have Discussed FP with Their Wives in the Last Yearb |
% Who Have Ever Used Contraception |
% Currently Using Contraception |
% Family Member Deciding |
||||
|
Modern |
Any |
Modern |
Any |
W |
H |
J |
|||||
|
Burundi, 1987 |
542 |
92 |
94 |
48 |
2 |
52 |
NA |
NA |
— |
— |
— |
|
Cameroon, 1991 |
814 |
74 |
37 |
30 |
17 |
48 |
6 |
20 |
— |
— |
— |
|
Egypt, 1988-1989 |
9,000 (women) |
— |
— |
— |
— |
— |
— |
— |
14 |
25 |
61 |
|
Cairo |
469 |
100 |
92 |
61 |
78 |
81 |
65 |
70 |
— |
— |
— |
|
Upper Egypt |
1,053 |
96 |
84 |
47 |
52 |
56 |
40 |
44 |
4 |
59 |
36 |
|
Ghana, 1988 |
943 |
79 |
77 |
46 |
26 |
41 |
9 |
20 |
— |
— |
— |
|
India, 1986 (rural) |
250 (women) |
— |
— |
— |
— |
— |
— |
— |
4 |
24 |
38d |
|
Kenya, 1989 |
1,170 |
95 |
91 |
65 |
35 |
65 |
25 |
49 |
— |
— |
— |
|
Mali, 1987c |
970 |
65 |
16 |
28 |
2 |
16 |
1 |
4 |
— |
— |
— |
|
Morocco, 1992 |
— |
— |
— |
47 |
— |
— |
— |
— |
— |
— |
— |
|
Niger, 1992 |
— |
— |
— |
11 |
— |
— |
— |
— |
— |
— |
— |
|
Pakistan, 1990-91 |
1,354 |
79 |
56 |
14 |
18 |
25 |
10 |
15 |
— |
— |
— |
|
Turkey, 1991 |
|
|
|
|
|
|
|
|
|
|
|
|
Semi-urban (women) |
366 |
— |
— |
— |
— |
— |
— |
— |
62 |
8 |
25 |
|
Rural (women) |
358 |
— |
— |
— |
— |
— |
— |
— |
29 |
23 |
46 |
|
Note: NA = not applicable; W = wife, H = husband, J = joint. a Husbands, except where otherwise noted. b Among those who knew at least one contraceptive method. c Includes all men, regardless of marital status. d 22 percent of the family planning decisions in rural India in this survey were made by the extended family. Sources: Derived from tables in McCauley AP, B Robey, AK Blanc, JS Geller, Opportunities for women through reproductive choice, Population Reports, Series M, No.12, July 1994. Data for Morocco and Niger are from Hopes and Realities: Closing the Gap Between Women's Aspirations and Their Reproductive Experiences, New York, The Alan Guttmacher Institute, 1995. |
|||||||||||
TABLE 2-14 Women's Discussion of Family Planning with Their Husbands (selected countries)
|
Country and Survey Year |
% Using Family Planning Among Those Who: Discussed with Husband |
Did Not Discuss with Husband |
|
Botswana, 1988 |
40 |
18 |
|
Burundi, 1987 |
14 |
2 |
|
Ghana, 1988 |
24 |
7 |
|
Kenya, 1986 |
36 |
11 |
|
Senegal, 1986 |
23 |
9 |
|
Sudan, 1989-1990 |
19 |
3 |
|
Togo, 1988 |
39 |
31 |
|
Source: Based on graphics in Hopes and Realities: Closing the Gap Between Women's Aspirations and Their Reproductive Experiences, New York, The Alan Guttmacher Institute, 1995 (based on data from Demographic and Health Survey country reports, with special tabulations of the data files for Pakistan). |
||
tion of some basic satisfaction." We have spoken about the general areas of need that have to do with societal and individual health and options and that make contraception a commanding issue for societies and individuals who wish to use it. We have also indicated that, beyond these general areas of need, there are very specific needs for new technologies that are not now being satisfied adequately. A new approach to estimating the overall unmet need for contraception identifies somewhere around 228 million women worldwide (not men, whose needs must also be taken into separate account) who can fairly be said to be in need of contraception. Overwhelming majorities of women want to control their fertility, even in Sub-Saharan Africa with its traditionally high value accorded to large families. And very large numbers of women, even those who have not yet achieved their desired family size, nonetheless state that they failed in their intentions with regard to their last pregnancy, either because they did not mean to have it at all or because they meant to have it at some later date.
Another dimension of general need is the sheer number of years women require protection from unintended pregnancy since, somewhat ironically, as completed family size continues to fall worldwide, women's lifetime exposure increases; a woman who wants only two children will require 20 years of protec-
TABLE 2-15 Male Perspectives on Desired Family Size
|
|
Desired Family Size |
% Wanting No More Children |
||
|
Country |
Husbands |
Wives |
Husbands |
Wives |
|
Niger |
12.6 |
8.5 |
2 |
9 |
|
Cameroon |
11.2 |
7.3 |
10 |
14 |
|
Tanzania |
7.4 |
6.4 |
17 |
23 |
|
Burundi |
5.5 |
5.5 |
— |
— |
|
Ghana |
6.6 |
5.5 |
19 |
23 |
|
Pakistan |
5.4 |
5.3 |
33 |
40 |
|
Morocco |
4.1 |
3.9 |
43 |
52 |
|
Kenya |
4.1 |
3.9 |
44 |
52 |
|
Egypt |
3.3 |
2.8 |
61 |
67 |
|
Source: Based on graphics in Hopes and Realities: Closing the Gap Between Women's Aspirations and Their Reproductive Experiences. New York: The Alan Guttmacher Institute. 1995 (based on data from Demographic and Health Survey country reports, with special tabulations of the data files for Pakistan). |
||||
tion from that exposure. This means that, for a number of reasons, the same contraceptive is unlikely to be appropriate for an ever-longer and more biologically various life span, thus requiring a more various set of contraceptive alternatives.
Ancillary analyses tell us about other aspects of the general need for contraception. These include the women all over the world, still in their teens, whose physical well-being and life chances are at special risk: young women spending longer periods of time before entering into formal union, with a greater amount of sexual activity than seems to have been the case in the past; young women following tradition and continuing to enter union very early; and those young women of whom one-quarter to one-half are having their first child before any formal union. These are not exclusively Third World phenomena: In 1987, 1.2 million pregnancies occurred in the United States among women under 20, almost all of which were resolved outside marriage, with about half of those terminating in abortion. This is, of course, part of a bigger picture: The 1995 projection for the number of abortions worldwide is 52 million-28 percent of the 139 million live births projected for this year-about 21 million of which will be performed in countries where they are illegal and, presumably, unsafe. If so
many women are resolving their pregnancies in this fashion, one must assume they need contraceptive help.
In Chapter 5 we will focus on those specific areas that point to a need for new contraceptive technologies, not only because they expand the range of contraceptive options overall, in itself a compelling need, but because they fill needs that are not now being met adequately. These include the need for contraceptives suitable for women who have been exposed to unprotected sexual intercourse, contraceptives with anti-infective properties, and methods for men.
References
Alan Guttmacher Institute. Hopes and Realities: The Gap Between Women's Aspirations and Their Reproductive Experiences. New York: The Alan Guttmacher Institute. 1995a.
Alan Guttmacher Institute. Women, Families, and the Future: Sexual Relationships and Marriage Worldwide (Fact Sheet). New York: The Alan Guttmacher Institute. 1995b.
Alexander, NJ. Sexual transmission of human immunodeficiency virus: Virus entry into the male and female genital tract. Fertility and Sterility 54(1): 1-18, 1990.
Aral SO, ME Guinan. Women and sexually transmitted diseases. IN Sexually Transmitted Diseases. KK Holmes, P-A Mardh, PF Sparling, PJ Wiesner, eds. New York: McGraw-Hill. 1984.
Brandrup-Lukunow A. Family Planning and Reproductive Health in CCEE/NIS: Background Paper for ECO/UNFPA Conference on Women's Status and Health. Copenhagen: WHO-EURO. 1995.
Brunham RC, JE Embree. Sexually transmitted diseases: Current and future dimensions of the problem in the Third World. IN Reproductive Tract Infections: Global Impact and Priorities for Women's Reproductive Health. A Germain, KK Holmes, P Piot, JN Wasserheit, eds. New York: Plenum. 1992.
Burt MR, LY Aron, LR Schack. Family Planning Clinics: Current Status and Recent Changes in Services, Clients, Staffing, and Income Sources-Report to The Henry J. Kaiser Family Foundation. Washington, DC: The Urban Institute. 1994.
Cates W Jr, KM Stone. Family planning: The responsibility to prevent both pregnancy and reproductive tract infection. IN Reproductive Tract Infections: Global Impact and Priorities for Women's Reproductive Health. A Germain, KK Holmes, P Piot, JN Wasserheit, eds. New York: Plenum. 1992.
Chen L, J Sepulveda, S Segal, eds. AIDS and Women's Health: Science for Policy and Action. New York: Plenum. 1992.
Chen V. A new social norm: All pregnancies intended. Carnegie Quarterly, Fall 1994-Winter 1995:10-11, 1995.
Claypool LE. The challenges ahead: Implications of STDs/AIDS for contraceptive research. IN Contraceptive Research and Development 1954 to 1994: The Road from Mexico City to Cairo and Beyond. PFA Van Look , G Pérez-Palacios, eds. Delhi: Oxford University Press. 1994.
Dixon-Mueller R, A Germain. Unmet need from a woman's health perspective. Planned Parenthood Challenges 1:9-12, 1994.
Dixon-Mueller R, A Germain. Stalking the elusive "unmet need" for family planning. Studies in Family Planning 23(5):330-335, 1992.
Fathalla M. Reproductive health in the world: Two decades of progress and the challenge ahead. IN Reproductive Health: A Key to a Brighter Future, J Khanna et al., eds. Geneva: World Health Organization. 1992.
Forrest JD. Epidemiology of unintended pregnancy and contraceptive use. American Journal of Obstetrics and Gynecology 170(5, Part 2):1485-1489, 1994.
Forrest JD. Timing of reproductive life stages. Obstetrics and Gynecology 82(1):105-111, 1993.
Fortney JA. Contraception—A lifelong perspective. IN Dying for Love: New Perspectives on Human Reproduction. Washington, DC: National Council for International Health. 1989.
Freedman R. Family planning programs in the Third World. Annals of the American Academy of Political Science 510:41, 1990.
Gelijns AC, CO Pannenborg. The development of contraceptive technology: Case studies of incentives and disincentives to innovation. International Journal of Technology Assessment 9(2):210-232, 1993.
Germain A, KK Holmes, P Piot, JN Wasserheit, eds. Reproductive Tract Infections: Global Impact and Priorities for Women's Reproductive Health. New York: Plenum. 1992.
Geronimus AT. Teenage childbearing and social disadvantage—Unprotected discourse. Family Relations 41:244-248, 1992.
Geronimus AT, S Korenman. The socioeconomic costs of teenage childbearing: Evidence and interpretation. Demography 30(2):281-296, 1993.
Geronimus AT, S Korenman. The socioeconomic consequences of teen childbearing reconsidered. Quarterly Journal of Economics 107:1187-1214, 1992.
Guttmacher Institute. See Alan Guttmacher Institute.
Gwinn M, M Pappaioanou, JR George, et al. Prevalence of HIV infection in childbearing women in the United States. Journal of the American Medical Association 265(13): 1704-1708, 1991.
Hatcher RA, J Trussell, F Stewart, et al. Contraceptive Technology: 16th Revised Edition. New York: Irvington Publishers. 1994.
Henshaw SK. Induced abortion: A world view, 1990. Family Planning Perspectives 22:76-89, 1990.
Henshaw SK, JD Forrest. Women at Risk of Unintended Pregnancy, 1990 Estimates: The Need for Family Planning Services, Each State and County. New York: The Alan Guttmacher Institute, 1993.
Henshaw SK, J Van Vort. Abortion services in the United States, 1991 and 1992. Family Planning Perspectives 26:100-106, 1993.
Herz B, AR Measham. The Safe Motherhood Initiative: Proposals for Action. Discussion Paper No. 9. Washington, DC: World Bank. 1987.
Hoffman SD, EM Foster, FF Furstenberg Jr. Revaluating the costs of teenage childbearing: Response to Geronimus and Korenman. Demography 30:291-296, 1993.
Institute of Medicine (IOM). In Her Lifetime: Female Morbidity and Mortality in Sub-Saharan Africa . M Law, CP Howson, PF Harrison, D Hotra, eds. Washington, DC: National Academy Press. 1996.
IOM. The Best Intentions: Unintended Pregnancy and the Well-Being of Children and Families. S Brown and L Eisenberg, eds. Washington, DC: National Academy Press. 1995.
IOM. Emerging Infections: Microbial Threats to Health in the United States. J Lederberg, RE Shope, SC Oaks Jr, eds. Washington, DC: National Academy Press. 1992.
Kabeer N. From Fertility Reduction to Reproductive Choice: Gender Perspectives on Family Planning. Institute of Development Studies Discussion Paper 299. Brighton, UK: University of Sussex. 1992.
Kaiser/Harris. National Survey Results on Public Knowledge of Abortion Rates. Menlo Park, CA: The Henry J. Kaiser Family Foundation. January 1995.
Ketting E. Global unmet need: Present and future. Planned Parenthood Challenges 1:31-34, 1994b.
King TM, JB Smith. From menarche to menopause: The contraceptive transition. IN Contraceptive Research and Development 1984 to 1994: The Road from Mexico City to Cairo and Beyond. PFA Van Look, G Pérez-Palacios, eds. Geneva: World Health Organization. 1994.
Koonin LM, JC Smith, et al. Abortion surveillance—United States. Mortality and Morbidity Weekly Report I (SS-5):1-33, 1992.
Kotler P. Marketing Management. Englewood Cliffs, NJ: Prentice Hall. 1988.
Kubicka I, Z Matejcek et al. Prague children from unwanted pregnancies revisited at age thirty. Submitted for publication, 1994, cited in The Best Intentions: Unintended Pregnancy and the Well-Being of Children and Families. S Brown, L Eisenberg, eds. Washington, DC: National Academy Press. 1995.
Kwast BE, RW Rochat, W Kidane-Mariam. Maternal mortality in Addis Ababa, Ethiopia. Studies in Family Planning 17:288-301, 1986.
Laga M. Human immunodeficiency virus infection prevention: The need for complementary STD control. IN Reproductive Tract Infections: Global Impact and Priorities for Women's Reproductive Health. A Germain, KK Holmes, P Piot, JN Wasserheit, eds. New York: Plenum. 1992.
Larson A. Social context of human immunodeficiency virus transmission in Africa: Historical and cultural bases of East and Central African sexual relations . Review of Infectious Diseases 11:716-724, 1989.
Lee PR, FH Stewart. Failing to prevent unintended pregnancy is costly. (Editorial). American Journal of Public Health 85(4):479-480, 1995.
Lotz P. Demand as a driving force in medical innovation. International Journal of Technology Assessment 9(2):174-188, 1993.
Luker K. Dubious conceptions: The controversy over teen pregnancy. American Prospective, 1991: 73-83, 1991.
Marsiglio W. Adolescent fathers in the United States: Their initial living arrangements, marital experience, and educational outcomes. Family Planning Perspectives 19(6):240-251, 1987.
McCauley AP, B Robey, AK Blanc, JS Geller. Opportunities for women through reproductive choice. Population Reports, Series M, No. 12 (Special topics), July 1994.
Meheus A. Women's health: Importance of reproductive tract infections, pelvic inflammatory disease and cervical cancer. IN Reproductive Tract Infections: Global Impact and Priorities for Women's Reproductive Health. A Germain, KK Holmes, P Piot, JN Wasserheit, eds. New York: Plenum. 1992.
Mosley WH, JL Bobadilla, DT Jamison. The health transition: Implications for health policy in developing countries. IN Disease Control Priorities in the Developing World. DT Jamison, WH Mosley, AR Measham, JL Bobadilla, eds. New York: Oxford University Press. 1993.
Mowery DC, N Rosenberg. The influence of market demand upon innovation: A critical review of some recent empirical studies. IN Inside the Black Box: Technology and Economics. N Rosenberg, ed. Cambridge, MA: Cambridge University Press. 1982.
Nelson RR, SG Winger. In search of a useful theory of innovation. Research Policy 6:36-76, 1977.
Over M, P Piot. HIV infection and sexually transmitted diseases. IN Disease Control Priorities in the Developing World. DT Jamison, WH Mosley, AR Measham, JL Bobadilla, eds. New York: Oxford University Press. 1993.
Population Reports. Opportunities for Women Through Reproductive Choice. Series M, No. 12, July 1994.
Robey B, SO Rutstein, L Morris, R Blackburn. The reproductive revolution: New survey findings. Population Reports, Series M. No. 11. Baltimore: Johns Hopkins School of Public Health, Population Information Program. 1992.
Rosenfield A. Maternal mortality in developing countries: An ongoing but neglected epidemic. Journal of the American Medical Association 262(3):376-379, 1989.
Rosenfield A, D Maine. Maternal mortality—A neglected tragedy: Where is the M in MCH? Lancet, 13 July: 83-85, 1985.
Sachs A. Men, sex, and parenthood. World Watch, March-April: 12-19, 1994.
Sadik N. The State of World Population 1995—Decisions for Development: Women, Empowerment and Reproductive Health. New York: United Nations Population Fund. 1995.
Stein Z. HIV prevention: The need for methods women can use. American Journal of Public Health 80:460-462, 1990.
Teubal M, N Arnon, M Trachtenberg. Performance in innovation in the Israeli electronics industry: A case study of biomedical electronics instrumentation. Research Policy 5:354-379, 1976.
Tinker A, P Daly, C Green, et al. Women's Health and Nutrition: Making a Difference. Discussion Paper 246. Washington, DC: World Bank. 1994.
Trussell J, J Koenig, C Ellertson, F Stewart. Emergency Contraception: A Cost-Effective Approach to Preventing Unintended Pregnancy. Unpublished manuscript. Princeton, NJ: Office of Population Research. November 1995.
United Nations Population Fund (UNFPA). Programme Advisory Note: Male Involvement in Reproductive Health. New York: UNFPA. 1995.
UNFPA. Programme of Action of the United Nations International Conference on Population and Development. Cairo and New York: UNFPA. 1994.
Walsh JA, CM Feifer, et al. Maternal and perinatal health. IN Disease Control Priorities in Developing Countries. DT Jamison, WH Mosley et al., eds. New York: Oxford University Press. 1993.
Wasserheit, JN. Epidemiological synergy: Interrelationships between human immunodeficiency virus infection and other sexually transmitted diseases. IN AIDS and Women's Health: Science for Policy and Action. L Chen, J Sepulveda, S Segal, eds. New York: Plenum. 1992.
Wasserheit JN, KK Holmes. Reproductive tract infections: Challenges for international health policy, programs, and research. IN Reproductive Tract Infections: Global Impact and Priorities for Women's Reproductive Health. A Germain, KK Holmes, P Piot, JN Wasserheit, eds. New York: Plenum. 1992.
Westoff CF. Reproductive Preferences: A Comparative View. Demographic and Health Surveys, Comparative Studies, No. 3. Columbia, MD: Institute for Resource Development. 1991.
Westoff CF, LH Ochoa. Unmet Need and the Demand for Family Planning. Demographic and Health Surveys, Comparative Studies, No. 5. Columbia, MD: Institute for Resource Development. 1991.
Williams LB, WF Pratt. Wanted and unwanted childbearing in the United States: 1973-1988. Advance data from Vital and Health Statistics, No. 189. Hyattsville, MD: National Center for Health Statistics. 1990.
World Bank. A New Agenda for Women's Health and Nutrition. Washington, DC: World Bank. 1994.
World Bank. World Development Report 1993: Investing in Health. New York: Oxford University Press. 1993.
World Health Organization (WHO). Maternal mortality and morbidity. IN 1996 World Population Monitoring Report (draft version). New York: United Nations Population Fund, Population Division. 1996.
WHO. Abortion: A Tabulation of Available Data on the Frequency and Mortality of Unsafe Abortion, 2nd ed. Geneva: Division of Family Health, World Health Organization. 1994.
WHO. Maternal Mortality: A Global Factbook. Geneva: World Health Organization. 1991.
WHO. Prevention of Maternal Mortality: Report of a WHO Interregional Meeting, Geneva, 11-15 November 1985. Mimeo. Geneva: World Health Organization. 1986.
Wulf D. The Unmet Demand for Family Planning. Unpublished manuscript. New York: The Rockefeller Foundation. 1995.
Notes
-
3.
"Presumed" refers to the fact that it is not absolutely guaranteed that no unintended pregnancy will not occur.
-
admitting only to spontaneous abortion in Mérida, Mexico, in 1979, 77 percent later admitted that the abortion had been induced" (WHO 1994). Nevertheless, the WHO document from which this citation was taken is as thorough and recent a compendium as exists anywhere and should be considered definitive at this point in time. Still, as the document itself indicates, the numbers provided, especially the numbers of unsafe abortions, should be considered undercounts. This is so even in the United States.
-
11.
The term "rate" has been traditionally used for this figure; it is, however, really a ratio and measures obstetric risk .


