
5
Domestic (Jones Act) Tanker Trade
This chapter examines the economic viability of the domestic (Jones Act) petroleum transportation industry1 in light of the double-hull requirements of Section 4115 of the Oil Pollution Act of 1990 (OPA 90). Under the terms of what is commonly called the Jones Act (the formal name being the Merchant Marine Act of 1920),2 shipping between any two points in the United States is restricted to U.S.-registered vessels owned by U.S. citizens and crewed by U.S. seafarers, built in the United States without construction differential subsidies (CDS) and operated without operating differential subsidies (ODS).3,4 Accordingly, foreign tankers are precluded from operating in the U.S. domestic trade.
The domestic tanker industry carries approximately 4 million barrels per day of oil (MBD), equivalent to about half the amount imported into the United States. Domestic trade consists of the Alaskan crude oil trade and the coastal products trade. The Alaskan crude oil trade utilizes large tankers (50,000 to 265,000 DWT)
hauling Alaskan crude oil from the terminus of the Trans-Alaska Pipeline System (TAPS) to the U.S. west coast, Panama (for transshipment to Gulf and east coast refineries), and Hawaii. As of June 1996, the export of crude oil from the Alaskan North Slope (ANS) to foreign countries has been permitted, provided the oil is carried on U.S. flag vessels.
The coastal products trade primarily involves the movement of petroleum products from Gulf coast refineries to east coast distribution terminals. The coastal trade also includes the movement of methyl tertiary-butyl ether and petroleum blend and feed stocks from the Gulf to the west coast, the transportation of petroleum products along the west coast, and the shipment of petroleum products from refineries in the U.S. Virgin Islands and Puerto Rico. The vessels in these trades are tank-ships of 18,000 to 50,000 DWT and coastal barges and integrated tug-barges (ITBs) of less than 10,000 DWT up to 50,000 DWT. Small crude tankers (50,000 to 70,000 DWT) also operate in the coastal products trade, depending on market conditions. The committee's analysis assumes that these vessels are available for ANS trade but not for the coastal products trade.
Jones Act tank vessel trade is highly competitive.5 The market is characterized by a competitive structure and behavior with low barriers to entry. In addition to competition with other vessels, tank vessels in the domestic trade compete with the highly developed land-based pipeline transportation system in the United States and with foreign tankers carrying refined petroleum products to U.S. ports.
The U.S. Maritime Administration (MARAD), part of the U.S. Department of Transportation (DOT), is charged with promoting the U.S. merchant marine and shipbuilding industry. This is accomplished through a variety of programs, such as Title XI financing guarantees.6 MARAD is responsible for overseeing the Jones Act trades and ensuring that the supply of vessels is adequate. MARAD has the authority to grant waivers allowing noneligible vessels to operate on domestic routes. These waivers are issued to prevent any interruption of service and to moderate increases in freight rates when a shortage of vessels occurs. For example, MARAD granted waivers for limited periods in the late 1970s and early 1980s that allowed tankers built with construction differential subsidies to enter the Alaskan crude oil trade.
Jones Act tank vessels are subject to the retirement provisions of Section 4115 of OPA 90, but they are not subject to the retirement provisions of the MARPOL Regulation I/13G (MARPOL 13G), which the United States has not ratified.
TABLE 5-1 Jones Act Tank Vessel Fleet by Hull Type
|
Tank Vessel Type |
All Hull Types (number) |
All Hull Types (DWT) |
Double Hull (number) |
Double Hull (DWT) |
|
Tankers > 50,000 DWT |
44 |
4.8 |
3 |
0.4 |
|
Tankers < 50,000 DWT |
72 |
2.7 |
20 |
0.7 |
|
Coastal barges |
93 |
1.7 |
17 |
0.4 |
|
ITBs |
13 |
0.5 |
3 |
0.1 |
|
Total |
222 |
9.7 |
43 |
1.6 |
Tank Vessel Supply
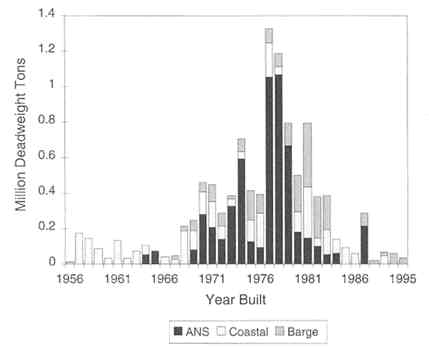
As of August 1995, the Jones Act fleet consisted of 222 tankers, tank barges, and ITBs with a total capacity of 9.7 million DWT.7 Single-hull vessels that are subject to retirement by 2015 under OPA 90 account for 85 percent of the total deadweight capacity. The composition of the fleet by hull type is shown in Table 5-1.
Figure 5-1 shows the construction dates of vessels in the fleet, which is considerably older on average than the world fleet (see Figure 4-2). The peak years of construction reflect the opening of TAPS.
Alaskan Crude Oil Trade
The fleet of Jones Act crude oil tankers exceeding 50,000 DWT consists of 44 tankers with a total capacity of approximately 4.8 million DWT. Only three of these tankers have double hulls;8 the other 41 will be phased out of service under OPA 90. The available supply shown in Figure 5-2 is based on the OPA 90 retirement schedule (i.e., no retirements for economic or other reasons are included). The supply figures do not include four 165,000 DWT tankers controlled by British Petroleum (BP) and operated under the Jones Act by Keystone Shipping Company and Interocean Management that were withdrawn from service in 1995. It is uncertain whether BP will fit double-hull forebodies on the existing ships or build new double-hull tankers. Two rebuilt 125,000 DWT double-hull vessels controlled by BP are included in the tanker supply beginning
in 2000. It is assumed that no other tankers will be added to the supply of vessels exceeding 50,000 DWT. The supply also includes the potential impact of readmeasurement. This impact is assumed to be modest, based on identification of likely candidates for readmeasurement by the U.S. Coast Guard (USCG) and MARAD.9 The lower curve in the figure shows the potential supply without conversions or readmeasurement.
Coastal Products Trade
Supply of Jones Act Tankers of Less Than 50,000 DWT
According to MARAD, there are 72 tankers totaling 2.7 million DWT in the coastal products trade,10 of which 20 tankers (with a total capacity of 700,000 DWT) have double hulls. Four American Heavy Lift vessels that are presently being converted to double hulls at Avondale Shipyard and five Double Eagle double-hull tankers under construction for Hvide Van Ommeren Tankers L.L.C. at Newport News Shipbuilding are included in the supply.11 Figure 5-3 shows the impact of retirements on the tanker fleet of less than 50,000 DWT through 2015. Also shown is the potential impact of readmeasurement and the entry of tankers originally constructed with CDS that will likely be able to enter the Jones Act trade after reaching 20 years of age.
Supply of Tank Barges and ITBs
According to MARAD, 93 barges exceeding 5,000 gross tons (GT) will be affected by Section 4115 of OPA 90. Seventeen are double hulls that will not be retired pursuant to OPA 90. The remaining 76 are single hulls that will be phased out by 2010. There are also 13 ITBs, of which three have double hulls. The supply of tank barges and ITBs through 2015 is shown in Figure 5-4.

Supply-Demand Balance
ANS Crude Oil Tanker Trade
The key factors in projecting the demand and supply of vessels used in the ANS crude trade are projected ANS production, tanker fleet capacity utilization, and exports of ANS crude to the Far East.
Estimates of ANS production over the next 20 years vary greatly, as shown in Figure 5-5. The Energy Information Administration (EIA) Reference case is the lowest estimate, PIRA's, the highest. The Alaska Department of Revenue (ADR) projection falls between these two estimates, except after about 2010. Both the EIA Reference case and the EIA High Oil Price case show increasing production after the 2010-2012 time period, but ADR shows a continuing decline (State of Alaska, 1995). This latter ANS production forecast assumes that no new fields are brought on-line, that the Alaskan National Wildlife Refuge is not successfully developed, and that existing high marginal cost fields, not on-line, remain off-line.
FIGURE 5-5 Forecasts of Alaskan oil production. Sources: EIA, 1996; State of Alaska, 1995; PIRA, 1996.
Each of the three major producers in Alaska—Exxon, BP, and ARCO—uses its own proprietary fleet,12 with additional tonnage chartered when necessary. Under these circumstances, the adequacy of tonnage of each company depends to some degree on how efficiently it uses its own fleet. Since the passage of OPA 90, some producers have been reluctant to use their own ships to carry oil for others because of liability concerns. This may result in lower productivity when one producer has excess tonnage available while another is short. Nonetheless, utilization rates can be expected to rise as the supply of available ships tightens, thus delaying any tanker shortage.
Exports of ANS crude have increased the complexity of efforts to project U.S. tanker demand. These exports may or may not increase the demand for Jones Act vessels, since the law requires only that vessels carrying ANS oil be American owned and flagged. There is no requirement that they be built in U.S. shipyards or crewed by U.S. seafarers. However, the biggest ANS producer and probable principal exporter—BP Oil, Inc.—has committed to using Jones Act vessels. In a letter to Senator Dianne Feinstein (141 Cong. Rec. S6665, May 15, 1995), BP Oil, Inc. stated that ''BP will commit now and in the future to use only U.S. built, U.S.-flag, U.S.-crewed ships for [Alaskan oil] exports. We will supplement or replace ships required to transport Alaskan crude oil with U.S.-built ships as existing ships are phased out under the provisions of the Oil Pollution Act of 1990."
Exports of ANS crude are just starting, and there are widely divergent projections of their volume. The minimum amount likely to be exported is any production exceeding the West Coast requirement of about 1.3 MBD. Estimates range from a low of 20,000 barrels per day (b/d) to more than 300,000 b/d. Government forecasts are on the order of 150,000 b/d. The committee's analysis relies on the PIRA figures shown in Table 5-2.
FIGURE 5-6 ANS crude oil trade supply and demand. Sources: State of Alaska, 1995: Navigistics, 1996.
The supply-demand balance of vessels for the ANS crude trade is based on relatively conservative forecasts of ANS production and exports by the ADR (Figure 5-6). Supply consists of all Jones Act tankers exceeding 50,000 DWT with the assumption of high efficiency in utilization. Under these conditions, demand equals supply in 2002 and continues to do so until 2006, when significant new vessel construction of about 850,000 DWT would be needed.
In Figure 5-7, the PIRA estimate is overlaid on the ADR projection adopted by the committee and shows a significant vessel shortfall—between 300,000 and 500,000 DWT—starting in about 2002.
The overriding difficulty in offsetting the projected decline of the fleet through new construction is the industry's expectation of a decline in ANS crude production. Such a decline is not certain. New exploration successes, lower production costs, improved recovery techniques, or the opening of the Arctic National Wildlife Refuge to oil production might prevent it. These developments aside, the possibility that demand may disappear after only half the economic life of new double-hull vessels is exploited weighs heavily against the incentive to replace. Figure 5-8 illustrates the problem. Beginning in 2004, newbuildings will be needed to replace tankers phased out through 2010. By 2011, the expected decline in production will result in surplus capacity among vessels constructed during the previous six years. Approximately 40 percent of the new vessels will not be in use by 2015, less than 10 years after they were built. Given this forecast,
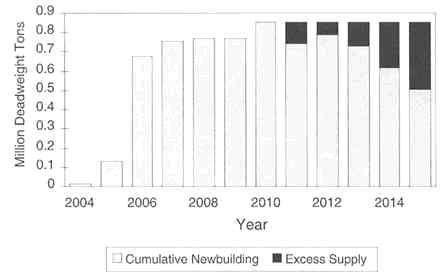
TABLE 5-3 Product Supply Methods to the Eastern United States (MBD), 1993
|
Area |
Pipeline |
Jones Act Vessels |
Foreign Imports |
|
Florida |
— |
0.68 |
0.12 |
|
South Atlantic |
1.15 |
0.15 |
0.08 |
|
Mid-Atlantic |
0.98 |
0.11 |
0.36 |
|
Northeast |
— |
0.63 |
0.25 |
|
Source: Wilson, Gillette, & Co., 1994. |
|||
the present slow pace of new orders is not likely to accelerate markedly in the near future.
Under the circumstances, rebuilding may offer an attractive alternative to new construction. Equipping existing single-hull forebodies with double hulls may turn out to be more economically feasible. In either case, U.S. shipbuilding capacity is adequate to meet the need, as shown later in this chapter.
Coastal Products Trade
Domestic tank vessels used in the east coast products trade face different and more complex competitive problems than those affecting international transportation.13 These vessels compete not only among themselves, but also against oil pipelines and (indirectly) against foreign ships carrying imports (see Table 5-3).
The pipeline system is elaborately reticulated and flexible, and its cost and rate structure make it cheaper than tank vessels. In the South and in mid-Atlantic markets, it is the carrier of choice for product shipments from the Gulf to the east coast, accounting for almost 90 percent of trade. Because pipeline capacity is not fully utilized for at least six months each year, the pipeline acts as an effective ceiling on vessel tonnage during that period.
Unusually severe winter weather or refinery shutdowns, coupled with shortages induced by just-in-time inventory policies, occasionally expand opportunities for coastwise tankers, which have a time advantage over imports when delivery is urgent. Pipelines, however, use their spare capacity during the low-demand season to build up distribution-point inventories for use in the high-demand season. Furthermore, expansion of pipeline capacity over the long run is possible.
FIGURE 5-9 Jones Act tank vessel coastal product supply and demand. Sources: Wilson, Gillette & Co., 1994; Navigistics, 1996.
Although the Jones Act insulates the coastwise trade from foreign ship competition between U.S. ports, it does not preclude direct imports of competitive products in foreign vessels to U.S. ports. In fact, the volume of product imports from foreign refineries can be directly induced by the level of U.S. rates.14 The comparatively low capital base of the domestic fleet due to its age strengthens its ability to hold its present market share. Additionally, the market has witnessed a chronic excess supply of vessels that has depressed the freight rates of all tankers and coastal barges for more than a decade. Moreover, pronounced seasonal variations in shipments cause freight rates to fall still lower during much of the year (see Gassman, 1996; MARAD, 1996).
The flow of products from the Gulf to the East Coast has declined as production has moved from Gulf Coast refineries to the Midwest. East Coast demand for products is being met by foreign imports. As a result, there is reduced demand for Jones Act vessels to move products from the Gulf to the East Coast.
The demand for waterborne petroleum products was fairly level in the early 1990s and is forecast to grow moderately, as shown in Figure 5-9. The future course of Jones Act tanker demand, however, is in question.
Because the Gulf and East Coast tanker and coastal barge market is limited
to what the pipelines cannot carry and is also subject to competition from foreign imports, the extent to which single-hull vessels will be replaced is hard to predict. As older vessels are phased out, they will be replaced only to the extent that double-hull tankers and barges obtain freight rates commensurate with their higher construction costs. If these rates significantly exceed prevailing and anticipated future market rates, however, the pipelines and imported oil are likely to gain market share at the expense of domestic tank vessels. Under such conditions, rates are likely to be perceived as too low to support the higher cost of new or converted double-hull tankers or barges. Some new construction will be needed to carry oil products to regions that cannot be reached by pipeline or served by foreign imports, but a significant part of the single-hull coastal fleet may not be replaced as it is phased out. A major reduction in the capacity of the U.S.-flag tanker fleet and increased dependence on foreign imports could increase concerns over national security issues.
Shipyard Capacity and Availability of Material
In the United States there are currently 21 shipyards with 123 building slots capable of building or reconstructing double-hull Jones Act tankers (MARAD, 1995). The capacity of these shipyards is shown in Table 5-4.
By assuming that a double-hull tanker can be constructed within two years of keel laying, the capacity of U.S. shipyards is adequate to cover the projected shortfall in Jones Act tanker capacity in the ANS trade, provided construction begins in 1998. Converting an existing tanker into a double hull will likely take less time and would overcome the projected shortfall if construction started as late as 1999. If demand exceeds current projections, newbuilding or reconstruction would have to start earlier. Since U.S. shipyard capacity is substantial, the entire existing domestic fleet of single-hull tank vessels of less than 50,000 DWT
TABLE 5-4 Number of U.S. Industry Vessel Building Slotsa
could probably be replaced within two years, as long as shipyard capacity was not constrained by demand for naval or other types of commercial vessels.
Members of the financial community (Morgan, 1995; Newbold and Grubbs, 1995) stated in presentations to the committee that there are no restrictions on the availability of capital for economically viable construction or reconstruction of double-hull tank vessels for the Jones Act trade. In addition, MARAD is currently authorized to provide financing guarantees (through the Title XI program) for the construction or reconstruction of double-hull tankers in U.S. shipyards.
Economic Impact of Section 4115 on Domestic Shipping
Capital and Operating Costs
The differences in the capital and operating costs of double-hull and single-hull vessels in Jones Act trade are similar to those found in the international fleet. Increases in operating costs attributable to double-hull replacement are estimated to be between 5 and 13 percent. Increases in capital cost for double-hull compared to single-hull vessels are approximately 10 to 17 percent. Estimates of the differential cost factor for double-hull tankers built in U.S. compared to foreign yards range from about 1.5 for vessels of 40,000 DWT to as much as 2.25 for vessels of more than 140,000 DWT.15 Given market uncertainties, the committee did not attempt to estimate the total incremental cost of constructing and operating a double-hull Jones Act fleet comparable in size and composition to the existing fleet.
Required Freight Rates
MARAD (1996) has estimated that a new 45,000 DWT double-hull tanker in the coastal products trade must earn more than $30,000 per day in full-time employment to break even. Prevailing rates in the trade are about $17,000 to $22,000 per day.
Information on specific rates in the Alaskan trade was not available to the committee because of the dominance of proprietary and time-chartered vessels and the consequent absence of a spot market and associated freight rates. Therefore, a comparison could not be made of prevailing rates and rates that would be required to pay for new tankers.
Calculations of Ship Replacement Costs
The formulas used to analyze ship replacement cost in the international trade also apply to domestic trade. There are some significant differences, however.
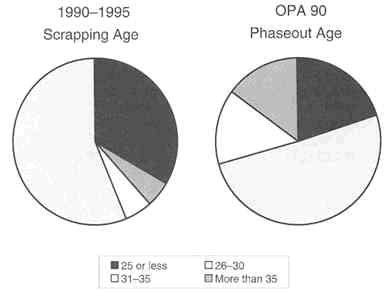
FIGURE 5-10 Comparison of historical scrapping pattern and OPA phaseout age for Jones Act tanker fleet. Source: Clarkson Research, 1990-1995.
Jones Act tankers generally cost more to build than tankers for international trade. In addition, freight rates are low because of excess capacity. As a consequence, the owners of vessels in the domestic trade typically operate their ships for 20 to 35 years or more, compared to the average 23 years in the international market. Figure 5-10 depicts the age distribution of U.S.-flag tank ships scrapped between 1990 and 199516 and compares this distribution with the phaseout schedule of OPA 90.17 In that period, less than 45 percent of the ships scrapped were 35 years old or less. Under the OPA 90 phaseout schedule, however, more than 80 percent of the U.S. fleet will be retired before age 35. A recent study by Clarkson (1996) shows that Jones Act tankers can ordinarily be expected to operate for an average of 35 years, with some smaller product tankers operating as long as 50 years (Figure 5-11).
Another key difference in domestic trade is a high degree of market uncertainty caused by factors such as competition from pipelines and imports, the 1996
FIGURE 5-11 Average age of U.S.-flag tank ships when scrapped. Source: Clarkson Research, 1996.
decision by Congress to allow exports of Alaskan oil, and the large variation in projections of ANS production over the next 20 years.
Given all of the above, the difference in cost between continuing to operate a single-hull vessel until it is 35 years of age and purchasing a new double-hull replacement with retirement of the single-hull vessel at the age required by OPA 90 was calculated using the same methodology employed in Chapter 4.
Table 5-5 shows the "special survey break-even cost"18 if the ship-owner had the option of extending the life of the vessel. The average cost of a special survey is $2 million for a barge, $4 million for a 40,000 DWT tanker, and $6 million for a 120,000 DWT tanker. The MARAD 1996 report on product tankers estimates that the special survey for a product tanker could be as high as $6 million. Table 5-5 is based on the assumptions that the construction price of new Jones Act tankers would be 25 percent higher in U.S. yards than in foreign yards19 and that, in the absence of OPA 90, all vessels would be retired at age 35.
The impact of Section 4115 on ship replacement, provided shipowners were willing to replace their tank vessels if that was the low-cost alternative, is the difference between the break-even special survey cost and the actual special survey cost. Details are shown in Table 5-6.
TABLE 5-5 Special Survey Break-Even Costs ($ million) for Jones Act Tank Vessels
TABLE 5-6 Cost Impact of Early Retirement Due to Section 4115 on Jones Act Tank Vessel Fleet
|
Tank Vessel Type |
Break-Even Cost (in $ million) |
Estimated Special Survey Cost (in $ million) |
Number of Special Surveys |
Total Cost Impact (in $ million) |
|
Tankers < 50,000 DWT |
10.9 |
4.0 |
65 |
448.5 |
|
Tankers > 50,000 DWT |
18.0 |
6.0 |
63 |
756.0 |
|
Barges |
4.7 |
2.0 |
137 |
369.9 |
|
Total |
|
|
|
1,574.4 |
The impact of Section 4115 on total cost is more than $1.5 billion. The key assumption here is that owners will decide to continue operations and to replace their single-hull vessels. However, if domestic market rates stay low and the market continues to contract, the committee's estimate of economic impact will be too high. Owners will simply opt to leave the market, regardless of regulations governing hull design. It is beyond the scope of the committee's charge to predict the future state of the Jones Act market regulations or related political actions that might be taken.
Findings
Finding 1. The implementation of Section 4115 of OPA 90 will have a significant impact on the timing of vessel replacement in the domestic fleet. Historically, these vessels have remained in operation for 20 to 35 years or more. Under OPA 90, most of them will be retired well in advance of their traditional economic lifetime, with approximately 80 percent being phased out before they are 35 years old.
Finding 2. The requirement to replace vessels early could result in forgone utility costs to the domestic fleet of up to $1.5 billion if the entire single-hull fleet is phased out according to the OPA 90 schedule.
Finding 3. Shipyard capacity in the United States is adequate for new construction and conversion of Jones Act vessels. No bunching of orders is anticipated.
Finding 4. Although private capital is available and federal financing will facilitate economically viable double-hull projects, replacement of the Jones Act fleet will be discouraged if Alaskan oil production continues to decline and the higher freight rates needed to pay for double hulls cause domestic operators in the coastal products trade to lose business to pipelines and foreign tankers.
Finding 5. To the extent that domestic single-hull tank vessels are not replaced, there will be a corresponding loss in the transportation infrastructure, including shipyards, ship personnel, ancillary marine services, and suppliers.
References
Bain, J.S. 1959. Industrial Organization. New York: John Wiley & Sons.
Clarkson Research, Ltd. 1990-1995. Tanker Register. London: Clarkson Research.
Clarkson Research, Ltd. 1996. Shipping Intelligence Weekly July 5.
Energy Information Administration (EIA).1996. Annual Energy Outlook 1996. Washington, D.C.: U.S. Department of Energy.
Gassman, W. 1996. Seasonality Trends. Study prepared for the Committee on Oil Pollution Act of 1990 (Section 4115) Implementation Review. Washington, D.C.
ICF Kaiser. 1995. Regulatory Assessment of Supplemental Notice of Proposed Rulemaking on Structural Measures of Existing Single-Hull Tankers. Prepared for U.S. Department of Transportation, Volpe National Transportation System Center, Cambridge, Massachusetts. July.
Maritime Administration (MARAD). 1995. Report on Survey of U.S. Shipbuilding and Repair Facilities. Washington, D.C.: U.S. Department of Transportation, December.
MARAD. 1996. Domestic Product Tanker Markets. Office of Statistical and Economic Analysis. Washington, D.C.: U.S. Department of Transportation, January.
Marine Strategies International (MSI). 1996. Oil & Tanker Market Update: New Lease on Life. London: Marine Strategies International.
Morgan, J.P. 1995. Overview of the financing outlook for the tanker industry. Prepared under the direction of James Hamilton (J.P. Morgan, Inc.) and distributed to the Committee on Oil Pollution Act of 1990 (Section 4115) Implementation Review. Washington, D.C., October 9.
Navigistics Consulting. 1996. Tanker Supply and Demand Analysis, Task I and Task 2. Study prepared for the Committee on Oil Pollution Act of 1990 (Section 4115) Implementation Review. Washington, D.C., June.
Newbold, J. L., and J. L. Grubbs. 1995. Presentation to the Committee on Oil Pollution Act of 1990 (Section 4115) Implementation Review. Washington, D.C. October 9.
National Research Council (NRC). 1991. Tanker Spills: Prevention by Design. Marine Board, Washington, D.C.: National Academy Press.
PIRA Energy Group. 1995. Forecast of Oil Demand. Prepared for the Committee on Oil Pollution Act of 1990 (Section 4115) Implementation Review. New York: PIRA Energy Group.
PIRA Energy Group. 1996. Energy Briefing. Presentation to Mr. Ran Hettena, New York, June 18.
State of Alaska. 1995. Revenue Sources Book, Department of Revenue. Anchorage: State of Alaska, Fall.
Wilson, Gillette & Co. 1994. Forecast Requirements for Tonnage in the Coastwise Petroleum Products and Specialty Trades 1990-2005. Prepared for the Maritime Administration, U.S. Department of Transportation. Washington, D.C.: Wilson, Gillette & Co.


