
The Information Revolution and Sustainability: Mutually Reinforcing Dimensions of the Human Future
BRADEN R.ALLENBY
The automobile’s evolution to a more environmentally efficient artifact shows how the information revolution and sustainability are mutually reinforcing. The automobile itself is a complex system. Its operation depends on several other systems such as roads and fuel delivery systems. These complex systems within systems require the generation and use of a wide range of information and feedback mechanisms. The examination of this evolution suggests wider implications for the information revolution and sustainability.
THE MODERN AUTOMOBILE: A PARABLE
Evolution of the Automobile
In the late 1960s automobiles were powered by what aficionados fondly called “Detroit iron”: relatively crude but effective and large +400 in3 V-8 engines. These “muscle cars” consumed enormous amounts of fuel, often getting less than 10 miles per gallon (mpg). Exhaust from these automobiles was untreated and contained high concentrations of hydrocarbon and nitrous oxide. But gas was cheap. Air was free. Environmental concerns were not yet widespread. Acceleration was great. Then came Earth Day in 1970 and the energy crises of the early 1970s. Pollution control equipment was superimposed on existing engine designs. Demand for improved gas mileage increased. The passage of the Energy Policy and Conservation Act in 1975 (15 U.S.C. §§ 2001 et seq.) established corporate average fuel economy requirements for new automobiles. Accordingly, in the early and mid-1970s, average engine size, engine efficiency, and performance dropped.
Yet the decrease in automotive performance, measured along almost any parameter, was temporary. The average size of the engine in passenger cars for sedans with four-, six-, and eight-cylinder engines fell from approximately 290 in3 in 1975 to about 180 in3 in 1992 and stayed small.1 Horsepower (hp) also dipped over this period. However, the ratio of hp to engine displacement increased significantly, from about 0.5 hp/in3 in 1975 to over 0.8 in 1991, indicating more efficient operation. Moreover, the fuel economy of the average new car improved significantly, from 15.8 to 27.8 mpg between 1975 and 1991. At the same time, absolute performance of the product increased: Acceleration from 0 to 60 miles per hour went from 14 seconds in 1973 to about 12 seconds in 1991 (Graedel and Allenby, 1997; National Research Council, 1992). The modern automobile unquestionably provides more performance per unit resource (in this case, gasoline). Moreover, today’s automobile is considerably safer, handles better, lasts longer, and offers far more amenities, such as advanced sound systems, onboard diagnostics, and climate control systems. Impressively, these gains have been matched by similar increases in environmental efficiency: Since controls were introduced in 1968, volatile organic chemicals and carbon monoxide emissions per vehicle have been reduced by some 96 percent, and, since the imposition of nitrous oxide controls in 1972, emissions of those species have been reduced by over 75 percent (MacKenzie, 1994).
In short, over the past two and a half decades, one of the principal and defining artifacts of the modern industrial economy has undergone an almost revolutionary change. It has improved substantially its environmental performance on a per unit basis; it is a far safer and more desirable product; and it has significantly enhanced not only its performance, but the efficiency with which it generates that performance.
Information Technologies and the Automobile
The performance of the modern automobile reflects a number of incremental improvements: reductions in vehicle weight, better aerodynamic design, reductions in tire rolling resistance, reduction in friction losses, new catalytic systems, and more efficient engines and drivetrains. But there is one common theme underlying the evolution of the modern automobile: It has become a much more complex system, with a far higher information content than its predecessors, and it is increasingly linked to its external environment, becoming a subsystem in a yet more complex automotive transportation system (Figure 1).
Internally, subsystems in older cars were linked mechanically. Systems in new cars are linked by sensors feeding into multiple computers. Whereas older cars had minimal electronics, newer ones have substantial systems that need to be integrated both physically and functionally. The number of cables and wiring harnesses required by the modern automobile has increased to such an extent that routing them through the vehicle becomes a design problem in itself (Thompson,
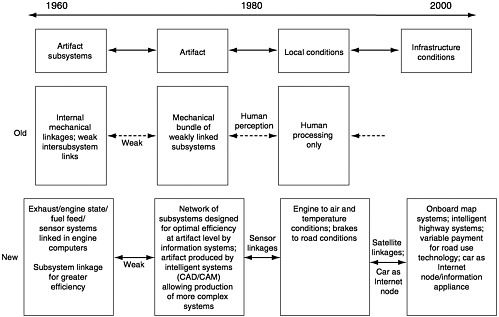
1996). For example, “[d]oors…can barely be made to open and close properly, what with wires for window controls, locks, outside mirror controls, and other switches and lights.” Automobile manufacturers now request complete engine management systems to balance performance, emissions, fuel consumption, and operating conditions (e.g., cold starts, stop-and-go conditions). Such systems typically include control units, sensor systems, and actuators and use complex information topologies to maintain optimal system operation (Krebs, 1993). The modern automobile, therefore, reflects a much more complex engineered system in which sophisticated multiplexed microcontrollers have become a necessary component (The Economist, 1994b).
Producing a more complex system requires, in turn, more sophisticated design tools and manufacturing technologies. For example, lightweighting (reducing the weight of vehicles through better design and material substitution) has been a major contributor to improving environmental performance. Such designs require precision manufacturing and become a far more information-intensive activity. Germany’s Audi, for example, believes that only the advent of super-computing technologies provided the necessary processing power to design and model the performance of the complicated lighter components that have permitted them to lightweight their product. Difficult design problems are resolved using virtual reality design processes. Indeed, powerful computer-aided design systems can replace, with a click of the computer mouse, hours of laborious work done on thousands of drawing boards (The Economist, 1994a). In fact, Boeing dispensed with building a physical model of its latest aircraft, the 777. Instead, the aircraft was created entirely within a distributed computational system using sophisticated simulation software.
As it is with the artifact, so it is with the built infrastructure system within which it functions. In older cars, virtually the only information link between the automobile and the external environment was the driver. Today, sensor systems monitor exhaust systems, the oxygen content of airflows, and road conditions. Newer systems map the car’s geographical position, provide up-to-date road conditions and optimal real-time routing options, and pay tolls electronically without the need to stop. Technologies already exist that will permit ongoing communication between road networks and automobiles. This would, in essence, integrate the automotive built infrastructure, the automobile, and the driver as one automotive transportation system, which in turn can be optimized to provide real-time efficiency by, for example, using time-of-day and location sensitive automatic roadway pricing (Jurgen, 1995). In fact, at the Cyberhome exhibit in San Francisco in 1997, Mercedes-Benz displayed a multimedia concept car, linked to the Internet with speech recognition capabilities, a voice-controlled browser, global positioning system capability, and its own internal local-area network. The car essentially is conceptualized as an information appliance. In discussing the vehicle, Lewis (1997) in Scientific American, claimed, perhaps optimistically, that “The society of Web cars will be able to get themselves out of traffic jams,
avoid bad weather and keep their inhabitants well informed and entertained. With such a huge potential market waiting for manufacturers, Web cars are inevitable. Exactly what form they will take remains to be seen.” Possibilities include speech recognition capability which will allow, for example, dictation of letters and e-mail (Floren, 1997).
This evolution of a more environmentally and economically efficient automobile provides an analogy for at least some of the characteristics of a more sustainable economy. To the extent that the analogy is valid, it suggests that such an economy will be more, not less, complex and, concomitantly, far more informationally dense. Information generation (through, for example, appropriate systems of sensors), the evolution of more complex feedback systems, and tighter linking of previously disconnected subsystems through new information links (e.g., intelligent cars on intelligent roadway systems) will support a fundamental pattern: the substitution of data and knowledge information for other, less environmentally appropriate inputs into economic activity.
THE INFORMATION REVOLUTION AND SUSTAINABILITY IN CONTEXT
The parable of the automobile suggests a fundamental coevolution of the Information Revolution and sustainability: that greater environmental efficiency will require, as an enabling capability, the Information Revolution, and that the latter, in turn, will be strongly encouraged by the need for greater environmental efficiency. Here, of course, environmental efficiency is not taken as the usual green technology but, rather, as the reengineering of the Industrial Revolution suggested by the nascent, integrative science of industrial ecology. Table 1 shows the difference between green technology and environmentally preferable technology systems. After all, the goal is not control of local perturbations or acute human risk, but sustainability.
If sustainability is a state that emerges only at the level of a global human ecology, which is a highly defensible hypothesis, then subsystem sustainability cannot be defined except in terms of relationship to global systems, and certainly the knowledge or wisdom to know what that means is not on hand. This is particularly true because there are probably many sustainable states. Therefore, it becomes a value judgment and a function of the ability of human institutions to adapt to an environmentally constrained world that will determine toward which state humanity moves (Cohen, 1995; Allenby, 1998). Indeed, industrial ecology is intended to provide the science and technology base for understanding what sustainability actually might mean (Graedel and Allenby, 1995; IEEE, 1995; Allenby, 1997).
This does not mean, however, that humanity must drift: It is entirely possible to define environmental efficiency as providing equal or greater units of the quality of life while reducing the resultant summed environmental impacts
TABLE 1 Green Technology versus Environmentally Preferable Technology
|
Technology Designation |
Philosophy |
Example |
Origin |
Market Structure |
Endpoint |
|
Green technology |
The government can mandate everything we need |
Scrubbers, water treatment plants, pollution prevention |
Localized effects, command and control, end of pipe |
Central mandate and control |
Reduce local human risks |
|
Environmentally preferable technology systems |
Evolution of complex systems within appropriate boundary conditions |
Central digital servers providing video/ music/multimedia on demand; energy- and water-efficient dishwasher |
Technological change, implementation of industrial ecology theory and design for environment |
Internalization of externalities; free-market function within boundary conditions |
Sustainability |
integrated across the life cycle of the process, product, service, or operation involved. Quantifying these impacts in specific instances is quite difficult, but the principle is understood easily, as the case of the automobile discussed above.
It is also important ab initio to recognize that the information infrastructure that supports information services of all kinds, from sensor systems to telecommunications, itself is not without environmental cost. For example, part of the cost of the increased efficiency of the automobile is the consumption by that sector of some 12 percent of the printed wiring boards produced in the United States annually (compared with about 39 percent that go into computational devices) (MCC, 1994). More broadly, the production of electronics components and subassemblies, their energy consumption over their life cycles, and the end-of-life treatment of electronics products sometimes generate significant environmental impacts of different types. Chip production, for example, consumes substantial energy and water resources (see Table 2), amounting to about half of the cost of semiconductor manufacturing (MCC, 1994). Moreover, the rapid pace of the technological evolution of electronics and the highly competitive international markets for these goods result in rapid product obsolescence and thus substantial generation of waste materials as old products are discarded. Problematic issues include the leaching of heavy metals from solder and leaded glass used in displays and the sheer volume of discarded electronics items (MCC, 1993).
Realization of the full environmental and economic benefits of the substitution of information for other economic inputs, therefore, requires that the environmental impacts of electronics products across their life cycle be minimized. In the electronics industry, this is accomplished by using design for environment (DFE) methodologies and tools, which have evolved rapidly.2 And, although
TABLE 2 Semiconductor Manufacturing Energy Consumption
|
Input |
Cost (thousands of dollars) |
Percentage of Manufacturing Cost |
|
Central plant |
3,720 |
7.1 |
|
Building structure |
3,838 |
7.3 |
|
Ultrapure water |
539 |
1.0 |
|
Chem services |
479 |
0.9 |
|
Gas services |
247 |
0.5 |
|
Electricity |
21,890 |
41.5 |
|
Water |
1,423 |
2.7 |
|
Natural gas |
2,481 |
4.7 |
|
Custodial (cleaning service) |
1,953 |
3.7 |
|
Gounds landscaping |
102 |
0.2 |
|
Trash |
158 |
0.3 |
|
Hazardous waste management |
774 |
1.5 |
|
Salary/benefits |
15,105 |
28.7 |
|
SOURCE: Based on Lando, 1996. |
||
DFE has not yet been fully understood and adopted by any firm, it is increasingly being integrated into many of the concurrent engineering systems of leading electronics firms around the world. Moreover, governments in Europe and Japan are actively exploring ways to minimize the environmental impacts of electronics products, including imposing postconsumer product takeback requirements on manufacturers of consumer electronics. Thus, the environmental impacts of the platforms by which information services are provided are at last beginning to be addressed.
EMERGENCE OF THE INFORMATION INDUSTRY
Several salient points are now apparent about the Information Revolution. The first is the emergence of an information industry from previously disparate sectors (Figure 2), which is seen as creating an industry sector with four components: information content, information servers, information networks, and information appliances. Note that, as suggested by the automobile example, these should not be taken as stand-alone sectors. Rather, they are functions, which are increasingly embedded throughout the economy, from manufacturing and agricultural operations to products of all kinds; to service systems such as transportation and energy; to end-use applications such as the Internet, intranets, computers, telephone systems, and televisions.
The second point is the pervasive use of information technologies within the economy and their vital role in enabling the development of a robust service sector, which has grown to dominate developed economies, even manufacturing-oriented ones such as Japan’s (Figure 3). Although there is considerable ambiguity about the term “services,” the service sector includes transportation, communications, utilities, and sanitary services. Table 3 provides a breakdown of the Standard Industrial Classification divisions and the major groups representing services. It also shows that the service industry groups are far broader than the information industry, however the latter is defined.
There is a more subtle truth in the intuitive linkage between the information industry and the service economy, however. The Industrial Revolution could not have occurred without concomitant breakthroughs in agriculture, manufacturing, energy, and transportation infrastructures. It also was based on its own information revolution: The printing press and nascent media were critical elements in the diffusion of knowledge, particularly scientific and technological, without which the rapid growth of industrialization and supporting infrastructures could not have occurred. The Industrial Revolution, which fundamentally represents the meeting of human wants and needs—providing a demanded level of quality of life—through increased material wealth, was fueled by its own information revolution. Similarly, now, the current Information Revolution offers the promise of providing enhanced quality of life through services, not simply material acquisition. The challenge then becomes substituting services for material products, and dematerializing services,
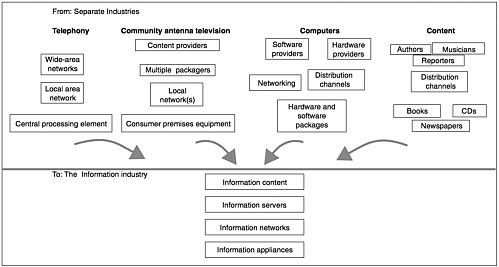
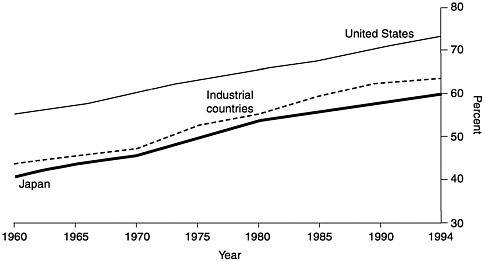
FIGURE 3 Service-sector employment in developed economies. SOURCE: Adapted from IMF, 1997, p. 47.
TABLE 3 Major Standard Industrial Classification Divisions and Groups Representing the Service Sectors
|
Code |
Classification |
|
Production Sectors |
|
|
Division A |
Agriculture, forestry, and fishing |
|
Division B |
Mining |
|
Division C |
Construction |
|
Division D |
Manufacturing |
|
Service Sectors |
|
|
Division E |
Transportation, communications, electric, gas, and sanitary services |
|
Major Group 40 |
Railroad transportation |
|
Major Group 41 |
Local and suburban transit and interurban highway passenger transportation |
|
Major Group 42 |
Motor freight transportation and warehousing |
|
Major Group 43 |
U.S. Postal Service |
|
Major Group 44 |
Water transportation |
|
Major Group 45 |
Transportation by air |
|
Major Group 46 |
Pipelines, except natural gas |
|
Major Group 47 |
Transportation services |
|
Major Group 48 |
Communications |
|
Major Group 49 |
Electric, gas, and sanitary services |
|
Division F |
Wholesale trade |
|
Major Group 50 |
Wholesale trade—durable goods |
|
Major Group 51 |
Wholesale trade—nondurable goods |
|
Code |
Classification |
|
Division G |
Retail trade |
|
Major Group 52 |
Building materials, hardware, garden supply, and mobile homes |
|
Major Group 53 |
General merchandise stores |
|
Major Group 54 |
Food stores |
|
Major Group 55 |
Automotive dealers and gasoline service stations |
|
Major Group 56 |
Apparel and accessory stores |
|
Major Group 57 |
Home furniture, finishings, and equipment stores |
|
Major Group 58 |
Eating and drinking places |
|
Major Group 59 |
Miscellaneous retail |
|
Division H |
Finance, insurance, and real estate |
|
Major Group 60 |
Depository institutions |
|
Major Group 61 |
Nondepository credit institutions |
|
Major Group 62 |
Security and commodity brokers, dealers, exchanges, and services |
|
Major Group 63 |
Insurance carriers |
|
Major Group 64 |
Insurance agents, brokers, and services |
|
Major Group 65 |
Real estate |
|
Major Group 67 |
Holding and other investment offices |
|
Division I |
Services |
|
Major Group 70 |
Hotels, rooming houses, camps, and other lodging places |
|
Major Group 72 |
Personal services |
|
Major Group 73 |
Business services |
|
Major Group 75 |
Automotive repair, services, and parking |
|
Major Group 76 |
Miscellaneous repair services |
|
Major Group 78 |
Motion pictures |
|
Major Group 79 |
Amusement and recreation services |
|
Major Group 80 |
Health services |
|
Major Group 81 |
Legal services |
|
Major Group 82 |
Educational services |
|
Major Group 83 |
Social services |
|
Major Group 84 |
Museums, art galleries, and botanical and zoological gardens |
|
Major Group 86 |
Membership organizations |
|
Major Group 87 |
Engineering, accounting, research, management, and related services |
|
Major Group 88 |
Private households |
|
Major Group 89 |
Miscellaneous services |
|
Division J |
Public administration |
|
Major Group 91 |
Executive, legislative, and general government, except finance |
|
Major Group 92 |
Justice, public order, and safety |
|
Major Group 94 |
Administration of human resource programs |
|
Major Group 95 |
Administration of environmental quality and housing programs |
|
Major Group 96 |
Administration of economic programs |
|
Major Group 97 |
National security and international affairs |
|
Division K |
Nonclassifiable establishments |
|
SOURCE: Bureau of the Census, 1996. |
|
in a large part through the substitution of information technology and intellectual capital (increasingly embedded in software) for material and energy input. There are some indications that this is, in fact, occurring: Some 80 percent of all information technology in the United States, for example, is purchased and used by the service sector (Rejeski, 1997). Nonetheless, our understanding of, and ability to assess, this process is quite limited at this preliminary juncture, and it would be premature to draw any firm conclusions.
For one example, the substitution of information for physical inputs is liable to be quite subtle in some cases. Consider, for instance, an illustrative and anecdotal example drawn from a nonservice sector, agriculture. It would appear at first glance to have little, if anything, to do with information markets. However, on closer examination, one finds that some firms are beginning to offer pest management services, in lieu of simply selling biocides. Such services tend to rely on more complex mixtures of technologies, require more knowledge of pests and their habits (not to mention their genetics), and make less use of biocides than in existing practices (Benbrook et al., 1996). They are, in short, substituting complexity and information for material consumption in the agricultural process by offering a service rather than a product.
More fundamentally, Monsanto’s CEO, Robert Shapiro, explains another way in which information is being substituted for material inputs such as pesticides (and the concomitant “inert ingredients”) and the energy embedded in them and used to apply them (Magretta, 1997):
We don’t have 100 years [to figure out how to avoid ecological catastrophe or food shortages]; at best, we have decades. In that time frame, I know of only two viable [mitigation technology] candidates: biotechnology and information technology. I’m treating them as though they’re separate, but biotechnology is really a subset of information technology because it is about DNA-encoded information.
Using information is one of the ways to increase productivity without abusing nature…. Sustainability and development might be compatible if you could create value and satisfy people’s needs by increasing the information component of what’s produced and diminishing the amount of stuff….
I offer a prediction: The early twenty-first century is going to see a struggle between information technology and biotechnology on the one hand and environmental degradation on the other. Information technology is going to be our most powerful tool. It will let us miniaturize things, avoid waste, and produce more value without producing and processing more stuff. The substitution of information for stuff is essential to sustainability.
Another example, still in its infancy, is the provision of textual material, data, and software upgrades through the Internet and via electronic mail. This is a broad trend, and a few examples should suffice to illustrate it. Many journals now accept, if they do not require, submission of manuscripts in electronic form. Data appendices, which previously were available largely in hard copy, now are
routinely available online from central databases. Indeed, it is doubtful that data-intensive efforts such as the Human Genome Project could have been undertaken without such information access. Several journals are completely online now, and some publishers have imprints dedicated to electronic publishing. A topical example can be taken from AT&T. Only a few years ago, AT&T printed some 100,000 copies of its annual environmental report, because hard copy was all that was available; in 1996 the number of reports printed dropped to 10 percent because the entire report was available on the Internet. Sun Microsystems has gone to a completely electronic format for its annual environmental report (Craig, 1997). Software upgrades are increasingly provided over the Internet, reducing the need to send thousands of floppy disks or CD-ROMs through the mail (and the concomitant environmental impacts associated with the manufacture and distribution of these artifacts).
RELEVANT TRENDS IN THE INFORMATION INDUSTRY
Several trends in the information industry stand out and tend to suggest continued substitution of information for other inputs into the economy. The dramatic and continued increase in processing capacity of microprocessors and in memory per chip (Figure 4) are well known. What is equally important, however,

FIGURE 4 Increased capacity of memory chips, 1978–1993.
is that the rate of technological evolution in the information industry is driving order-of-magnitude improvement in virtually all relevant technologies, from optical transmission to information storage, to signal compression, to efficient spectrum use, to software (Table 4). Equally important, the costs of information manipulation continue to fall, with exponential improvements in such critical metrics as flops per dollar (flops are floating-point operations, a measure of computational performance) (Figure 5). In fact, digital computation trends show that, on a per million instructions per second (MIPS) basis, digital computation technology is exponentially dematerializing, shrinking in volume, gaining in power efficiency, and gaining in economic efficiency (Figure 6). Because the first three parameters arguably capture many sources of environmental impact and the latter obviously captures economic impact, it is hard to argue that significant simultaneous gains in environmental and economic efficiency are not at the core of historical and current performance of the information industry.
Accordingly, consumption of information platforms is increasing, in many cases exponentially. This is true for information “pipes,” as shown, for example, by the increase in voice paths over the Pacific (Figure 7), and by the number of new subscribers to information services such as cellular telephones (Figure 8). Although the data are hard to evaluate, this is apparently leading to substantial growth in information stocks, most particularly in new electronic media as opposed to traditional hard media such as books (Figure 9). Although the data are hard to evaluate, this is apparently leading to substantial growth in information stocks, particularly in new electronic media as opposed to traditional hard media, such as books (Figure 10 presents such data from Japan). Information consumption appears to be growing more rapidly than either gross national product (GNP) or population, at least in some developed countries (Figure 10). Overall, the impression is of an expanding information industry sector with rapidly evolving technology and falling costs per unit of performance.
Material and energy trends are more complex. Substitution effects—new materials for old, for example—on all scales, from the economy itself to sectors to specific applications, and their tangled relationship with technological evolu
TABLE 4 Technological Advances in the Information Industry
|
Technology |
Technology Trend |
|
Silicon chip |
Multi-2 in speed every 18–24 months |
|
Optics |
Multi-2 in speed every 3.5 years |
|
Storage |
Reduction of cost by half every 2 years |
|
Energy |
Distributed generation |
|
Compression |
30:1 in space in past 5 years |
|
Spectrum |
Better reuse, higher availability |
|
Software |
Portable operating systems, middleware, distributed systems |
|
SOURCE: Adapted from Lando, 1996. |
|
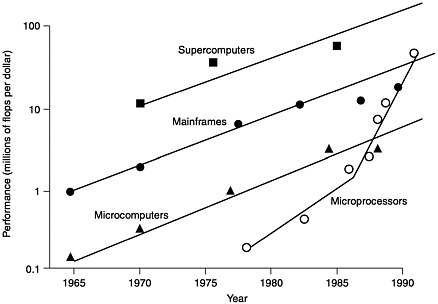
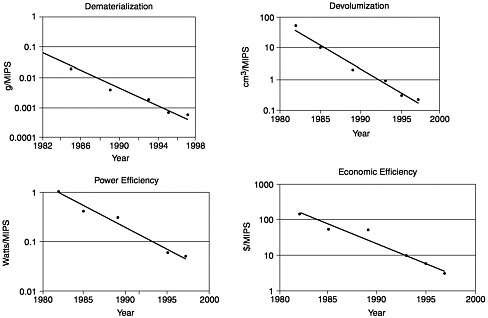
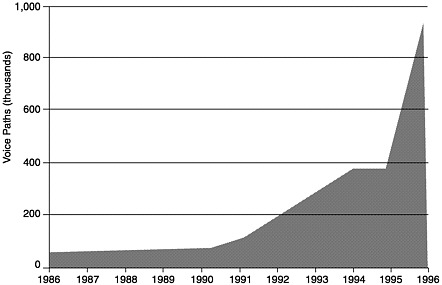

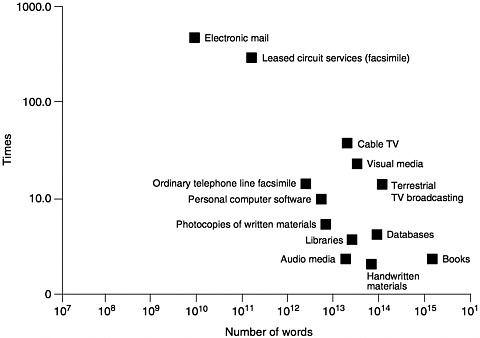
FIGURE 9 Growth of information and communication equipment stocks in Japan, 1983– 1993. SOURCE: Japan Ministry of Posts and Telecommunications, 1995, p. 16.
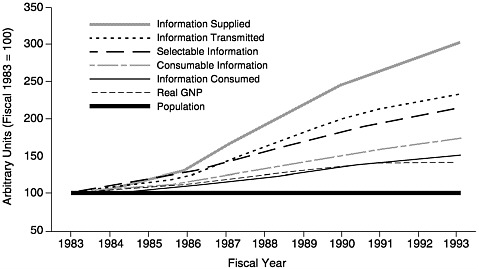
FIGURE 10 Growth of information consumption in Japan relative to GNP and population, 1983–1993. SOURCE: Adapted from Japan Ministry of Posts and Telecommunications, 1995, p. 13.
tion, are difficult to assess in general terms. Moreover, a thicket of subsidies, direct (e.g., depletion allowances) and indirect (e.g., subsidized transportation for virgin materials), is common in energy and material sectors, further complicating analyses. Nonetheless, some trends appear to be fairly robust.
Regarding energy, it is apparent that consumption will continue to increase strongly over the next several decades as a result of continuing economic development, particularly in Asia. Growth rates will be higher than population growth (i.e., higher per capita energy consumption with development) but less than gross domestic product (GDP) growth (i.e., continuing the decoupling of energy consumption from economic growth rates) (EIA, 1996). The shift from primary fuels to electricity, which has characterized the evolution of developed economies, will continue on a global basis. The U.S. Energy Information Administration (EIA) anticipates, however, that existing energy resources and technologies are adequate to meet this demand and thus concludes that “the real cost of energy need not escalate significantly over the projection period [to 2015]” (EIA, 1996). It is not clear, however, whether this projection takes into account the massive investment required for development in Latin America and Asia and for supporting rapid technological evolution (and the associated equipment, facility, and infrastructure replacement) in developed economies. These demands for capital could raise its cost (interest rates) significantly and thus make the building of new energy infrastructures very expensive, thereby making the provision of energy more expensive.
The materials picture is somewhat more complex. Although it is generally believed by some that the materials efficiency (material used per unit of GDP or, more broadly but less easily measured, per unit of quality of life) of developed economies is improving, data are ambiguous. Thus, for example, the survey of material use patterns in the United States by Wernick et al. (1996) leads them to conclude that, although there are theoretical reasons to believe that dematerialization of economic activity will proceed, current trends are unclear:
With regard to primary materials, summary ratios of the weight of materials used to economic product appear to be decreasing due to materials substitution, efficiencies, and other economic factors. The tendency is to use more scientifically selected and often artificially structured materials. These may be lighter, though not necessarily smaller. The value added clearly rises with the choice of material, but so may aggregate use.
With regard to industry, encouraging examples of more efficient materials use exist in many sectors, functions, and products. Firms search for opportunities to economize on materials, just as they seek to economize on energy, labor, land, and other factors of production. However, the taste for complexity, which often meshes with higher performance, may intensify other environmental problems, even as the bulk issues lessen.
With regard to consumers, we profess one thing (that less is more) and often do another (buy, accrete, and expand). No significant signs of net dematerialization at the level of the consumer or saturation of individual materials wants is evident.
With regard to wastes, recent, though spotty, data suggest that the onset of waste reduction and the rapidity with which some gains have been realized as well as the use of international comparisons indicate that very substantial further reductions can take place.
Cost trends are difficult to generalize but, in general, waste disposal costs, very roughly tied to toxicity, are increasing, as are prices for primary commodities, which from 1970 to 1997 have trended upward, although with significant variation (IMF, 1997). Even if prices for fuel and nonfuel materials are assumed to remain stable (perhaps as a result of substitution and technological evolution with concomitant increases in efficiency of process and use of materials), the cost differential favoring substitution of information for other inputs should continue to grow because of the steep continuing decline in costs of the former.
Significantly, these commodity price trends are reflected in a fundamental shift in the values accorded to firms by the financial markets. Microsoft, for example, with minimal physical assets (e.g., its campus in Redmond, Washington) but abundant intellectual capital (its people), has a market capitalization greater than Ford, General Motors, and Chrysler taken together, despite their huge asset bases. As Walter Wriston (1997), former chairman and CEO of Citicorp/Citibank and chairman of the Economic Policy Advisory Board in the Reagan administration, notes:
The pursuit of wealth is now largely the pursuit of information and its application to the means of production. The rules, customs, skills, and talents necessary to uncover, capture, produce, preserve, and exploit information are now humankind’s most important. The competition for the best information has replaced the competition for the best farmland or coal fields…. The new economic powerhouses are masters not of huge material resources, but of ideas and technology. The way the market values companies is instructive: it now places a higher value on intellectual capital than on hard assets like bricks and mortar.
More generally, knowledge as a critical factor of production, like capital, labor, and raw materials, is increasingly recognized by prominent economists such as Paul Romer (Kurtzman, 1997) and industrial theorists such as Arie de Geus (1997), known for his innovative introduction of scenario planning techniques at Royal Dutch Shell. The implications of this shift to knowledge as a critical input to the firm are profound; for the economy as a whole, it has been suggested that efficiency in a knowledge economy requires equity (Chichilnisky, 1996).
These data are all suggestive, but they are neither systematic nor comprehensive. What would be desirable is a rigorous way of determining whether the substitution of information and intellectual capital for other economic inputs is actually occurring and, if so, to quantify and track this trend over time. Conceptually, one thus wishes to measure the information density of the economy, which, like many useful and obvious activities, is easier said than done. Although a possible theoretical approach is sketched below, much further effort is required to develop a workable, quantitative measure.
INFORMATION DENSITY OF AN ECONOMY
Concept
One way of thinking about a more complex economy is in terms of its information density, especially if greater information density is likely to be a necessary, if not a sufficient, requirement for greater economic and environmental efficiency. It is, of course, also apparent that a more complex economy, in itself, does not guarantee such efficiency: One could simply devise more numerous and more complex ways of producing more onerous environmental impacts. Thus, although this section focuses on the concept of information density, a second step needed to link the Information Revolution rigorously to sustainability is to quantify and understand the correlations and, if feasible, the causal linkages between increasing information density and greater environmental efficiency. The latter step will require substantial research and conceptual development.
Moreover, it is also apparent that more information, by itself, may not equate directly to greater knowledge—“useful information”—and thus enhanced quality of life: junk faxes and e-mail bedevil many of us; and the Internet, although useful, is also information pollution raised to an art form, a postmodernist information Superfund site in the making. Much of this overabundance of information is probably a reflection of the youthful exuberance of the fundamental shift to a knowledge economy and temporary price distortions in a rapidly changing market (e.g., “free” Internet information), and it is at least probable that much information pollution will disappear as market forces begin to shape a competitive information and knowledge economy. It must be recognized, after all, that there is some value in information redundancy in a complex system. More fundamentally, someone is consuming the films and videos and using up telecommunications and Internet transmission capacity almost as soon as it is installed: Anyone with teenagers can attest that one person’s noise is another person’s rock and roll (or, somewhat more rigorously, the transition from information to knowledge is heavily contextual and subjective).
Conceptually, the information density of an economy is somewhat analogous to physical density and thus can be given by a formula based on that for physical density (volume divided by mass):
where Di is the information density of the economy in bits per dollar, Vi is the volume of information in the economy in bits, and Ea is the economic activity in the economy measured in dollars. Unlike physical density measures, however, information density involves a time domain because both stocks and flows of information, and economic activity, are involved. Thus, information density might
have to be an averaged figure (perhaps over a year to match GDP data). Economic activity in the aggregate is relatively easy to measure (but, even here, appropriate caution must be exercised: For example, natural resource accounting methods are primitive and seldom used). Moreover, it would be preferable to measure quality of life per unit of information rather than simple economic activity, but metrics for such subjective dimensions of the human experience are hard to validate, and the correlations between them and economic indicators are not well understood. Even now, for example, it is proving difficult in practice to evaluate increases in quality of life due to improvements of existing artifacts where such increases are not reflected in price changes.
Quantifying the volume of information in the economy is the problematic step. Conceptually, one way of defining Vi is as the number of bits (or bit equivalents, for analog systems) communicated through the communications networks of the economy or consumed in a given period, including data, voice, and video (volume telecommunicated, or Vt); the number of bits consumed in the economy through, for example, listening to music or watching a videotape (volume consumed, or Vc); the number of bits generated within artifacts, such as cars, airplanes, and coffee makers (volume in artifacts, or Va); the number of bits generated within facilities and infrastructure, such as manufacturing facilities, administrative buildings, retail outlets, fast-food establishments, and the like as part of their operations (volume in facilities, or Vf); the number of bits published in other than electronic media and not duplicated there (Vn); and the information content in all other residual uses (Vr).
Vi=Vt+Vc+Va+Vf+Vp+Vr
Defining these amounts will be difficult, especially because the terms are not orthogonal; some of the information consumed, for example, has been transmitted previously.
Some of these terms, such as the volume telecommunicated, can in theory be estimated from existing data that already have been collected, although the practical problems involved in actually doing so are substantial. Some terms, for example, might be estimated by multiplying the information capability of the relevant universe by the number of times that capability is accessed. Thus, an estimate of bits consumed could be derived by multiplying the number of bits stored in various media by the number of times that the media unit is accessed and then multiplying that figure by the audience per time accessed (the Star Wars movie, for example, might make a significant contribution to the amount). The number of bits generated within artifacts also might be relatively easy to estimate, based on the capability of the chips embedded in the devices and the access rate. A similar process, adjusted for double counting, might be applied to bits generated within facilities and infrastructure. A figure for bits published in nonelectronic media forms should be relatively easy to estimate, although double counting might be a problem here as well.
Overall, however, these terms should be considered as illustrative of the concept; as discussed below, actually measuring the information density of the economy will be a complex and intensive task, not easily accomplished without a focused effort involving experts in a number of fields.
The easiest way to measure Ea is in terms of dollars of economic activity, but this has some measurement difficulties as well. Many of these, such as costing noneconomic but productive work such as housework or raising children, are familiar to economists, however, and reasonable valuation methods can be used to impute proper figures. More fundamentally, in keeping with the industrial ecology approach, which encompasses both economic activity and associated externalities, Ea should be considered as the sum of measured economic activity, or Em, and externalities, or Ex:
Ea=Em+Ex
The difficulties of quantifying externalities, a category that includes but goes beyond many of the proposed green accounting systems, are substantial, but not impossible if absolute precision is not required. This provides the full equation
Estimating this indicator for the period from the beginning of the Industrial Revolution until the present could be an interesting way of determining whether the vaunted Information Revolution is, in fact, occurring. It also might be one indicator, albeit insufficient without others, for progress toward a more environmentally and economically efficient economy. (An interesting question for further research is whether Vi can be broadly defined in such a way as to generate a quantitative measure of the complexity of society as a whole, rather than just the economy.)
Metrics
The theoretical appeal of a robust metric for information density is considerable, but actually developing such a measure will be quite challenging. An obvious initial step, for example, is to turn to existing economic databases and measures, which have the significant advantages of being traditional, relatively standardized, and globally ubiquitous. Could, therefore, a very rough estimate of the information density be obtained by using economic data alone; using summed data on consumption in information sectors such as books, cable television, telephone, CDs; and comparing the ratio of that sum to economic activity as a whole?
Although it would fairly easily yield a result, this approach could be seriously misleading, as demonstrated by Table 5, which uses Bureau of the Census data to track information industry economic performance as a percentage of the GDP for selected years from 1980 to 1994 (this data format extends back only to
TABLE 5 Traditional Information Sector Share of GDP
|
|
Share of GDP, 1980 and 1987–1994 (billions of current dollars, rounded) |
||||||||
|
|
1980 |
1987 |
1988 |
1989 |
1990 |
1991 |
1992 |
1993 |
1994 |
|
Total GDP Sector |
2,708 |
4,692 |
5,050 |
5,439 |
5,744 |
5,917 |
6,244 |
6,550 |
6,931 |
|
Electronics manufacturing |
55 |
83 |
88 |
97 |
95 |
98 |
99 |
112 |
130 |
|
Communications |
69 |
125 |
132 |
136 |
147 |
154 |
161 |
173 |
188 |
|
Motion pictures |
6 |
15 |
16 |
20 |
20 |
20 |
20 |
22 |
25 |
|
Amusements and recreation |
14 |
27 |
30 |
34 |
39 |
42 |
48 |
49 |
52 |
|
Printing and publishing |
33 |
62 |
69 |
72 |
74 |
76 |
79 |
82 |
86 |
|
Sector total |
177 |
312 |
335 |
359 |
375 |
390 |
407 |
438 |
481 |
|
Percentage of GDP |
6.53 |
6.65 |
6.63 |
6.6 |
6.53 |
6.6 |
6.52 |
6.69 |
6.94 |
|
SOURCE: Bureau of the Census, 1996, Tables 685 and 686 (http://www.bea.doc.gov/bea/gpxind-d.htm++curr). |
|||||||||
1977). Sectors selected include electronics manufacturing, manufacturing, durable goods, electric and electronic equipment; communications (including telephone and telegraph and radio and television broadcasting); motion pictures; amusement and recreation services; and printing and publishing. Of these, electronics manufacturing and communications are the dominant categories, with publishing third; so, if dollars of activity represented a viable approach, one would expect to see, in line with the data on information-sector activity presented above, a significant increase in the percentage of GDP represented by these activities. This does not happen; over a 15-year period the increase is from about 6.5 percent to about 6.9 percent. Either the increase in information capacity in the U.S. economy is illusory or these data do not capture the trend.
The latter appears most likely. Some significant sources of error might include the rapidly dropping cost trends in information technology, which, because capability per dollar rapidly increases, makes dollars a poor, and significantly underestimating, proxy for measuring the underlying technology. In addition, much of the information products’ value-added comes not from their information content (which is what one wants to measure), but is marked up through the supply chain. Thus, for example, it costs about $1.50 to manufacture a CD, which sells for about $15.00; the $13.50 difference represents packaging, transportation, overhead on stores, profit for various firms involved in distribution, and so forth. Counting this amount for purposes of information density is inappropriate: What is being measured is value-chain economics and profit margins rather than information content. Moreover, a contrary effect also exists: As the automobile example illustrates, much information content is embedded in artifacts and infrastructure systems the economic value of which is captured in these data in noninformation sectors such as manufacturing and transportation. As is the case with any fundamental enabling technology, the use of which is diffused throughout the economy, measures based on sectoral data are unlikely to be sufficiently correlated to be useful.
Accordingly, a less ambiguous alternative measure would be attractive. An interesting possibility is simply tracking the number of appropriate professionals, such as software engineers, available in the economy, on the grounds that, whatever the sector, most information systems require at some point the development of software as a critical input. Unfortunately, this approach also appears to be flawed because available data appear to be inadequate, and for more fundamental reasons as well.
An obvious way to attempt to capture this effect, for example, is to review the educational output. Here the most appropriate categories by which data are collected are communications, which includes associated technologies, and computer and information sciences. The results, shown in Table 6, are ambiguous: The number of bachelor’s degrees earned in computer and information sciences in the United States, for example, actually has fallen significantly since 1985, although some of this effect may be explained by the increase in the number of
TABLE 6 Degrees Earned in Information-Related Fields, 1971–1993
|
Degree |
1971 |
1980 |
1985 |
1990 |
1993 |
|
Bachelor |
|||||
|
Communications and technologies |
10,802 |
28,616 |
42,002 |
51,308 |
54,706 |
|
Computer and information sciences |
2,388 |
11,154 |
38,878 |
27,257 |
24,200 |
|
Masters |
|||||
|
Communications and technologies |
1,856 |
3,082 |
3,669 |
4,362 |
5,209 |
|
Computer and information sciences |
1,588 |
3,647 |
7,101 |
9,677 |
10,163 |
|
SOURCE: Bureau of the Census, 1996, Table 302. |
|||||
master’s degrees in the same category. Nonetheless, overall growth in educational output in both fields remains surprisingly small, probably indicating the fact that capability in both fields can be developed from a number of educational backgrounds.
Nor are employment data necessarily any help. Table 7 shows that, on a sectoral basis, employment has shifted somewhat unpredictably, presumably reflecting the extensive industrial reorganizations, changes in working conditions, and productivity increases that have characterized the recent past in the United States. On the other hand, data on employment by occupation show a more robust growth, especially in mathematicians and computer scientists (Table 8), although given the time span, the growth rates are not, perhaps, unusual. The Bureau of the Census (1996) also projects that related employment categories will grow rapidly: The third fastest growing occupation is listed as systems analysts (from
TABLE 7 Employment by Selected Information Industry Sectors
|
|
Number Employed (in thousands) |
||
|
Sector |
1983 |
1994 |
2005 (projected) |
|
Electronics and other electrical equipment |
1,704 |
1,571 |
1,408 |
|
Communications equipment |
279 |
244 |
210 |
|
Electronics components |
563 |
544 |
553 |
|
SOURCE: Bureau of the Census, 1996, Table 642. |
|||
TABLE 8 Employment by Occupation, 1983 versus 1995
|
|
Number Employed |
|
|
Occupation |
1983 |
1995 |
|
Electrical and electronic engineers |
450,000 |
611,000 |
|
Mathematicians and computer scientists |
463,000 |
1,195,000 |
|
SOURCE: Bureau of the Census, 1996, Table 637. |
||
483,999 in 1994 to 928,000 in 2005, medium projection) and the fourth fastest is computer engineers (195,000 in 1994 to 372,000 in 2005, medium projection).
This brief exercise leads to the conclusion that employment data, although informative, are an inappropriate metric for the information density of the economy. Significant changes in productivity, business structure, and technology are not captured by such measures. For example, data compression and more efficient spectrum utilization technologies have significantly boosted the information capacity available from a given bandwidth; thus, one could have the same number of people working with the same asset base and yet have discontinuous increases in the available information transmission capacity per employee. An employee of a chip manufacturer might be producing slightly more chips per hour, leading to a slight increase in measured productivity, but the chip itself will be far more capable, and far faster, than the previous generation. In such a case, the output per employee measured by chip increases slightly, and the output measured by unit of computation power rises far more dramatically. Indeed, such problems bedevil current efforts to improve traditional economic data collection to provide valid insights and information as the economies of developed countries shift from a manufacturing base to a services base (National Research Council, 1994).
In addition to these measurement problems, another trend in information generation casts serious doubt on any employment-based measure of the information density of the economy. That is, of course, the greatly increased capability of tools, which allow virtually any competent lay person to create information, such as home pages on the World Wide Web or e-mail in bulk, or even, for that matter, massive amounts of personal video; information production increasingly is not limited to specialists. Moreover, the clock time of such information is much shorter than with traditional forms: e-mail is routinely deleted out by the recipient, leaving no trace, whereas letters written in the eighteenth century are still used today by historians. Thus, capturing the existence of such information is more difficult; moreover, the choice of a time dimension in considering information generation and flow in the information economy is critical.
Thus, it appears that only a more rigorous approach, focused on actual information content and manipulation within the economy itself, offers the opportunity to develop viable metrics and indicators for the information density of the economy. The difficulties of accomplishing such a task are legion: Consider the infrastructure that is required to capture economic data on industrial activity. Although developing the appropriate methodology is obviously a task far beyond a single paper, an outline for doing so can be suggested.
The first step is to rigorously define the concept of information density and establish appropriate boundaries. Should, for example, the attempt be made to define the information density of the global economy, of developed country economies [e.g., the Organization for Economic Cooperation and Development (OECD) countries], or of national economies? Parallel to this definitional effort, a taxonomy of data requirements should be developed: What data, if they could be gathered, would be necessary to quantify the defined concept? Where developing the data is either technologically or practically unachievable, the boundaries might have to be adjusted (e.g., if reliable data exist only for the OECD countries, one might begin with them despite the global nature of the information industry, perhaps extending the analysis to the global economy through heuristic rules of thumb).
One possible taxonomy, for example, might involve the collection of the following three components of the information industry:
-
storage capacity, including, for example, memory chips, hard drives, CDs, tapes, and books
-
transmission capacity, measured by available bandwidth at all scales, from international networks, to national and local networks, to firm- and facility-specific networks, excepting the chip level
-
information manipulation capacity, including both software and hardware (perhaps measured by number of transistors per chip)
Other taxonomies might be available as well, and some categories might need to have surrogate measures developed (e.g., measuring available bandwidth might be problematic, so the number of available ports in switches in networks might be a surrogate measure). Undoubtedly, developing the appropriate measures will be difficult, but given the fundamental importance of the trend being measured—the Information Revolution itself—it is clearly both appropriate and responsible to begin the process. From the perspective of the industrial ecologist, such a task is a prerequisite to substantive understanding of the phenomenon suggested at the beginning of this paper, the substitution of information and intellectual capital for other inputs into the economy. Without such tools, anecdotes, analogies, and data bites are enticing and alluring but ultimately subjective and unscientific. Here, as in many places in the field, the challenge to the industrial ecologist is to move beyond that stage.
CONCLUSION
There is an intuitively appealing synergy between the Information Revolution and the concept of sustainability, with some basis in theory and some support from trend data. Such a synergy offers the possibility that future economic activity could support both a high quality of life and a desirable, sustainable world. Nonetheless, there are considerable difficulties in establishing a rigorous, rather than anecdotal, basis for this hypothesis, and much work remains to be done before such a hypothesis can be considered robust, much less demonstrated.
NOTES
REFERENCES
Allenby, B.R. 1997. An industrial ecology research agenda. Pollution Prevention Review 8(1):17–38.
Allenby, B.R. 1998. Industrial Ecology: Policy Framework and Implementation. Upper Saddle River, N.J.: Prentice-Hall.
AT&T Technology and the Environment (Special Issue). 1995. AT&T Technical Journal 74(6).
Benbrook, C.M., with E.Groth III, J.M.Halloran, M.K.Hansen, and S.Marquardt. 1996. Pest Management at the Crossroads. Yonkers, N.Y.: Consumers Union.
Bureau of the Census. 1996. Statistical Abstract of the United States. Washington, D.C.: U.S. Department of Commerce.
Buzbee, B. 1993. Workstation clusters rise and shine. Science 261(5123):852–853.
Chichilnisky, G. 1996. The Knowledge Revolution. Columbia University Discussion Paper Series No. 9697–06. New York: Columbia University.
Cohen, J.E. 1995. How Many People Can the Earth Support? New York: W.W.Norton.
Craig, E. 1997. Personal communication. Sun Microsystems.
de Geus, A. 1997. Presentation on the knowledge economy at AT&T, Basking Ridge, N.J. September 9.
The Economist. 1994a. Manufacturing technology, center section survey. March 5, pp. 1–22.
The Economist. 1994b. New-age transport: Trains, planes and automobiles. January 7, pp. 96–98.
EIA. 1996. International Energy Outlook, 1996 with Projections to 2015. Washington, D.C.: U.S. Department of Energy.
Floren, P. 1997. Intel making PCs roadworthy. International Herald Tribune. September 10, p. 13.
Graedel, T.E., and B.R.Allenby. 1995. Industrial Ecology. Upper Saddle River, N.J.: Prentice-Hall.
Graedel, T.E., and B.R.Allenby. 1997. Industrial Ecology and the Automobile. Upper Saddle River, N.J.: Prentice-Hall.
IEEE (Institute of Electrical and Electronics Engineers). 1993–1997. Proceedings of the International Symposium on Electronics and the Environment. Piscataway, N.J.: IEEE.
IEEE. 1995. White paper on sustainable development and industrial ecology. IEEE, Piscataway, N.J. IMF (International Monetary Fund). 1997. World Economic Outlook: A Survey. Washington, D.C.: IMF.
Japan Ministry of Posts and Telecommunications. 1995. Communications in Japan. Tokyo: Japan Ministry of Posts and Telecommunications.
Jurgen, R.K. 1995. The electronic motorist. Spectrum 32(3):37–48.
Krebs, S. 1993. Advanced engine management systems: the key to reduced emissions and improved performance. Siemens Review (Fall):14–17.
Kurtzman, J. 1997. Interview with Paul Romer. Focus on the Future (April/June):24–35.
Lando, D. 1996. Presentation at Industrial Ecology Conference. Murray Hill, N.J., May 22, 1996.
Lewis, T. 1997. Cyberview: www.batmobile.car. Scientific American 277(1):38.
MacKenzie, J.J. 1994. The Keys to the Car. Washington, D.C.: World Resources Institute.
Magretta, J. 1997. Growth through global sustainability: an interview with Monsanto’s CEO, Robert B.Shapiro. Harvard Business Review 75(1):78–88.
MCC (Microelectronics and Computer Technology Corporation). 1993. Environmental Consciousness: A Strategic Competitiveness Issue for the Electronics and Computer Industry. Austin, Texas: MCC.
MCC. 1994. Electronics Industry Environmental Roadmap. Austin, Texas: MCC.
National Research Council. 1992. Automotive Fuel Economy. Washington, D.C.: National Academy Press.
National Research Council. 1994. Information Technology in the Service Society. Washington, D.C.: National Academy Press.
Pacific Economic Cooperation Council. 1996. Pacific Economic Development Report 1995: Advancing Regional Integration. Singapore: Pacific Economic Cooperation Council.
Rejeski, D. 1997. An incomplete picture. Environmental Forum 14(5):26–34.
Thompson, M. 1996. The thick and thin of car cabling. Spectrum (February):42–45.
Wernick, I.K., R.Herman, S.Govind, and J.H.Ausubel. 1996. Materialization and dematerialization: measures and trends. Daedalus 125(3):171–198.
Wriston, W.B. 1997. Bits, bytes, and diplomacy. Foreign Affairs 76(5):172–182.


