
3
U.S. Trends in All-Cause Mortality Among Working-Age Adults
The United States has experienced higher mortality among working-age adults (ages 25–64) relative to other high-income countries since at least the mid-20th century (see Chapter 2). Beyond this long-standing difference, something changed in the 21st century to rapidly expand the gap in working-age mortality between the United States and its peers. Since 2010, this change in working-age mortality has been large enough to stall and then reverse the decades-long trend of increasing life expectancy at birth within the United States (Arias and Xu, 2019). To aid in understanding this phenomenon, this chapter presents trends in all-cause mortality (i.e., all deaths from any cause) that occurred in this age group over the study period (1990–2017) in the United States, stratified by individual and geographic characteristics. Examining differences in trends by such individual characteristics as age, sex, race and ethnicity, and socioeconomic status, as well as by geographic characteristics, can provide insights into among whom and where mortality rates have increased.
The chapter begins with an overview of trends in all-cause mortality rates among working-age adults by age and sex over the study period. The second section focuses on racial/ethnic disparities in these rates over the same period, which are shown by the international comparisons in Chapter 2 to have persisted for a long time within the United States. Next is a review of existing literature on trends in socioeconomic disparities in mortality. Finally, geographic differences in trends in mortality rates are examined, including differences by metropolitan area size, region, state, and county.
In the analyses presented in this chapter, deaths were pooled across 3-year periods from 1990 to 2017, with the exception of the first period
(1990–1993), which includes 4 years. Chapter 5 provides an overview of the data and analytic methods on which the discussion in this chapter is based.
The results of these analyses reveal a troubling stagnation and increase in mortality that affected both males and females starting in 2010, regardless of age and race and ethnicity. Among non-Hispanic (NH) White (White) females and males, this marked a continuation of trends that began in the 1990s and 2000s, respectively, and were heavily concentrated among those with a high school degree or less. In contrast, among NH Black (Black) and Hispanic males and females, this trend marked the end of a long period of decreasing mortality and narrowing racial/ethnic disparities in mortality.
The changes in mortality were the result of growing geographic disparities in mortality that favored large central metropolitan areas. Dramatic mortality decreases within large metropolitan areas were often the driving force behind large county and statewide improvements in mortality. These large central metropolitan areas experienced large declines in mortality between 1990–1992 and 2015–2017, while mortality increases were more heavily concentrated in nonmetropolitan areas. The growing disparities in mortality between large central metropolitan areas and less populated areas were more striking and consistent among Whites. These troubling reversals in long-term improvements in mortality rates across multiple demographic groups raise concerns about the outlook for future U.S. mortality trends.
TRENDS IN ALL-CAUSE MORTALITY BY SEX AND AGE
Starting in the early-2010s,1 all-cause mortality rates stagnated or increased among working-age adults in the United States, regardless of sex or age decile (Figure 3-1).2 Between 1990 and 2011, mortality rates did not decrease steadily over time, nor did they decline uniformly across sex and age groups. Although mortality among males ages 35–64 declined throughout the 1990s and 2000s, mortality among males ages 25–34 declined in the 1990s, stagnated in the 2000s, and increased after 2011. Females experienced little progress, with their mortality rates remaining mostly flat3 between the 1994–1996 and 2006–2008 periods. Particularly concerning
___________________
1 To simplify the discussion throughout the chapter, the text refers to the decadal periods of the 1990s (1990–1993 vs. 2000–2002), the 2000s (2000–2002 vs. 2009–2011), and the 2010s (2009–2011 vs. 2015–2017) where relevant.
2 As shown in Figure 3-1, mortality rates are reported here for four age deciles: 25–34, 35–44, 45–54, and 55–64.
3 An exception occurred for females ages 55–64, among whom mortality declined steadily until the late 2000s. Among females ages 25–34, mortality rates were slightly higher in 2015–2017 than they were in 1990–1993, and among females ages 35–44, the rates were nearly identical in 1990–1993 and 2015–2017.
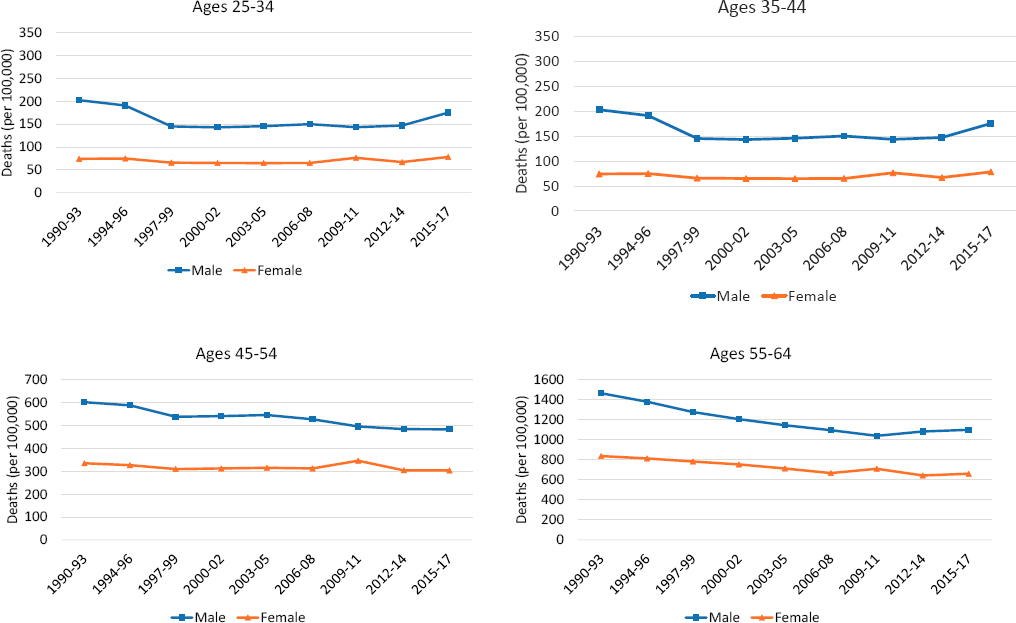
NOTE: All-cause mortality rates (number of deaths per 100,000 population) are shown for males and females and for four working-age deciles (ages 25–34, 35–44, 45–54, and 55–64). The blue lines show mortality rates for males, while the orange lines show mortality rates for females. To ensure comparability over time and across subpopulations, rates are age-adjusted by single year of age and standardized to reflect the age distribution of the U.S. population in 2000. Deaths were pooled across 3-year periods, with the exception of the first period (1990–1993), to smooth large fluctuations in mortality trends that sometimes occur when smaller populations have relatively low death counts.
SOURCE: Data from https://www.cdc.gov/nchs/nvss/nvss-restricted-data.htm.
is the reversal and upward tick in mortality rates among both males and females between 2012–2014 and 2015–2017. With the exception of mortality among those ages 45–54, mortality rates among both sexes in the other three age deciles were higher in 2015–2017 than they were in 2012–2014.
Although mortality declined overall over the study period among working-age males and older females, these trends meant that mortality rates changed little among younger working-age females between 1990–1993 and 2015–2017. Among females ages 35–44, mortality rates were nearly unchanged, while among females ages 25–34, the rates were higher in 2015–2017 than in 1990–1993. In contrast, because working-age males saw declines in mortality during the 1990s and 2000s that exceeded the recent increases, their mortality rates remained lower in 2015–2017 than in 1990–1993, despite the increases in mortality they experienced in the 2010s.
TRENDS IN ALL-CAUSE MORTALITY BY SEX, AGE, AND RACE AND ETHNICITY
As noted earlier, the United States has a long history of racial/ethnic disparities in mortality, and these disparities remained sizeable in 2015–2017 (Figure 3-2). Although working-age NH Black (Black) adults experienced large declines in mortality rates4—outpacing the decline among working-age NH White (White) adults and narrowing the Black–White mortality gap—their rates remained substantially higher than those among White adults at the end of the study period. Working-age Hispanic adults maintained the lowest mortality rates throughout the period. Although the committee calculated mortality rates and examined trends for working-age NH Asians/Pacific Islanders and NH American Indians/Alaska Natives (AI/ANs), data for these groups are not presented because of concerns about the accuracy of death certificate coding of race and ethnicity for these groups (Arias, Heron, and Hakes, 2016). Summaries of existing research (based on alternative data sources) of mortality trends in these groups are presented in Boxes 3-1 and 3-2, respectively.
Among both Black and Hispanic working-age adults, all-cause mortality rates decreased throughout the 1990s and 2000s, but this was not the case among all working-age White adults. For both males and females, mortality rates among White adults ages 25–545 stagnated or increased during most of the 1990s and 2000s. Only those ages 55–64 experienced decreases in mortality during this period. After 2009–2011, all-cause mortality rates stagnated or increased among working-age adults regardless of age, sex, or race and ethnicity. Most concerning, in the most recent period of this analysis (2012–2014 to 2015–2017), mortality rates ticked upward among most of these groups, including those ages 25–44 of both sexes and all three races/ethnicities, White males and females ages 45–64, Black males ages 45–54, and Black females ages 55–64. In fact, among White males and females ages 25–44 and White females ages 45–54, mortality rates in 2015–2017 were already higher than they were in 1990–1993. These troubling reversals across multiple demographic groups erased years of progress in lowering mortality rates and raise concerns about the future outlook for U.S. mortality trends.
___________________
4 As a percentage, rate declines were especially pronounced among Black and Hispanic males ages 25–44 and 45–54.
5 In this section, the age groups 25–34 and 35–44 were combined to simplify presentation of the results because trends in mortality rates among these two groups were virtually identical (although the absolute rates were higher in the 35–44 group).
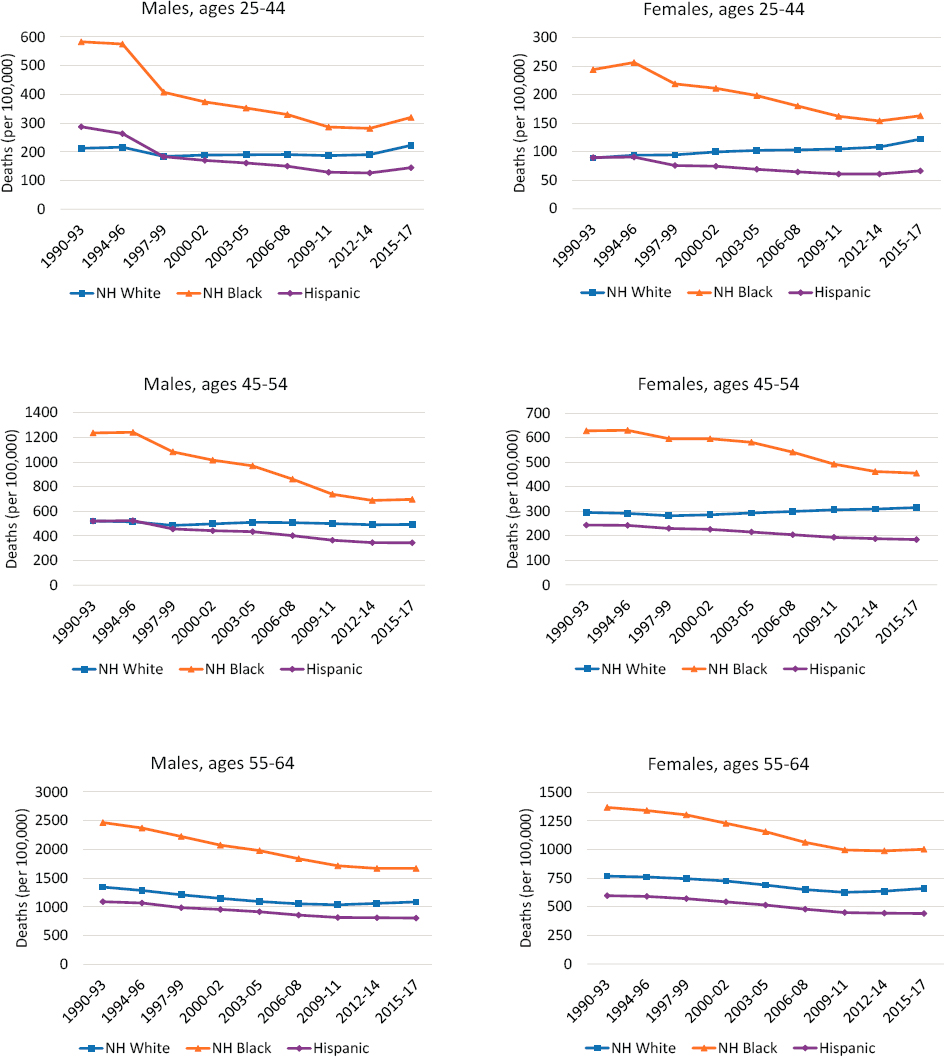
NOTE: Age-adjusted all-cause mortality rates are shown for non-Hispanic (NH) White (blue lines), NH Black (orange lines), and Hispanic (purple lines) males (left panels) and females (right panels) by age group. The rates are presented for three age groups: 25–44 (top panels), 45–54 (middle panels), and 55–64 (bottom panels). Rates are age-adjusted by single year of age to a standard population age distribution.
SOURCE: Data from https://www.cdc.gov/nchs/nvss/nvss-restricted-data.htm.
TRENDS IN MORTALITY BY SOCIOECONOMIC STATUS
This section summarizes the existing research on trends in all-cause mortality by socioeconomic status (SES). The committee elected to present this summary instead of conducting original analyses because of limitations of the SES data in the death certificate files in the National Vital Statistics System (NVSS) used to generate the original analyses documented in this report, some of which differentially affect mortality estimates for low- and high-SES individuals. One important limitation of these data is that the NVSS files include only a single measure of SES—educational attainment—and this measure, when drawn from death certificates, suffers from well-established issues of accuracy, availability, and quality (Rostron, Boies, and Arias, 2010). A more detailed discussion of this issue is provided in Chapter 5.
The committee therefore carried out a comprehensive review of research that has used NVSS data, as well as alternative data and methods, to assess disparities in mortality by SES. This review considered studies using data that linked survey data to death records to improve the quality of education reports,6 as well as studies that accounted for changes in the distribution of education in the population over time. As educational attainment increases within the United States, the meaning and benefit of each level of education, as well as the relative socioeconomic position of those who attain that level of education, also change (Dowd and Hamoudi, 2014). The committee reviewed the findings of studies that account for this by using education rank within the educational distribution rather than educational attainment (e.g., Geronimus et al., 2019). The committee also reviewed research using other measures of SES, such as income (e.g., Chetty, Hendren, and Katz, 2016), but there were few studies that relied on measures other than education or income. This review found that a large set of studies—using different data sources, measures of SES, and analytic methods—convincingly documents widening disparities in mortality by SES among working-age Whites in the United States since the 1990s but not among working-age Blacks. Too few studies examine disparities in mortality by SES among Hispanic adults or other racial/ethnic groups for that information to be reported here. The highest-quality and/or most influential studies are discussed below.
A classic study by Kitagawa and Hauser (1973) was among the first to provide comprehensive documentation of socioeconomic disparities in U.S. adult mortality, showing lower mortality among individuals with
___________________
6 The strengths and limitations of these linked survey data are also discussed in Chapter 5.
higher versus those with lower levels of educational attainment and family income. Using 1960 U.S. Census data linked to death certificates for those dying in the 4 months after the U.S. Census was conducted, the authors demonstrated that relative disparities in mortality by education and family income were wider for working-age (25–64) than for older (65+) adults and for Whites than for non-Whites. Relative mortality disparities by educational attainment were generally wider among women, while relative disparities by family income were generally wider among men. However, Kitagawa and Hauser (1973) cautioned that income disparities in mortality are subject to bias because family incomes may decline in the years preceding deaths among family members as a result of health-related job losses and retirements that are themselves associated with both lower income and higher mortality risk. They argued that educational attainment may outperform income as a socioeconomic predictor of mortality risk, a view recently echoed in major literature reviews on the topic (Elo, 2009; Hummer and Hernandez, 2013).
A large body of research on the topic followed the Kitagawa and Hauser (1973) study, with most studies finding that socioeconomic disparities in working-age mortality widened between 1960 and 1990 because of steeper mortality declines among those with higher versus lower educational attainment and income over that period, particularly among White men (Duleep, 1989, 1998; Elo and Preston, 1996; Lauderdale, 2001; Preston and Elo, 1995). For example, Crimmins and Saito (2001) estimated that the disparity in life expectancy among White men at age 30 between those with 0–8 years of education and those with 13 or more years grew from 4.1 to 6.7 years between 1970 and 1990 (Crimmins and Saito, 2001). Similarly, Cutler, Meara, and Richards-Shubik (2011) showed that educational disparities in mortality for White adults ages 25–74 widened between the 1970s and 1990s. By 1990, then, it was clear that there were wide socioeconomic disparities in U.S. working-age mortality by both educational attainment and family income, with especially large disparities for White men and women (Pappas et al., 1993).
Since 1990, major data innovations have provided even stronger evidence of growing socioeconomic disparities in mortality (Hummer and Lariscy, 2011). First, educational attainment was added to the Standard U.S. Certificate of Death in 1989. While states differed in the timing of their adoption of this new item, some studies now trace educational disparities in working-age mortality on a yearly basis back to 1990; such data also facilitate documentation of changes in detailed cause-specific mortality by educational attainment for most of the United States. Second, several large, nationally representative surveys, such as the National Health Interview Survey and the Current Population Survey, began systematically linking their respondents to the National Death Index. Such linked datasets
provide analysts with self-reported data on educational attainment and family/household income that are statistically linked to follow-up mortality records. Third, researchers more recently have linked more than 1 billion individual-level income records from tax data compiled by the Internal Revenue Service to follow-up mortality data from the Social Security Administration to examine detailed trends in adult mortality by income (Chetty, Meara, and Richards-Shubik, 2016).
Using these new sources of data and measures of SES, a new set of studies has convincingly documented widening disparities in mortality among working-age adults in the United States since the 1990s. The most prominent study using income as the primary measure of SES is that of Chetty, Meara, and Richards-Shubik (2016), who used income tax data and follow-up mortality records to examine trends in all-cause mortality for adults ages 40–76 between 2001 and 2014 but did not evaluate disparities for different racial/ethnic groups. They report very little change in mortality rates for those in the bottom 5 percent of the income distribution but a marked decrease in mortality among those in the top 5 percent. As a result, the disparity in mortality by individual-level income increased starting at the beginning of the 21st century, with estimated life expectancy differences of 10.1 years among women and 14.6 years among men for those in the highest and lowest income percentiles in the country, respectively.
The literature on trends in working-age mortality by educational attainment is much more extensive than that on trends by income. Several prominent studies (Jemal et al., 2008; Meara, Richards, and Cutler, 2008; Montez et al., 2011) report widening mortality differences by educational attainment among working-age Whites between the late 1980s/early 1990s and the late 1990s/early 2000s that were more pronounced among women than men. Moreover, those studies also document increasing working-age mortality among White women with less than a high school education during the 1990s alongside continued declines in working-age mortality among White women with a college degree or higher. While Jemal and colleagues (2008) and Montez and colleagues (2011) found no evidence of widening educational disparities in working-age mortality among Black adults, Meara, Richards, and Cutler (2008) and Masters, Hummer, and Powers (2012) each report a modest widening of educational differences in working-age mortality in this population.
Most striking, Sasson (2016) used vital statistics data to demonstrate substantially widening educational disparities in working-age mortality for Whites, with rates among White women and men with less than a high school degree exhibiting substantial increases between 1990 and 2010. White women and men with a high school degree also exhibited modestly increasing working-age mortality rates between 1990 and 2010. At the same time, Black women and men of all educational levels exhibited
mortality decreases across the 20-year period (Sasson, 2016). As a result, there was little change in educational disparities in life expectancy for Black women and men during this period, but there were steep increases in educational disparities in life expectancy for White women and men. Similar to the disparities by income, life expectancy for women and men varies by 10–12 years, respectively, among those with the highest and lowest levels of educational attainment.
Most recently, Geronimus and colleagues (2019) document changes in educational disparities among Black and White women and men of working age (and older) between 1990 and 2015. Previous research on educational disparities in mortality has been criticized for not taking into account changes that occur in the characteristics of people within education categories as educational attainment increases in the population over time (Dowd and Hamoudi, 2014). Therefore, Geronimus and colleagues measured educational attainment in quartiles, comparing changes in mortality disparities between 1990 and 2015 among those in the bottom 25 percent of the educational attainment distribution versus those in the top 25 percent. Their results, consistent with those of the above studies, showed that educational disparities in mortality among those ages 25–64 had widened for White men and women since 1990.
GEOGRAPHIC DIFFERENCES IN MORTALITY TRENDS
The national trends reported thus far in this chapter mask considerable geographic variation in mortality that occurred across the nation during the study period. This section presents trends in all-cause mortality across several measures of U.S. geography: metropolitan status, region, state, and county.7 In these analyses, metropolitan status is classified into four groups8: (1) large central metropolitan areas (counties in metropolitan statistical areas [MSAs] of more than 10 million population, including counties that contain all or part of the area’s inner cities, hereafter referred to as “large central metros”); (2) large fringe metropolitan areas (surrounding counties of the large central metros, hereafter referred to as “large fringe metros”), corresponding to suburbs; (3) small and medium metropolitan areas (counties in MSAs of 50,000–999,999 population, hereafter referred to as “small/medium metros”); and (4) nonmetropolitan areas (counties outside of metropolitan areas, hereafter referred to as “nonmetros”), corresponding
___________________
7 To simplify the analyses and improve the quality of estimates for smaller geographic levels, only two age groups were used for these analyses: 25–44 and 45–64 years.
8 To maintain consistency over time, the counties’ metropolitan categories were assigned based on the 2013 classification scheme of the U.S. Department of Agriculture Economic Research Service. For more information, see Chapter 5.
to rural areas. Region of the United States is classified into the four broad areas of the United States defined by the U.S. Census Bureau: Northeast, Midwest, South, and West.
Trends in All-Cause Mortality by Metropolitan Area Type
Two clear trends emerged over the 1990–2017 period to produce growing disparities in mortality among metropolitan area types, disparities that were particularly large among working-age Whites (Figure 3-3). First, working-age adults in large central metros experienced the most favorable trends in mortality over the period, driven by large improvements in mortality during the 1990s and 2000s that far exceeded those occurring in less-populated areas. When mortality increased in large central metros during these two decades, as it did among younger working-age White females (ages 25–44), these increases were smaller than those in other areas. Among younger White males, decreasing mortality in large central metros was large enough to mask the emergence of increasing mortality elsewhere. Working-age adults in large central metros continued to experience a mortality advantage in the 2010s compared with those in less-populated areas, but this advantage was smaller than in the two previous decades as improvements in mortality stalled or reversed in most areas. Although older Black males and females continued to see decreases in mortality in the 2010s, these improvements were much smaller than those of previous decades.
The second clear trend that emerged is a growing working-age mortality disadvantage outside of large central metros, particularly within nonmetros. Females (White, Black, and Hispanic) and White males in nonmetros experienced either the smallest improvements or the largest increases in mortality throughout the 1990s and 2000s. Younger working-age Whites experienced increasing mortality in all areas outside of large central metros, with the largest increases occurring in nonmetros. Among older White females, only those in nonmetros saw increasing mortality; mortality decreased in more populated areas. Older Black males experienced the smallest improvements in mortality in large fringe metros, while Hispanic males and younger Black males in small/medium metros did so. The one exception to these trends was older working-age Hispanic females, among whom mortality declined in parallel across most metro areas; only those living in large fringe metros experienced slower decreases in mortality relative to those in other areas. In the 2010s, mortality increases expanded to most working-age adults living outside of large central metros. Nonmetros continued to experience the least favorable trends among most older working-age adults, except older Hispanic males. Among younger working-age adults and older Hispanic males, however, mortality increased the
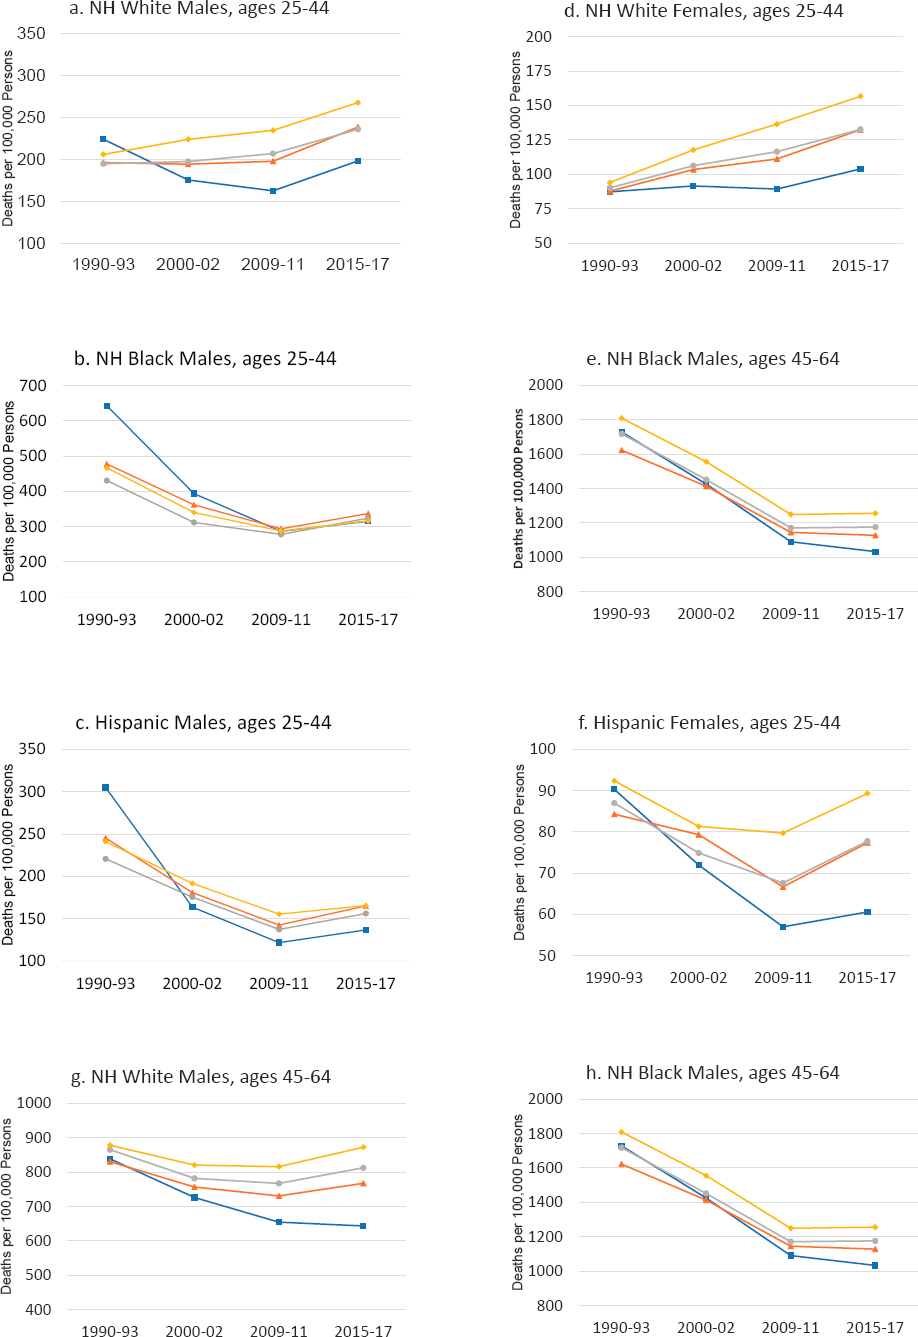
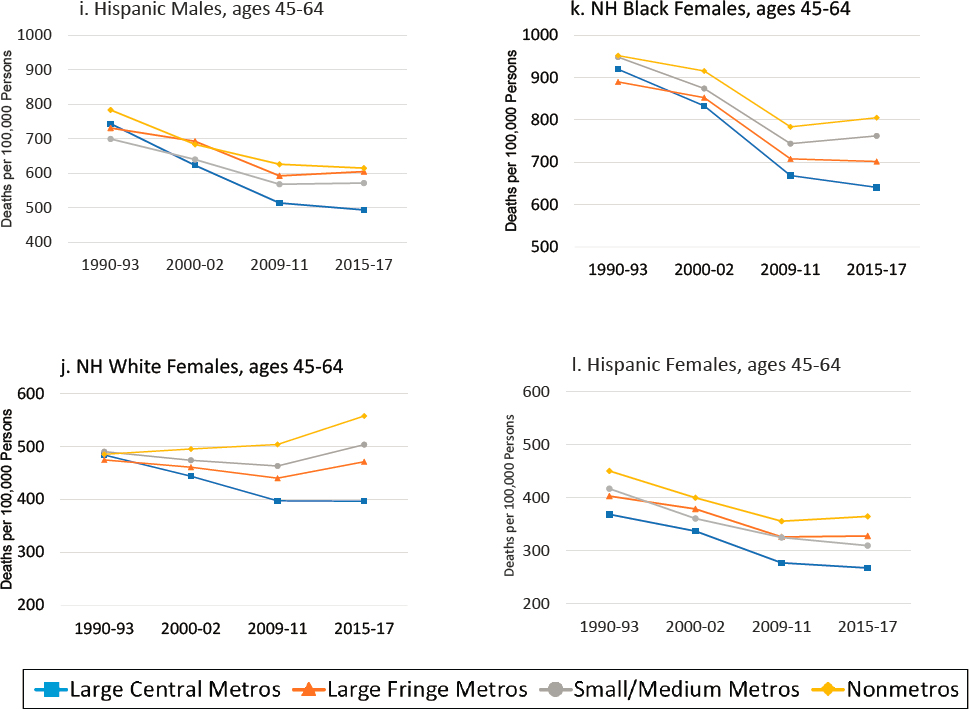
NOTE: All-cause mortality rates are shown for ages 25–44 (panels a-f) and 45–64 (panels g-l) across four levels of metropolitan status: (1) large central metropolitan areas (blue lines), (2) large fringe metropolitan areas (orange lines), (3) small or medium metropolitan areas (gray lines), and (4) nonmetropolitan areas (yellow lines). The rates in these four types of areas are presented separately by sex (males in panels a-c and g-i; females in panels d-f and j-l) and for non-Hispanic (NH) Whites (panels a, d, g, j), NH Blacks (panels b, e, h, k), and Hispanics (panels c, f, i, l). Rates are age-adjusted by 10-year age group.
SOURCE: Data from https://www.cdc.gov/nchs/nvss/nvss-restricted-data.htm.
most in large fringe metros, except among younger Black males, who saw slightly larger mortality increases in small/medium metros.
Taken together, these two trends led to a growing mortality gap between large central metros and nonmetros, except among younger Black and Hispanic males. Among younger Black and Hispanic males, extraordinarily high mortality within large central metros in 1990–1993 combined with the dramatic improvements in these areas over the subsequent two decades meant that the differences among metropolitan area types were smaller in 2015–2017 than in 1990–1993. In fact, younger working-age adults in large central metros generally had higher mortality rates in 1990–1993, but mortality rates in these areas were below those in less-populated areas
by the end of the period. At the same time, the unfavorable trends within nonmetros among working-age females (except older Hispanic females) and White males created a large and growing nonmetro mortality “penalty” that was particularly large among working-age Whites. The large relative improvements in mortality among Black adults, combined with increasing mortality in nonmetro areas among younger White adults, led to a significant narrowing of racial disparities in mortality between working-age Blacks and Whites over the period within all metropolitan area types.
Trends in All-Cause Mortality Across U.S. Regions and States
Figures 3-4a to 3-4d show trends in all-cause mortality between 1990–1992 and 2015–2017 for the 50 states,9 organized by the four U.S. Census regions. There was considerable variation in mortality rates across the regions and across states within regions, as well as within states, at both time points.
The Southern region of the United States maintained the highest mortality throughout the period; however, mortality in the Northeast among younger working-age adults, particularly younger males, was nearly as high as in the South in 1990–1992 because of very high mortality rates in New York and New Jersey. And while the Southern region had the highest mortality in 1990–1992, the Northeast experienced the largest improvement between those years and 2015–2017. Among younger adults, these improvements were driven entirely by large decreases in mortality in New York and New Jersey, but among older working-age adults, all-cause mortality rates improved substantially in all Northeastern states.
Mortality rates were lowest in the Western region of the United States in 1990–1992, except among younger working-age males. High mortality among younger males in California pushed the region’s mortality rate above that of the Midwest. By 2015–2017, however, mortality rates for younger males had decreased substantially in California while increasing slightly in the Midwest, leaving the Western region with the lowest all-cause mortality across the four regions. The increases in all-cause mortality among younger females between 1990–1992 and 2015–2017 were driven by increases in mortality in both the Midwest and the South; mortality rates among younger females decreased in the Northeast and West over this period. Although the Northeast experienced the most consistent improvements in mortality over the period, these gains were not large enough to offset that
___________________
9 The District of Columbia (DC) is excluded from the figures because mortality rates for DC in 1990–1992 were about twice those of other states, and its inclusion dramatically skewed the charts. The rates for DC are discussed in the text where relevant.
region’s higher mortality rates in 1990–1992, and the Western region continued to have the lowest mortality in 2015–2017.
Within U.S. Census regions, there was variation across states in how these regional trends were produced. In some regions, mortality trends were driven by changes within in a single populous state, such as among younger males in the Northeast and West. In other cases, trends were consistent across states within the region, such as among older adults in the Northeast. Consistent with the trends by metropolitan area type, the largest and most consistent improvements in mortality occurred in DC and in states with large populations that are anchored by large central cities, including New York, California, New Jersey, and Illinois. In contrast, the states that experienced the largest increases in mortality (or the smallest decreases among older working-age adults) were often characterized by larger proportions of the population in small/medium metros and nonmetros, as was the case, for example, in West Virginia, New Hampshire, Oklahoma, and New Mexico. In some regions, the differences among states within the region were larger than the differences across regions.
Northeast and West
The Northeast and West exhibited the most favorable trends in mortality rates between 1990–1992 and 2015–2017, with comparatively large mortality declines occurring across both sexes and age groups.10 These favorable trends were not uniform across the regions in both age groups, however. Younger working-age adults in upper New England, for example, had a different experience from that of their peers in states in the southern tier of the Northeast. Thus, while mortality for the Northeast region declined by 28.9 percent over the period among males ages 25–44, it decreased little in Massachusetts and Rhode Island and increased greatly in New Hampshire (64.7%) and Maine (38.5%). The region’s mortality reduction was driven mainly by very large declines in New York (56.6%) and New Jersey (33.0%). The decrease in New York was striking, with that state beginning the period with the nation’s highest mortality rate and ending it with among the lowest. New York consistently experienced the largest absolute reductions in mortality among all 50 states. Among older working-age adults, mortality improved in all Northeastern states, but the smallest increases occurred within Pennsylvania and Maine.
___________________
10 In the Northeast and West, respectively, mortality rates decreased by 28.9 percent and 33.1 percent among males ages 25–44, by 32.5 percent and 25.1 percent among males ages 45–64, by 17.7 percent and 8.4 percent among females ages 25–44, and by 29.0 percent and 22.8 percent among females ages 45–64. These declines exceeded those in the other two regions.
In the West, mortality among males ages 25–44 decreased even more (33.1%) than in the Northeast, but this reduction was driven by large decreases in California (46.5%), along with smaller decreases in nearby Nevada (26.3%) and Arizona (16.8%). Mortality increased moderately among males ages 25–44 in New Mexico and more substantially (47.2%) among females in that age group, and that state began and ended the period with the highest rates in the region. New Mexico was also the only state in the West to see increasing mortality among older working-age adults (ages 45–64). Rates among younger adults also increased in Montana, Wyoming, and Alaska, where older adults experienced only marginal improvements.
South
Relative to the other three regions, the South experienced the highest mortality—in both 1990–1992 and 2015–201711—and many of the largest increases in mortality throughout the period, particularly among females. Compared with their counterparts in the Northeast and the West, working-age males in the South experienced smaller declines in mortality, and while all-cause mortality decreased in the Northwest and West for females ages 25–44, it increased by 6.1 percent in the South. Although mortality declined by 10.2 percent within the region overall among females ages 45–64, the South accounted for all but one of the eight U.S. states in which mortality increased.12
West Virginia, Kentucky, Tennessee, Oklahoma, Arkansas, Alabama, and Mississippi had especially unfavorable mortality trends among working-age adults. West Virginia was particularly affected: Of all 50 states, it experienced the largest absolute increase in mortality rates among young adults (ages 25–44), the third largest increase among older females, and the smallest decrease in mortality among older males, and it ended the period with either the highest (ages 25–44) or second highest (ages 45–64) mortality rates in the nation.13 The adjacent state of Kentucky experienced
___________________
11 As of 2015–2017, states in the South had four of the five highest mortality rates among males ages 25–44 (West Virginia, New Mexico, Mississippi, Kentucky, and Alabama), four of the five highest mortality rates among females ages 25–44 (West Virginia, Kentucky, Alabama, New Mexico, and Mississippi), the five highest mortality rates among males ages 45–64 (Mississippi, West Virginia, Alabama, Kentucky, and DC), and the ten highest rates among females ages 45–64. DC, which experienced among the largest mortality rate declines (28.8%), still had the sixth highest mortality rate in 2015–2017.
12 The mortality rate increased in Mississippi, West Virginia, Oklahoma, Arkansas, Kentucky, Alabama, Tennessee, and New Mexico.
13 Mississippi experienced modest changes in mortality but ended the period with the nation’s highest mortality rates among adults ages 45–64.
the second highest absolute increase in mortality among young adults (ages 25–44).
The South was also the location of some of the states with the largest improvements in mortality, which occurred most notably in DC, Maryland, Virginia, North Carolina, Georgia, Florida, and Texas. Working-age adults in DC experienced the largest absolute decreases in mortality in the United States, and younger adults and older females experienced the largest percentage decreases.14 Aside from DC, several states in the South, including Texas, Georgia, and Florida, saw decreases in mortality of more than 20 percent. In many ways, the South represents a tale of two regions, with high and rising mortality rates in the east south central region and much of southern and central Appalachia, and major improvements in states along the Atlantic coast. Among females ages 45–64, for example, mortality increased in Oklahoma15 and Arkansas and a chain of states along the Appalachian trail (Mississippi, Alabama, Tennessee, Kentucky, and West Virginia), but decreased in some Gulf Coast states (Texas, Louisiana) and states stretching north along the Atlantic seaboard (Florida, Georgia, South Carolina, North Carolina, Virginia, Maryland, and Delaware).
Midwest
Between 1990–1992 and 2015–2017, young adults and older females in the Midwest experienced unfavorable mortality trends, with increasing mortality among the former group and only marginal increases among the latter. The industrial Midwest and the Dakotas saw the largest increases in mortality among younger working-age adults, although those in Illinois fared better. Whereas other regions of the nation saw mortality rates decrease for males ages 25–44 during the period, the Midwest—which began the period with comparatively low mortality—saw rates increase by 2.8 percent. Large increases in such states as Ohio (33.6%) were offset by a large improvement in Illinois (26.0%). Trends among females ages 25–44 were even less favorable; their mortality rates increased by 20.2 percent overall, with large increases in Ohio (55.0%), Indiana (41.2%), North Dakota (57.5%), and South Dakota (47.7%). Illinois was the only state in the region to experience a decrease in mortality among both
___________________
14 In DC, mortality rates decreased by 633.4 deaths per 100,000 (77.0%) among males ages 25–44, 164.2 deaths per 100,000 (64.0%) among females ages 25–44, 779.1 deaths per 100,000 (42.9%) among males ages 45–64, and 265.3 deaths per 100,000 (28.8%) among females ages 45–64.
15 The increase in Oklahoma was modest, but the state ended the period with the third highest mortality rates in the nation.
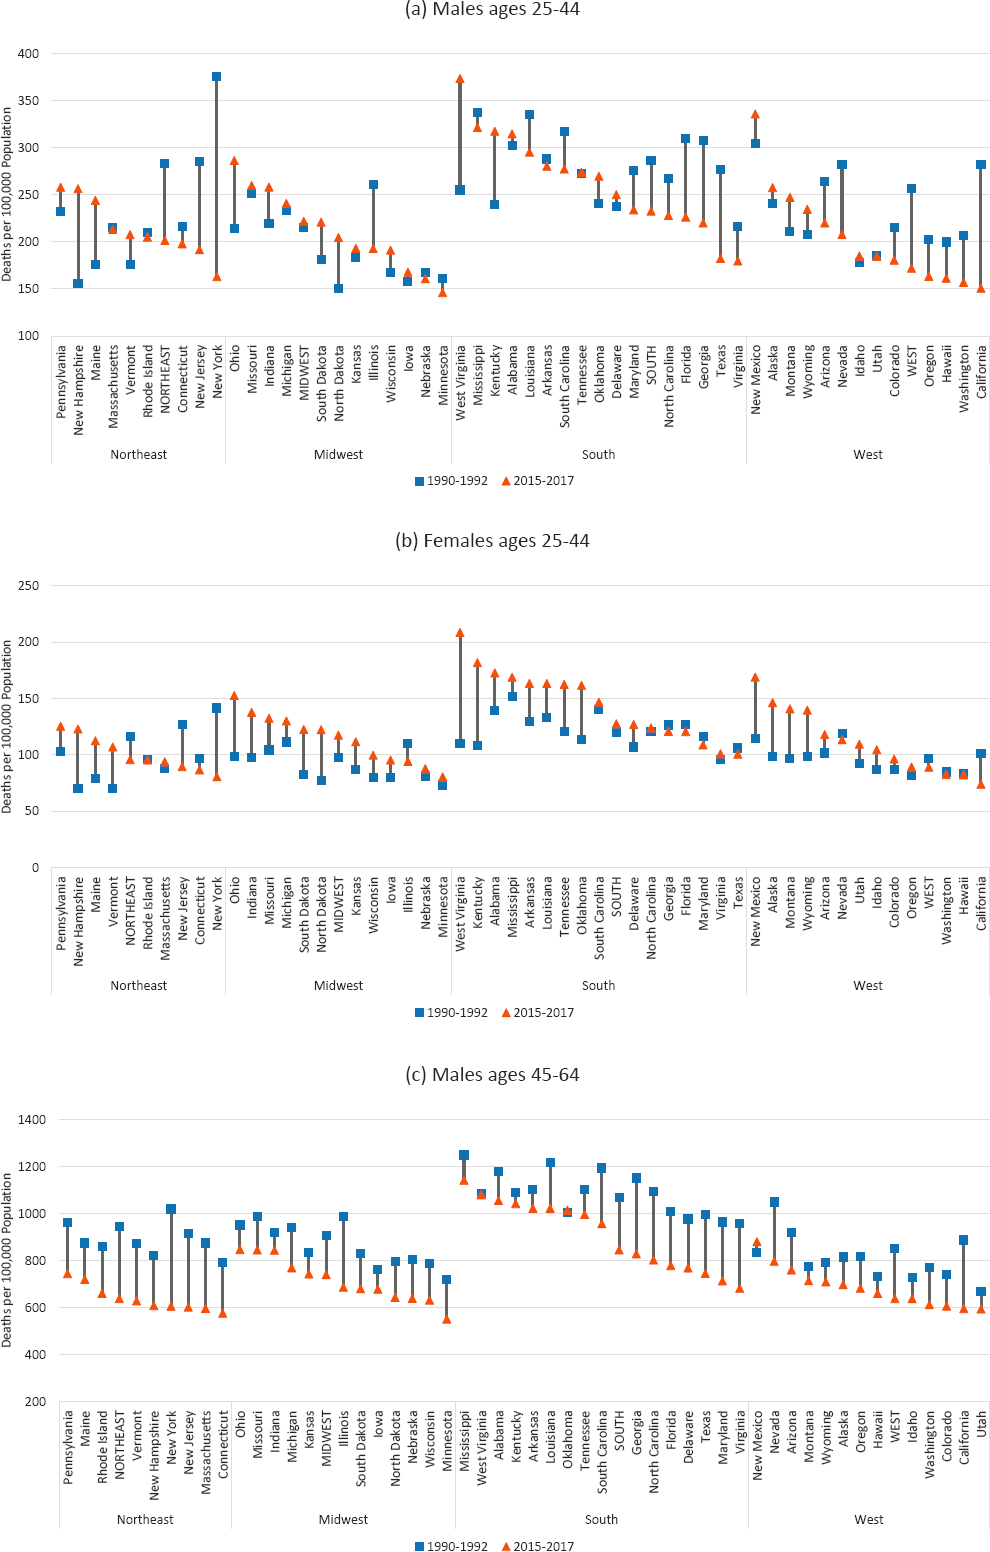
NOTE: Working-age mortality rates are shown for 1990–1992 (blue squares) and 2015–2017 (orange triangles). The length of the connecting lines between the 1990–1992 and 2015–2017 values indicates the absolute changes in the mortality rates. Rates are age-adjusted by 10-year age band. DC is excluded because of excessively high mortality in 1990–1992 that would have skewed the chart. States are sorted by highest to lowest mortality in 2015–2017 within U.S. Census region.
SOURCE: Data from https://www.cdc.gov/nchs/nvss/nvss-restricted-data.htm.
younger and older working-age adults. Although mortality decreased in the Midwest among males and females ages 45–64—by 18.4 percent and 12.5 percent, respectively—this decrease was smaller than that in any of the other three regions. Ohio, with its borders overlapping the Appalachian region, ended the period with the highest mortality rates in the region. Although Minnesota experienced only modest changes in mortality during the period, its mortality rates as of 2015–2017 were among the lowest in the nation.
Trends in All-Cause Mortality Across U.S. Counties
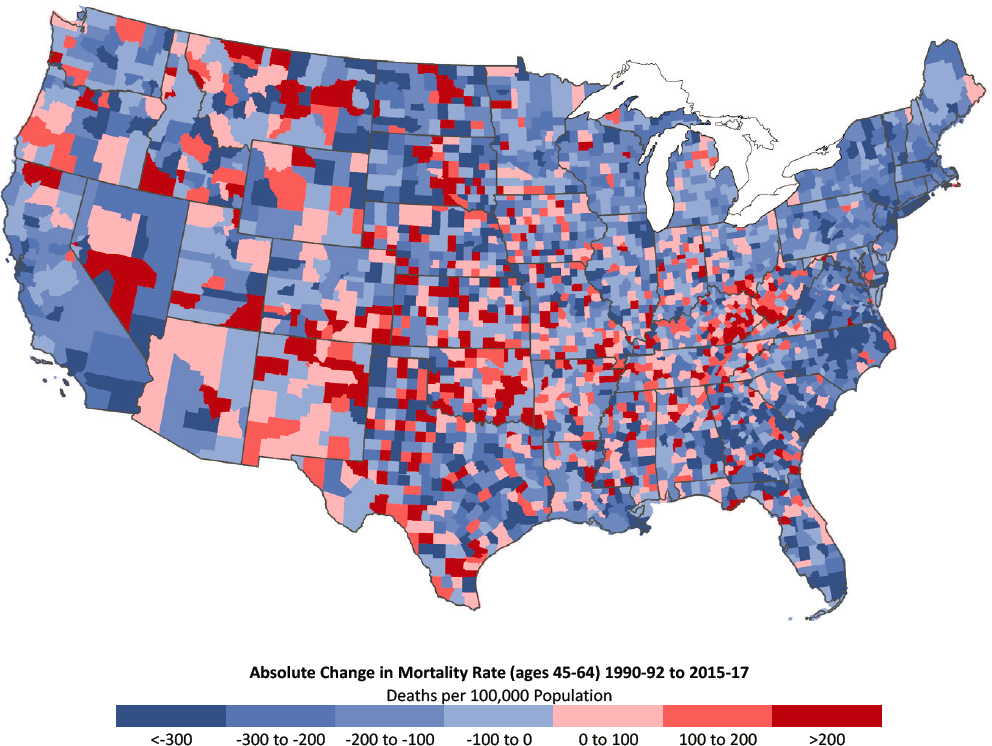
County-level mortality rates highlight the fact that just as mortality trends often varied dramatically across states within a region, they varied considerably across counties, including those within the same state (Figures 3-5 to 3-8). Indeed, these county-level within-state disparities can often exceed the disparities among states. These trends show that decreasing mortality within large central metros within a state can mask increasing
NOTE: Mortality rates are shown for 1990–1992 (left) and 2015–2017 (right). Counties are classified into quintiles based on sex- and age-specific mortality rates in 1990–1992. Quintiles with the most favorable mortality rates are dark blue, while those with the least favorable mortality rates are dark red. Consistent quintiles were used for 1990–1992 and 2015–2017 to show changes in the share and distribution of counties in a specific mortality range for each sex and age group (i.e., to show both the share of counties where mortality rates were higher in 2015–2017 versus 1990–1992 and where the rates increased). Rates are age-adjusted by 10-year age group. Small population sizes and death counts resulted in extremely high mortality rates for some counties (e.g., 1 death in a population of 59 results in an age-adjusted mortality rate of 2,272 per 100,000 population). Accordingly, Winsorized binning was used to calculate the rate quintiles, so that counties with mortality rates in the top and bottom 1 percent were removed. On the maps, those counties in the bottom and top 1 percent of mortality are represented in the bottom and top quintiles, respectively. All counties with mortality rates of 0 are included in the bottom quintile. For ease of presentation, figures are limited to the contiguous United States; Alaska and Hawaii are excluded.
SOURCE: Data from https://www.cdc.gov/nchs/nvss/nvss-restricted-data.htm.
mortality within that state’s less-populated areas. The county-level mortality rates also identify areas of increasing mortality that cross state boundaries, such as the growing mortality disadvantage in the Appalachian region that includes areas of Ohio, Kentucky, West Virginia, and Pennsylvania.
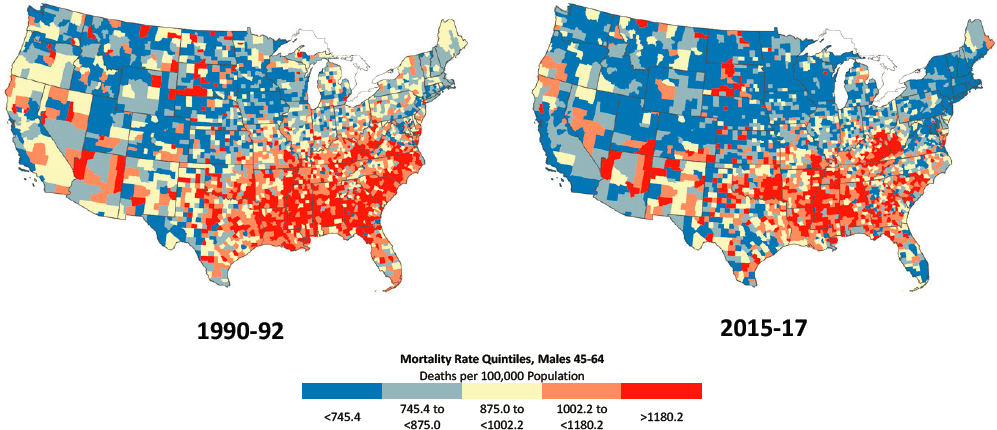
At the county level, among males ages 25–44 in 1990–1992, the highest mortality rates were concentrated in counties in the Southeast and parts of the desert Southwest and Mountain states (Figure 3-5a). Counties with low
NOTE: Counties with the largest decreases in mortality are dark blue, while those with the largest increases in mortality are dark red. Rates are age-adjusted by 10-year age group. Small population sizes and death counts resulted in extremely high mortality rates for some counties (e.g., 1 death in a population of 59 results in an age-adjusted mortality rate of 2,272 per 100,000 population). For ease of presentation, figures are limited to the contiguous United States; Alaska and Hawaii are excluded.
SOURCE: Data from National Vital Statistics System Detailed Mortality Files.
mortality rates were concentrated in New England, the Northeast, and the Midwest. By 2015–2017, a new pocket of counties with high mortality had emerged throughout Appalachia, including a band stretching from eastern Indiana to southern Ohio, Kentucky, and western New York and Pennsylvania. Counties in the Mountain West and the New England states of Maine, New Hampshire, Vermont, and Massachusetts also experienced large increases in mortality among younger working-age males (Figure 3-5b). The
counties that saw the largest declines in mortality among males in this age group were along the Pacific Coast and the Southeastern Atlantic seaboard.16
Among older working-age males, mortality was more likely to decrease over the period, leading to a greater diffusion of areas with mortality improvements. Although counties with decreasing mortality among younger males were concentrated in a small number of regional pockets within the United States, males ages 45–64 experienced decreases in mortality between 1990–1992 and 2015–2017 across a large number of counties in most regions of the country (Figures 3-6a and 3-6b).
Southern counties experienced the largest improvements in mortality, although they remained the most disadvantaged overall. Large increases in mortality occurred in a small pocket of counties in central Appalachia (comprising West Virginia, Eastern Kentucky, and Southern Ohio), while other counties with large increases were scattered throughout the central and Western United States. Although mortality rates increased among younger males in New England, the rates for males ages 45–64 declined throughout the region. Improvements in mortality were also apparent in California, in the Northern Midwest, and along the Southeastern seaboard.
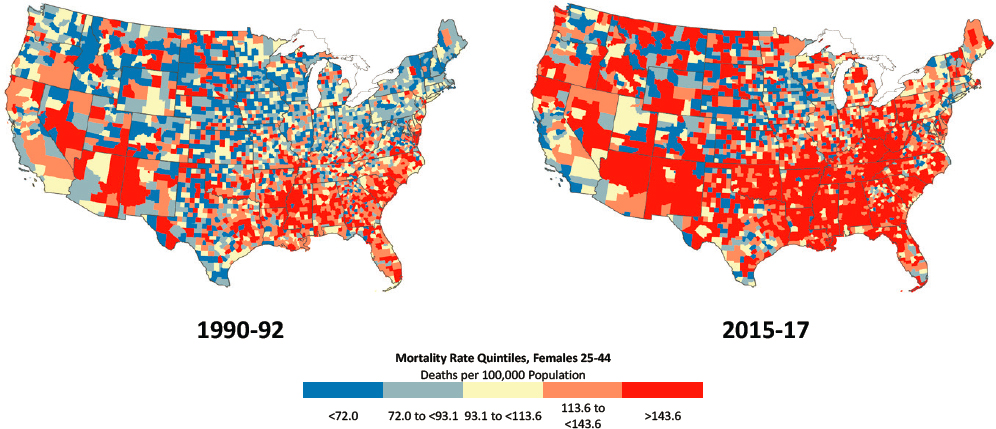
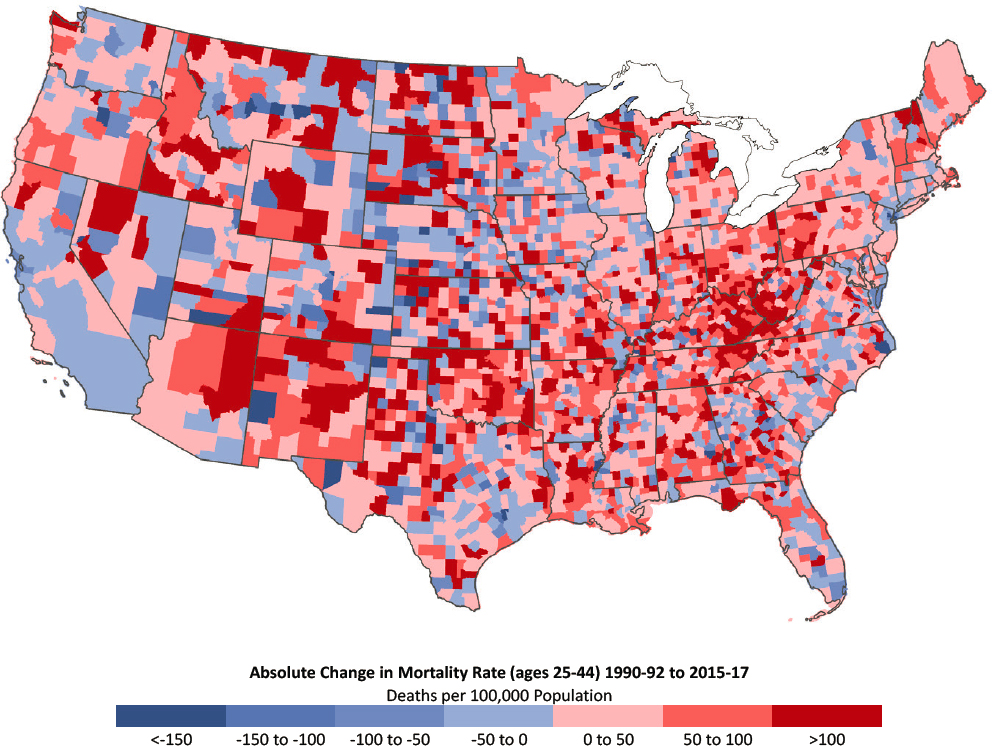
County patterns among younger females (ages 25–44) mirrored those of younger males (Figure 3-7a), but their mortality increases were far more pronounced and widespread across the United States (Figure 3-7b). County-level mortality rates show a startling increase in the share of U.S counties with high mortality among young females.17 As was true among younger males, the counties that experienced large increases in mortality among young females were located in the Appalachian region, extending down into Northeastern Tennessee, but also in New Mexico, most of Oklahoma, and to a lesser extent across Arkansas and Arizona. The counties that experienced improvements in mortality among young females were less consolidated by region but were often located along the coasts and parts of the central United States, particularly in large central metros.
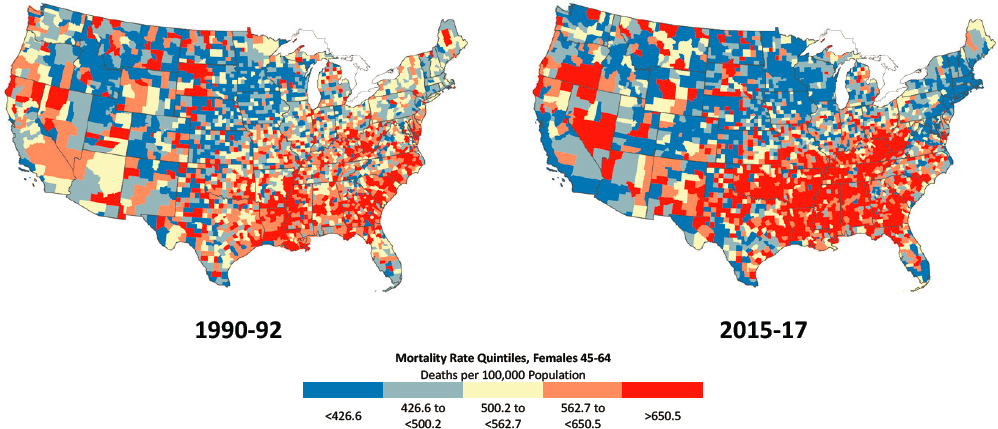
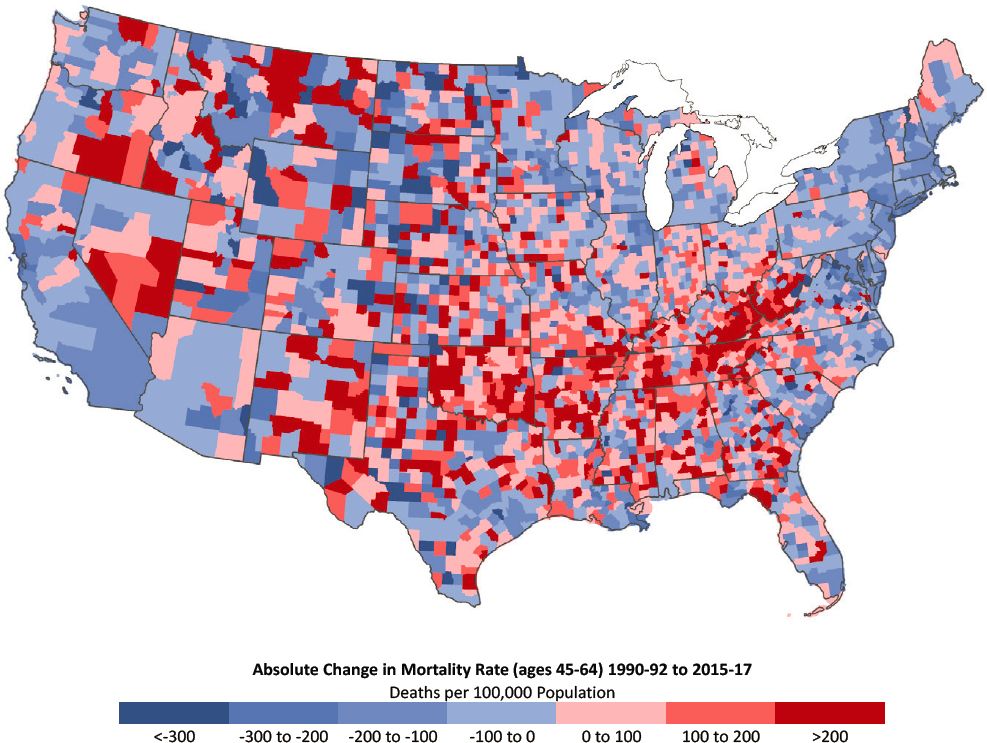
Among females ages 45–64, the counties that experienced large increases in mortality stretched across the Appalachian region and through Tennessee, Arkansas, and Oklahoma, just as occurred among younger females (Figures 3-8a and 3-8b). Compared with the trends among younger
___________________
16 County-level mortality estimates are not calculated separately by racial/ethnic group because the resulting small cell counts for many counties would produce unstable estimates for Black and Hispanic populations. Because county-level estimates are not adjusted for differences in racial composition, some differences in mortality among counties may be attributable to the racial/ethnic composition of those counties. For example, mortality declines in the Southeast were driven largely by massive declines in mortality rates among Black adults.
17 Based on the national trends reported earlier (increases in mortality among White females and declines among Black and Hispanic females), one can conclude that these rate increases were driven by mortality increases among White females.
NOTE: Mortality rates are shown for 1990–1992 (left) and 2015–2017 (right). Counties are classified into quintiles based on sex- and age-specific mortality rates in 1990–1992. Quintiles with the most favorable mortality rates are dark blue, while those with the least favorable mortality rates are dark red. Consistent quintiles were used for 1990–1992 and 2015–2017 to show changes in the share and distribution of counties in a specific mortality range for each sex and age group (i.e., to show both the share of counties where mortality rates were higher in 2015–2017 versus 1990–1992 and where the rates increased). Rates are age-adjusted by 10-year age group. Small population sizes and death counts resulted in extremely high mortality rates for some counties (e.g., 1 death in a population of 59 results in an age-adjusted mortality rate of 2,272 per 100,000 population). Accordingly, Winsorized binning was used to calculate the rate quintiles, so that counties with mortality rates in the top and bottom 1 percent were removed. On the maps, those counties in the bottom and top 1 percent of mortality are represented in the bottom and top quintiles, respectively. All counties with mortality rates of 0 are included in the bottom quintile. For ease of presentation, figures are limited to the contiguous United States; Alaska and Hawaii are excluded.
SOURCE: Data from https://www.cdc.gov/nchs/nvss/nvss-restricted-data.htm.
females, however, the mortality increases for females ages 45–64 were smaller and less geographically widespread. In contrast, areas with counties showing increasing mortality among older females were more pronounced and more widespread throughout the United States relative to counties with increasing mortality among males in this older age group. Despite the large increases in mortality within the Appalachian region, high mortality rates among older females became much more concentrated in the South over the period. This trend stood in contrast to the pattern among males in the same age group, for whom mortality rates in the South improved dramatically.
NOTE: Counties with the largest decreases in mortality are dark blue, while those with the largest increases in mortality are dark red. Rates are age-adjusted by 10-year age group. Small population sizes and death counts resulted in extremely high mortality rates for some counties (e.g., 1 death in a population of 59 results in an age-adjusted mortality rate of 2,272 per 100,000 population). For ease of presentation, figures are limited to the contiguous United States; Alaska and Hawaii are excluded.
SOURCE: Data from https://www.cdc.gov/nchs/nvss/nvss-restricted-data.htm.
A much smaller number of counties experienced substantial decreases in mortality among females ages 45–64. The counties in which mortality decreased substantially among older females were concentrated along the East and West Coasts and throughout the northern Great Lakes region and New England.
From these county-level maps, it is clear that many of the counties with the largest declines in mortality are home to the nation’s largest cities. To clarify whether the observed county-level patterns are related to metropolitan status, the committee examined how the percentage of counties with the highest and lowest mortality rates changed between 1990–1993 and
NOTE: Mortality rates are shown for 1990–1992 (left) and 2015–2017 (right). Counties are classified into quintiles based on sex- and age-specific mortality rates in 1990–1992. Quintiles with the most favorable mortality rates are dark blue, while those with the least favorable mortality rates are dark red. Consistent quintiles were used for 1990–1992 and 2015–2017 to show changes in the share and distribution of counties in a specific mortality range for each sex and age group (i.e., to show both the share of counties where mortality rates were higher in 2015–2017 versus 1990–1992 and where the rates increased). Rates are age-adjusted by 10-year age group. Small population sizes and death counts resulted in extremely high mortality rates for some counties (e.g., 1 death in a population of 59 results in an age-adjusted mortality rate of 2,272 per 100,000 population). Accordingly, Winsorized binning was used to calculate the rate quintiles, so that counties with mortality rates in the top and bottom 1 percent were removed. On the maps, those counties in the bottom and top 1 percent of mortality are represented in the bottom and top quintiles, respectively. All counties with mortality rates of 0 are included in the bottom quintile. For ease of presentation, figures are limited to the contiguous United States; Alaska and Hawaii are excluded.
SOURCE: Data from https://www.cdc.gov/nchs/nvss/nvss-restricted-data.htm.
2015–2017 across the four levels of metropolitan status: (1) large central metro, (2) large fringe metro, (3) medium/small metro, and (4) nonmetro (see Annex Figure 3-3 in the annex at the end of this chapter). These results confirm that mortality for both younger (ages 25–44) and older (ages 45–64) males and females improved dramatically in large central metros over this period. At the same time, the counties with the highest mortality rates became increasingly concentrated within nonmetros.
Large central metro counties are home to a greater share of the U.S. population relative to less-populated areas; therefore, changes in mortality rates within large central metros are likely to affect a larger share of the
NOTE: Counties with the largest decreases in mortality are dark blue, while those with the largest increases in mortality are dark red. Rates are age-adjusted by 10-year age group. Small population sizes and death counts resulted in extremely high mortality rates for some counties (e.g., 1 death in a population of 59 results in an age-adjusted mortality rate of 2,272 per 100,000 population). For ease of presentation, figures are limited to the contiguous United States; Alaska and Hawaii are excluded.
SOURCE: Data from https://www.cdc.gov/nchs/nvss/nvss-restricted-data.htm.
population compared with changes in small/medium metros or nonmetros. For this reason, the committee also examined the share of the population, by sex and age group, that was living in counties with the highest and lowest mortality rates (based on quintiles) in 1990–1992 and 2015–2017 (Annex Figure 3-4). As a result of the improvements in mortality within large central metros, the share of the population living in low-mortality counties increased over this period, while the share living in high-mortality counties declined. That is, more working-age adults were living in healthier
NOTE: Mortality rates are shown for 1990–1992 (left) and 2015–2017 (right). Counties are classified into quintiles based on sex- and age-specific mortality rates in 1990–1992. Quintiles with the most favorable mortality rates are dark blue, while those with the least favorable mortality rates are dark red. Consistent quintiles were used for 1990–1992 and 2015–2017 to show changes in the share and distribution of counties in a specific mortality range for each sex and age group (i.e., to show both the share of counties where mortality rates were higher in 2015–2017 versus 1990–1992 and where the rates increased). Rates are age-adjusted by 10-year age group. Small population sizes and death counts resulted in extremely high mortality rates for some counties (e.g., 1 death in a population of 59 results in an age-adjusted mortality rate of 2,272 per 100,000 population). Accordingly, Winsorized binning was used to calculate the rate quintiles, so that counties with mortality rates in the top and bottom 1 percent were removed. On the maps, those counties in the bottom and top 1 percent of mortality are represented in the bottom and top quintiles, respectively. All counties with mortality rates of 0 are included in the bottom quintile. For ease of presentation, figures are limited to the contiguous United States; Alaska and Hawaii are excluded.
SOURCE: Data from https://www.cdc.gov/nchs/nvss/nvss-restricted-data.htm.
counties in 2015–2017 than was the case in the early 1990s. This was especially true for males, reflecting the larger mortality reductions they experienced over the period. Only younger (ages 25–44) females deviated from this pattern; although they experienced a similar increase in the share of the population living within low-mortality counties among these adults, the share living in the counties with the highest mortality also increased, suggesting the emergence of a major geographic divergence (rising inequality) in mortality trends.
NOTE: Counties with the largest decreases in mortality are dark blue, while those with the largest increases in mortality are dark red. Rates are age-adjusted by 10-year age group. Small population sizes and death counts resulted in extremely high mortality rates for some counties (e.g., 1 death in a population of 59 results in an age-adjusted mortality rate of 2,272 per 100,000 population). For ease of presentation, figures are limited to the contiguous United States; Alaska and Hawaii are excluded.
SOURCE: Data from https://www.cdc.gov/nchs/nvss/nvss-restricted-data.htm.
Summary of Geographic Trends in Mortality
Geographic disparities in working-age mortality rates are large and grew substantially between 1990–1993 and 2015–2017. Mortality rates increased across several regions and states, particularly within the younger age group (25–44), and most glaringly in central Appalachia, New England, the central United States, and parts of the Southwest and Mountain West. The Northeast and West exhibited the most favorable trends, with comparatively large declines in mortality rates among both males and females. Although the South saw some mortality declines, its absolute rates were the
highest in the nation in both 1990–1992 and 2015–2017, and the reductions occurred in only some Southern states. Some of the largest declines in mortality occurred in DC, Maryland, Virginia, North Carolina, Georgia, Florida, and Texas. In contrast, West Virginia, Kentucky, Tennessee, Oklahoma, Arkansas, Alabama, and Mississippi had particularly unfavorable mortality trends. Apart from DC, the largest and most consistent improvements in mortality among working-age adults occurred in states with large populations that are anchored by large central metros, including New York, California, New Jersey, and Illinois.
Mortality trends were not uniform within regions or states, and within-state disparities were often as pronounced as those among states. High- and low-mortality counties were distributed unevenly across different levels of metro status, with greater reductions in mortality seen in large central metro counties and the least favorable trends seen in nonmetro (i.e., rural) counties. These differences were large enough to shift the overall distribution of mortality across metropolitan and nonmetropolitan areas. By 2015–2017, large central metro counties were most likely to have the lowest mortality rates (and least likely to have high mortality rates), while nonmetro counties were most likely to have the highest mortality rates in the United States.
A trend of increasing female mortality spread across the nation, affecting a growing share of U.S. counties. These increases were more widespread than those among males in both age groups, but particularly among those ages 25–44. This was the case by metro status, state, and county. Among adults ages 45–64, large declines in male mortality rates occurred across much of the country, whereas females in this same age group experienced increases in mortality across a large share of U.S. counties. In other words, mortality outcomes among males and females in middle age showed a pattern of increasing divergence, with males experiencing widespread decreases in mortality and more geographically isolated increases, while females, especially those in the younger age group, experienced widespread increases, with geographically concentrated areas of disadvantage, especially in Appalachia and the Southeast and in nonmetros.
SUMMARY
The findings in this chapter reveal that an alarming trend began in the 2010s: mortality rates stagnated or increased among working-age adults in the United States. Particularly concerning is the increase in mortality that occurred among both males and females in the latest period considered here (between 2012–2014 and 2015–2017). This increase marked a reversal from previous trends among working-age Black and Hispanic adults and White males, mortality rates having decreased throughout the 1990s and 2000s
except among males ages 25–34, among whom mortality decreased in the 1990s but stagnated in the 2000s. Among working-age White females, by contrast, this increase followed a long period during the 1990s and 2000s in which mortality rates remained largely unchanged. Only females ages 55–64 experienced decreasing mortality during this period.
These racial/ethnic differences in mortality trends during the period had a significant impact on racial/ethnic disparities in mortality among working-age adults. Black adults had the highest mortality throughout the 1990–2017 period and experienced the largest decreases in mortality, narrowing the White–Black mortality gap over time. Since 2010, however, the increases in mortality among the Black population have arrested this progress. In contrast, working-age Hispanics and AI/ANs generally had lower mortality relative to working-age White adults in 1990; therefore, the large decreases in mortality they experienced during the 1990s and 2000s led to a growing mortality disadvantage for working-age White adults. The committee was unable to examine trends in mortality among working-age AI/ANs; however, data from tribal areas in 1999–2009 demonstrate that AI/ANs living in or near these areas experienced higher mortality than any other racial/ethnic group. Although similar data were not available for the period since 2010, recent research using NVSS death record data suggests that AI/ANs also experienced increasing mortality between 2010 and 2017 (Woolf et al., 2018); however, the authors of this study did not account for race reporting errors, which means these trends should be interpreted with caution.
The findings in this chapter point to a growing mortality disadvantage among less-educated working-age Whites and among working-age Whites, Blacks, and Hispanics living outside of large central metros, particularly those living in nonmetros. By some of these estimates, the gap in life expectancy between White Americans with the highest and lowest levels of education or income in the most recent period grew to as large as 10–12 years. Although less-educated working-age Blacks also experienced higher mortality relative to working-age Blacks with more education, this disadvantage remained largely stable between 1990 and 2017, and little is known about these disparities within other racial/ethnic populations.
In contrast, the growing mortality advantage in large central metros held across working-age Whites, Blacks, and Hispanics, although Whites experienced the largest and most consistent expansion of mortality disparities by metropolitan status over the period. Although working-age mortality was generally higher in large central metros than in less-populated areas in 1990–1993, these areas experienced the largest declines and as a result, had the lowest mortality by 2015–2017. The states that experienced the largest decreases in mortality between 1990–1993 and 2015–2017 were
Southern states with large Black populations and those that were anchored by large central metros that experienced dramatic improvements in mortality over time. Mortality rates increased across several regions and states, particularly within the younger working-age group and most glaringly in central Appalachia, New England, the central United States, and parts of the Southwest and Mountain West. These increases occurred more broadly throughout the country among working-age females, while increases among males were more geographically concentrated. By 2015–2017, the U.S. counties with the highest mortality rates were increasingly concentrated in nonmetros.
It is important to note that these findings are descriptive in nature and cannot establish causal relationships. Based on these analyses, one cannot rule out the possibility that at least some of these trends reflect not changes in mortality per se but other forces that affect the composition of the population, such as immigration and internal migration. The annex to this chapter notes that the changing ethnic composition of the U.S. Asian population could affect trends in mortality within this population over time. Similarly, Black immigrants to the United States from the Caribbean and sub-Saharan Africa have, on average, more education and higher SES relative to the native Black population. Large increases in immigration from these locations have increased the average SES level within the U.S. Black population, leading to more favorable improvements in outcomes for the Black population as a whole than would have occurred if this selective migration had not taken place (Hamilton and Massey, 2019). This means that immigration patterns explain at least some portion of the mortality decreases within the working-age Black population, although the size of their contribution to these changes has not yet been established. A similar phenomenon likely contributes to the growing mortality advantage in large central metros. For example, Preston and Elo (2014) found that most of the relative improvements in mortality that occurred between 2000 and 2010 in New York City relative to the rest of the United states could be explained by the high proportion of immigrants residing in the city compared with the rest of the nation. Thus, although the relative improvements in mortality within large central metros and among non-White working-age adults—particularly the large decreases in mortality among Black adults—are promising, they should be interpreted with caution.
Chapter 4 examines cause-specific mortality to determine the key causes of death that drive these trends in all-cause mortality. The underlying explanations for these key drivers are explored in Part II of this report.
ANNEX 3-1
Mortality Trends Among U.S. Asians/Pacific Islanders and American Indians/Alaska Natives
MORTALITY TRENDS AMONG U.S. ASIANS AND PACIFIC ISLANDERS
The U.S. Asian and Pacific Islander (API) population has experienced rapid growth since the 1965 Immigration and Nationality Act. The Pew Research Center estimated, for example, that between 2000 and 2015, the Asian American population grew by 72 percent, faster than any other racial/ethnic group (Lopez, Ruiz, and Patten, 2017). While there have long been sizable populations of Native Hawaiians, Samoans, and other Pacific Islanders dating back to the U.S. occupation of Hawaii and other Pacific Islands in the late 1800s and concentrated populations of Chinese, Japanese, and Filipino Americans in California and a few other Western states dating back to the 1800s, the past half-century has witnessed greater immigration from an array of Asian countries, leading to both the rapid growth and the diversification of the API population. As of mid-2018, the U.S. Census Bureau estimated that more than 20 million single-race APIs resided in the United States, accounting for more than 6 percent of the total U.S. population (U.S. Census Bureau, 2019). In addition, another 3 million multiracial individuals claim at least one Asian American or Pacific Islander racial category (U.S. Census Bureau, 2019).
Despite the growing size of the API population, valid estimates of age-specific mortality rates and life expectancy for this population have been challenging because of misclassification of race on some death certificates. The construction of U.S. mortality rates is based on race counts from death certificates as the numerator and on population counts by race from U.S. Census data as estimates of the denominator. In the API population, differential recording of race in these two data sources has resulted in underestimates of actual mortality rates. However, in a thorough recent investigation of this problem, Arias, Heron, and Hakes (2016) found that API death rates in the United States grew more accurate between the 1980s–1990s and the 2000s–2010s. Their estimates suggest that recent calculations of API age-specific mortality rates are only 3 percent too low, on average, with greater accuracy documented in states with larger API populations (e.g., California) relative to states with lower percentages of APIs. These authors, who provide corrected age-specific mortality rates for the API population (including the 25–64 age range that is the focus of this report), report that API mortality rates were 50–60 percent lower than those of non-Hispanic
Whites in 2009–2011. This estimate is consistent with scattered published age-specific mortality and life expectancy estimates for the API population, according to which API life expectancy is the highest among all U.S. racial/ethnic groups, exceeding that of non-Hispanic Whites life expectancy by 6–8 years for both women and men (Acciai, Noah, and Firebaugh, 2015; Singh and Hiatt, 2006).
Despite the overall favorable patterns and trends in working-age mortality among APIs, aggregate data for the entire API population mask considerable heterogeneity within this population. First, most of the API population is foreign-born; as of 2015, 73 percent of the Asian American adult population was foreign-born (Lopez, Ruiz, and Patten, 2017). Foreign-born populations from nearly all countries of origin, including those in Asia, have been shown to have lower mortality and higher life expectancy by about 3 years relative to their U.S.-born coethnics for a variety of reasons, but perhaps most important, because of the healthy selection of new immigrants (Dupre, Gu, and Vaupel, 2012; Mehta et al., 2016; Singh and Hiatt, 2006). However, some Asian immigrants came to the United States as refugees or as undocumented persons and are not necessarily selected in terms of favorable health. Thus, estimates of API mortality that do not specify nativity not only mask the higher overall mortality of U.S.-born APIs relative to their foreign-born counterparts but also conflate immigrant groups that arrived under very different conditions.
Second, the API population includes a diverse mix of people who trace their origins to the Pacific Islands, East Asia, Southeast Asia, and the Indian Subcontinent. Among all the different groups included under the API umbrella, the largest subgroups are Chinese, Indian, Filipino, Vietnamese, Korean, and Japanese American, in that order (Lopez, Ruiz, and Patten, 2017). However, the API category also includes dozens of other subgroups, each with its own distinct culture of origin and experience (Iceland, 2017), including those with family origins in U.S. states and territories (e.g., Hawaiians, Samoans, Chamorros) and others from a diverse array of nations and cultures (e.g., Pakistanis, Nepalese, Hmong, Indonesians). Moreover, while some API groups are nearly all or predominantly U.S.-born (e.g., Hawaiians, Japanese Americans), others are 80–95 percent foreign-born (e.g., Burmese, Bhutanese, Nepalese) (Lopez, Ruiz, and Patten, 2017). Accordingly, mortality patterns and trends documented for the overall API population tend to reflect the experiences of the largest subgroups and not necessarily the diverse histories and experiences of dozens of smaller subgroups.
Finally, the API population in the United States is geographically concentrated. Some states (e.g., Montana, Maine) have very small API populations, whereas California is home to more than 30 percent of the nation’s API population (Lopez, Ruiz, and Patten, 2017). Other large API
populations live in New York, Texas, New Jersey, Illinois, Washington, Florida, Virginia, Hawaii, and Massachusetts. Thus, the mortality patterns of the API population tend to reflect the health profiles of those states more so than the profiles of states in which this population is poorly represented.
MORTALITY TRENDS AMONG AMERICAN INDIANS/ALASKA NATIVES
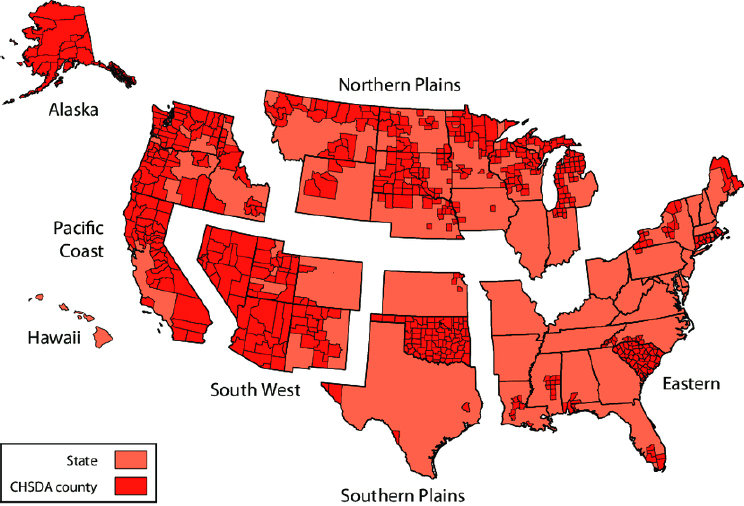
As with APIs, the construction of life tables and other mortality estimates for the American Indian/Alaska Native (AI/AN) population is hindered by the misclassification of AI/AN identity on U.S. death certificates (Anderson, Copeland, and Hayes, 2014). A linkage of Current Population Survey records to the death certificates of the same individuals, for example, revealed that for about 30 percent of self-identified AI/AN individuals, another race was recorded on the death certificate (Arias, Xu, and Jim, 2014). In addition, sample sizes for the AI/AN population in surveys, such as the National Health Interview Survey, that are linked to the National Death Index are too small for the estimation of AI/AN age-specific mortality and life expectancy. Attempts to minimize misclassification biases have restricted mortality estimates to the records of the Indian Health Service registration system that permit the identification of all AI/AN deaths, including those that have been misclassified. Life tables have also been estimated for populations residing in 637 Contract Health Service Delivery Area (CHSDA) counties that contain or are adjacent to tribal lands (Arias, Xu, and Jim, 2014; Espey et al., 2014). The map of CHSDA counties in Annex Figure 3-1 shows their locations in the United States, with the greatest concentrations seen in Alaska, the Southwest, the Pacific Coast, and the Northern Plains. These counties represented 20 percent of all U.S. counties and accounted for 64 percent of the non-Hispanic AI/AN population (Anderson, Copeland, and Hayes, 2014).
The available evidence reveals that mortality among the AI/AN population is much higher than that among non-Hispanic Whites, non-Hispanic Blacks, and Hispanics. In 2007–2009, AI/AN male life expectancy in the CHSDA counties was 7.9 years lower than the national estimate for non-Hispanic White males, 2.2 years lower than for non-Hispanic Black males, and 10.4 years lower than for Hispanic males. The respective figures for females were 6.4 years, 2.6 years, and 9.0 years (Annex Figure 3-2).
It is important to note that the data presented here cover only AI/ANs living on or near tribal lands or in counties adjacent to those lands. Much less is known about the 36 percent of the AI/AN population that is not covered by these data.
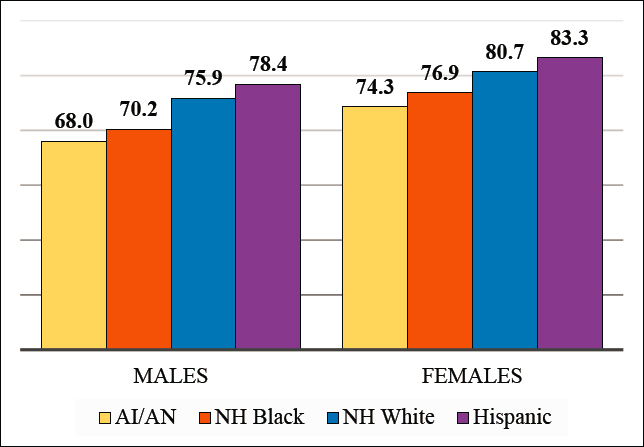
NOTE: American Indian/Alaska Native life expectancy in Contract Health Service Delivery Area (CHSDA) counties in 2007–2009. National non-Hispanic Black, non-Hispanic White, and Hispanic life expectancy in 2008. Rates are age-adjusted.
SOURCE: Data from Arias (2012); Arias, Xu, and Jim (2014).
CHANGES IN HIGH/LOW MORTALITY COUNTIES BY METROPOLITAN STATUS
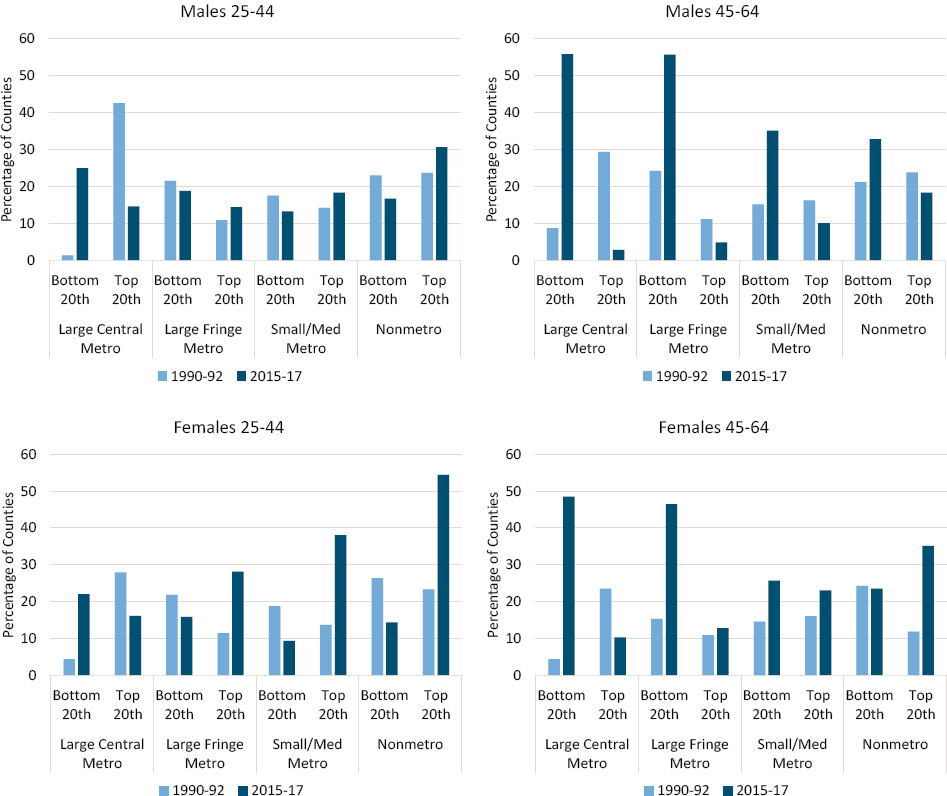
NOTE: The share of counties in the top and bottom mortality quintiles is shown for 1990–1992 (light blue bars) and 2015–2017 (dark blue bars) by metropolitan area type (large central metro, large fringe metro, small/medium metro, and nonmetro). The data are shown separately for males ages 25–44 (upper left panel), males ages 45–64 (upper right panel), females ages 25–44 (lower left panel), and females ages 45–64 (lower right panel). Counties are classified into quintiles based on sex- and age-specific mortality rates in 1990–1992. Consistent quintiles were used for 1990–1992 and 2015–2017 to show changes in the share and distribution of counties in a specific mortality range for each sex and age group. Rates are age-adjusted by 10-year age group. Small population sizes and death counts resulted in extremely high mortality rates for some counties (e.g., 1 death in a population of 59 results in an age-adjusted mortality rate of 2,272 per 100,000 population). Accordingly, Winsorized binning was used to calculate the rate quintiles, so that counties with mortality rates in the top and bottom 1 percent were removed. Counties in the bottom and top 1 percent of mortality are represented in the bottom and top quintiles, respectively. All counties with mortality rates of 0 are included in the bottom quintile.
SOURCE: Calculations by the committee based on restricted death certificate files from the National Vital Statistics System.
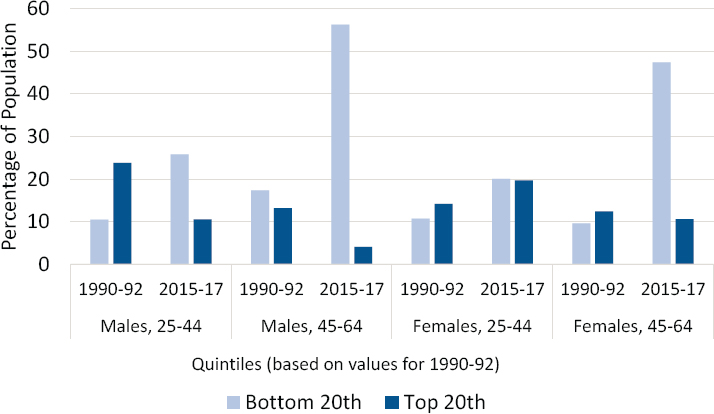
NOTE: The light blue bars show the percentage of the population living in counties that fall in the bottom (most favorable) quintile, while the dark blue bars show the percentage living in counties that fall in the top (least favorable) quintile. Counties are classified into quintiles based on sex- and age-specific mortality rates in 1990–1992. Consistent quintiles were used for 1990–1992 and 2015–2017 to show changes in the share and distribution of counties in a specific mortality range for each sex and age group. Rates are age-adjusted by 10-year age group. Small population sizes and death counts resulted in extremely high mortality rates for some counties (e.g., 1 death in a population of 59 results in an age-adjusted mortality rate of 2,272 per 100,000 population). Accordingly, Winsorized binning was used to calculate the rate quintiles, so that counties with mortality rates in the top and bottom 1 percent were removed. Counties in the bottom and top 1 percent of mortality are represented in the bottom and top quintiles, respectively. All counties with mortality rates of 0 are included in the bottom quintile.
SOURCE: Calculations by the committee based on restricted death certificate files from the National Vital Statistics System.


