
7
Measuring the Commercialization of Digital Products from Federal Laboratories
Assessing the commercialization of federal laboratories’ digital products requires a broad range of data, including measures of inputs into lab inventions (e.g., basic research and knowledge creation, research and development [R&D] effort, and data); data on lab discoveries and inventions; and metrics on the subsequent economic and social impacts of new products, processes, and services.
Currently available data permit only a limited understanding of the commercialization of digital products from federal labs. Data on commercialized products, processes, and services produced from knowledge or inventions created in federal labs—including digital products—are extremely limited, and no existing metrics capture the longer-term economic impact of these outputs. Researchers are generally limited to measuring inputs into invention (e.g., R&D spending, knowledge transfer via publications), some evidence of inventions (invention disclosures, patent applications filed, patents issued), and limited metrics for two pathways by which knowledge and technology are transferred out of the labs (licenses and cooperative agreements). Moreover, data on different dimensions of technology transfer (e.g., patents or licenses) are reported only at the agency level, not at the lab level. There also are inherent difficulties in measuring innovation stemming from digital products, which is likely to be intangible. For example, there are only limited quantitative measures for the large amounts of software and data released by federal labs and the individual research groups and scientists within them. Creating additional challenges is that digital products, particularly software, are often bundled with nondigital products.
This chapter reviews the best available measures for these data, and presents the committee’s proposal for additional methods and measures for assessing the commercialization of digital products from federal labs.
OVERVIEW AND ASSESSMENT OF AVAILABLE DATA
Federal agencies generally rely on such metrics as licensing income and numbers of patent applications and issued patents to measure the benefit of their technology transfer programs, despite the known limitations of these metrics (Choudhry and Ponzio, 2020). Over the past two decades, the principal federal report on technology transfer at the federal laboratories has been compiled annually by the National Institute of Standards and Technology (NIST). Over time, the breadth of data included in this report has expanded, but the report still does not capture the range of data needed.
Under the Technology Transfer Commercialization Act of 2000 (Pub. L. No. 106-404), federal agencies are required to report technology transfer activities at their labs, and the secretary of commerce includes this information in an annual report on technology transfer to Congress (Pub. L. No. 106-404). Specifically, agencies are required under this statute to report annually information on patents, licenses, royalty income, cooperative research agreements, and anything else relevant to their technology transfer efforts (Pub. L. No. 106-404, §§ 3710[f]–[g]).1
A 2011 presidential memorandum titled “Accelerating Technology Transfer and Commercialization of Federal Research in Support of High-Growth Businesses” directed the secretary of commerce to work with other entities, including the Interagency Working Group on Technology Transfer (IAWGTT) and the National Science Foundation’s (NSF’s) National Center for Science and Engineering Statistics (NCSES), to “improve and expand” metrics in the annual federal technology transfer summary report (Executive Office of the President, 2011). In response, the IAWGTT developed a number of new, mandatory metrics, including number of startups created; number of patents granted, by technology area and agency; science and engineering (S&E) publications, by technology area and agency; citations of S&E articles in U.S. patents, by technology area, article author sector, and agency; and number of technology transfer impact studies completed. In addition, the IAWGTT recommended that federal agencies include measures of the number of software programs created and downloaded (IAWGTT, 2012). The range of data included in the annual technology transfer report has expanded and now includes some of the IAWGTT’s required measures. The latest report, covering fiscal year (FY) 2016 and published in September 2019, includes the number of patents issued, by selected technology area; the number of invention disclosures, by agency; the number of published S&E articles authored or coauthored by federal lab employees; and the number of these articles cited in patents, which provides a measure of the commercial relevance of a publication (NIST, 2019a).
___________________
1 Academic studies also provide occasional insight into technology transfer at federal labs. See, e.g., Adams et al., 2002; Feldman and Lemley, 2018.
Sample of Data in the Fiscal Year 2016 Technology Transfer Report for Federal Laboratories
This section provides a look at some of the key statistics in the FY 2016 technology transfer report to set the stage for an assessment of the strengths and weaknesses of the data currently provided.
Table 7-1 presents some of the key statistics in the NIST technology transfer report for the four agencies with the largest federal laboratory budgets. These statistics are not confined to digital products, and they represent a mix of government-owned, government-operated (GOGO) and government-owned, contractor-operated (GOCO) labs. (Most Department of Health and Human Services [HHS] and Department of Defense [DOD] labs are GOGOs, most Department of Energy [DOE] labs are GOCOs, and the National Aeronautics and Space Administration [NASA] labs are evenly split between GOGOs and GOCOs.) These statistics include a breakdown of new invention disclosures, patent applications filed, and patents issued, by technology area and both by individual agency and in the aggregate. The technology transfer report notes the percentage of patents issued to federal agencies, by technology area, based on a fractional count of patents.2 In FY 2016, about 10 percent of federal patents were in the field of measurement, while nearly one-fourth were in biomedical fields.
Data in the report also show that cooperative research and development agreements (CRADAs) and other collaborative arrangements for engagement between the labs and outside organizations were increasing, while in FY 2016, most other technology transfer mechanisms remained at the same level, increasing or decreasing only slightly, with the total number of active CRADAs for all agencies numbering more than 11,600 (NIST, 2019a). HHS labs accounted for the bulk of federal lab licensing income—73 percent of the total—and HHS, DOE, and DOD collectively accounted for nearly all of the royalty income from licenses for the federal government (NIST, 2019a). It should be noted that, although CRADAs are obviously an important mechanism for technology transfer, the statistics on invention disclosures, patents, and licenses do not reflect data for the patenting and licensing activities of the CRADAs themselves, reflecting a significant gap in reporting.
Although these data are useful, in many ways they raise more questions than they answer, as discussed below.
Assessment of Current Metrics on Technology Transfer
Although federal laboratories are typically engaged in the creation of knowledge and the generation of inventions, much of that work is not reflected in the annual technology transfer report, which focuses on patents, licenses, and
___________________
2 NIST credits patents on a fractional-count basis, so that each federal agency receives a fraction of the credit when there are assignees from multiple agencies.
TABLE 7-1 Federal Laboratory Technology Transfer Metrics in the National Institute of Standards and Technology’s Annual Report for the Four Largest Agencies (in terms of federal lab budgets), Fiscal Year 2016
| Agency | GOGO and GOCO R&D Budget (millions of dollars) | GOCO Share of GOGO/GOCO R&D Budget (percent) | Number of New Invention Disclosures | Number of Patent Applications Filed | Number of Patents Issued | Number of Active Licenses | Total License Income (thousands of dollars) | Number of Active CRADAs |
|---|---|---|---|---|---|---|---|---|
| DOD | 18,567 | 9 | 874 | 941 | 665 | 515 | 6,205 | 3,125 |
| DOE | 8,152 | 88 | 1,760 | 999 | 856 | 5,410 | 31,149 | 739 |
| HHS | 7,642 | 7 | 320 | 269 | 579 | 1,750 | 132,833 | 590 |
| NASA | 3,314 | 46 | 1,554 | 129 | 103 | 452 | 3,149 | 12 |
NOTE: CRADA = cooperative research and development agreement; DOD = Department of Defense; DOE = Department of Energy; GOCO = government-owned, contractor-operated; GOGO = government-owned, government-operated; HHS = Department of Health and Human Services; NASA = National Aeronautics and Space Administration; R&D = research and development.
SOURCE: National Institute of Standards and Technology (NIST, 2019a).
CRADAs. These metrics are heavily weighted toward formal activities and in most cases reflect only those cases in which a transfer of money occurs. No data are collected on software or data compilations that are made freely available through open-source portals. The only information collected on intellectual property created by labs relates to patents, and no information is collected on copyright, even for GOCO labs that are able to claim copyright in software and other works of authorship. Nor are any systematic data collected on innovations (i.e., commercialized products, processes, and services) that build less formally on the knowledge and inventions that flow from federal labs. And there are no data on the number of startups created or their economic impact.3 Of course, the aggregate data reported also do not allow one to identify technology transfer or even publications and citations relating specifically to digital products at the agency or federal lab level.
The measures currently available, although collected from the labs, are reported only at the agency level. Disaggregated data would help policy makers understand how different policies and practices across the federal labs affect the ability and propensity of each lab to ensure that knowledge and inventions are made available. Although inherent differences across agencies make cross-lab comparisons difficult, disaggregated data could also provide information about individual labs over time. In some instances, however, disaggregating data may still leave gaps in understanding. This is the case, for example, with patents given the changing patent landscape and the limited extent to which software is even patented.
Patent Activity
The annual technology transfer report collects information about invention disclosures and patents, but patents may not be a reliable measure of innovation in digital products, specifically software. As described in Chapter 4 and noted above, many software inventions are not patented. Given the complexities of patent claim drafting, it is also difficult to identify software patents that do exist (Rai et al., 2009). In addition, the technological and economic importance of patents varies substantially, and indeed, most patents are never commercialized (Sichelman, 2010).
The committee analyzed the patents for the laboratories of three agencies—DOE, DOD, and NASA—for the period 1980–20144 using the patent classes identified as software by previous researchers (Graham and Vishnubhakat, 2013). The committee’s analysis illustrates a number of points that highlight the
___________________
3 The FY 2016 technology transfer report also indicates that while most agencies have a long history of working with startups, few agencies have established “systematic methods to identify and track the startup companies they nurture” (NIST, 2019a).
4 The committee also examined software patents for HHS, which includes the National Institutes of Health (NIH), Centers for Disease Control and Prevention (CDC), and Food and Drug Administration (FDA). Although the labs of these agencies have a large number of patents, attributable mostly to NIH, they have too few software patents to merit reporting here.
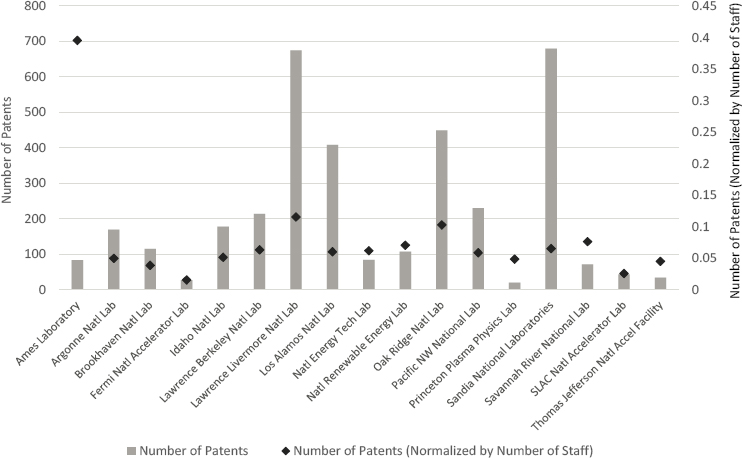
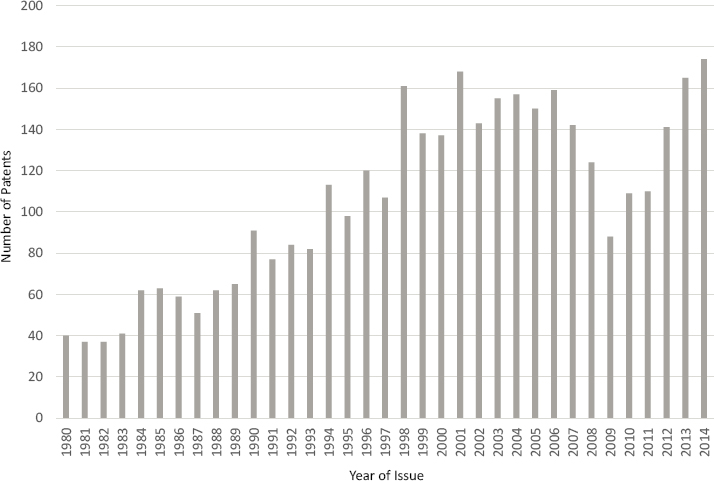
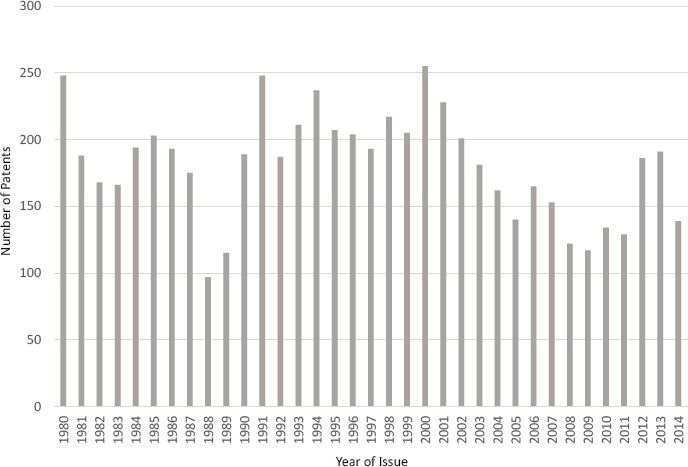
importance of disaggregating data. First, software patenting, especially by DOE and DOD, is significant. In total, these three agencies were issued almost 400 software patents in 2014, compared with close to 700 software patents for all American universities. Second, as shown in Figures 7-1 and 7-2, there are enormous differences in patenting behavior across labs within an agency, even after normalizing for the number of employees. Third, the committee’s analysis revealed that software patent activity has varied considerably over time, being most intensive between the mid-1990s and early 2000s for DOE and DOD labs, corresponding roughly to the final 10 years or so of what is referred to as the “patent surge” in the United States (see Figures 7-3 and 7-4). Disaggregating data also makes it possible to explore variations among different types of labs. DOE labs, for instance, are a mix of fundamental research labs, labs that primarily operate user facilities, applied engineering labs, and nuclear weapons labs.
Comparing forward citations to software patents across the three agencies’ labs since 2000, the average, normalized numbers of citations to patents
NOTE: DOE patents were identified by searching Google Patents for the Department of Energy, the names of labs, and the names of contractor operators of labs. When the lab was not identified, it was assigned based on the inventor’s location.
SOURCE: Committee calculations based on data from the Office of Scientific and Technical Information (OSTI) (https://www.osti.gov/) and the European Patent Office’s World Patent Statistical Database (PatStat) (https://data.epo.org/expert-services/index.html).
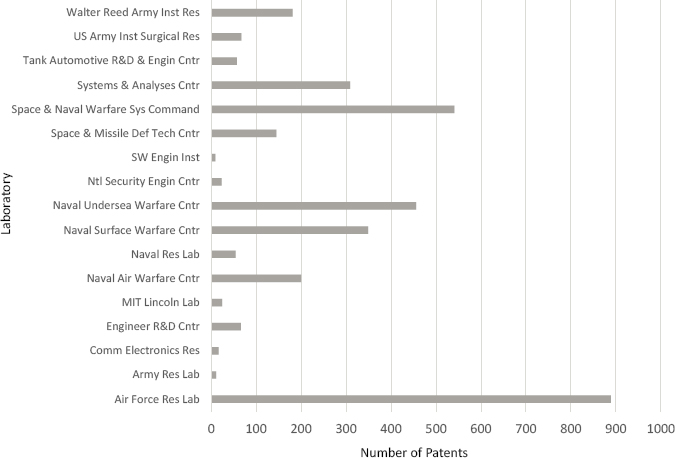
NOTE: DOD patents were identified by searching for Department of Defense, Air Force, Army, and Navy in the assignee fields in the Google Patents search panel and matched to individual labs based on the inventor’s location. Only about half of the 6,400 DOD patents could be matched to a lab.
SOURCE: Committee calculations based on data from Google Patents (https://patents.google.com/).
for the labs of, respectively, DOE, DOD, and NASA are 1.55, 0.95, and 1.36. Forward citations are the number of patents in the future that cite the invention, and are considered a good measure of a patent’s usefulness or value (Trajtenberg, 1990). Although it is not possible to claim that the patents of DOE labs are more commercially valuable or significant than, say, those of DOD labs, such a substantial difference raises questions about the private-sector value or commercial viability of software patents or the effectiveness of technology transfer operations of one agency compared with another.
Licenses
The NIST report devotes a great deal of attention to licenses. Unfortunately, these aggregate, agency-level data are not disaggregated according to the character of the underlying invention, making it impossible to determine how many of these licenses relate to digital products, nor are the data reported for individual laboratories. As noted earlier, the data in Table 7-1 show that HHS labs
SOURCE: Committee calculations based on data from the Office of Scientific and Technical Information (OSTI) (https://www.osti.gov/) and the European Patent Office’s World Patent Statistical Database (PatStat) (https://data.epo.org/expert-services/index.html).
accounted for the bulk (73 percent) of federal lab licensing income in FY 2016, which raises questions about how this total is distributed among the HHS labs, the mix of technologies being licensed, and whether there are differences between GOGOs and GOCOs.
In April 2020, NIST’s Technology Partnership Office, working with the IAWGTT, released a list of “optional” metrics for agencies to report. Particularly relevant to digital products, the list includes software licenses executed, software products available for licensing, and copyright licenses executed. Because these additional metrics are optional, however, they are less likely to be implemented widely relative to the required metrics, and their impact on understanding of the commercialization of digital products is therefore uncertain at best.
Participation in Cooperative Research and Development Agreements
Data on CRADAs are currently included in the NIST report on an agency-wide basis. Cooperative arrangements generally, and CRADAs in
SOURCE: Committee calculations based on data from Google Patents (https://patents.google.com/).
particular, are widely recognized as important mechanisms for technology transfer from the federal laboratories to industry and other organizations (Adams et al., 2003; Arora et al., 2016). CRADAs are associated with higher levels of company patenting compared with other technology transfer mechanisms, most likely as a result of the more intensive collaboration between labs and companies under these agreements (Adams et al., 2003). Because information on CRADAs is not disaggregated by type of technology, however, it is impossible to know their importance for digital technologies. And again, the failure to disaggregate the data by lab is an important shortcoming.
In addition, a more comprehensive accounting of innovation and commercialization outcomes arising from CRADAs and other cooperative arrangements between federal labs and the private sector is needed to assess the effectiveness of these arrangements. This accounting needs to encompass the full range of outcomes, including both failures and successes, so the determinants of performance can be assessed. Also important are data on cooperative ventures by startups and on woman- and minority-owned businesses to ensure that access to the labs’ resources has been equitable and fair.
Publications, Conferences, and Informal Information Exchange
As described in Chapter 6, the contributions of federal laboratories to private-sector innovations extend beyond patents, licenses, and cooperative research arrangements. Previous studies of industrial innovation have shown that knowledge transfer via published papers and reports, public conferences and meetings, informal information exchange, and consulting is the key means by which government and university research affects industrial innovation (Cohen et al., 2002). Although NIST’s annual technology transfer report does include S&E publications, these data are reported at the government-wide level, thus not allowing analysis by lab, let alone any insight into the substance of the publications and whether they relate to digital products. NIST acknowledges that “a uniform tracking system for S&E articles across all federal agencies does not exist” (NIST, 2019a, p. 14), nor does there exist a tracking system for more informal knowledge transfers. Understanding the role of the federal labs’ contributions to the nation’s knowledge capital, particularly via publications, is especially important in light of the secular decline of public firms’ participation in publishable science over the past 30 years in the United States (Arora et al., 2016).
The production of publications has increased substantially at many labs. DOE labs in particular have seen a significant increase in the last 25 years, perhaps resulting from an infusion of resources or shifts in scientific domains within these labs (Sugimoto, 2020). Several federal agencies have created portals to make publications from their lab researchers and grantees more accessible, likely increasing the importance of this pathway for technology transfer from the labs, and hence the need to better understand the impact of publications. Venues for these publications include the National Library of Medicine’s PubMed Central5 and DOE’s Public Access Gateway for Energy and Science (DOE PAGES).6 More than 65,000 publicly available full-text journal articles and manuscripts are available through DOE PAGES, and this number is expected to grow by about 20,000–30,000 articles and manuscripts per year. DOE PAGES also offers a reference/citation tool that enables users to track the impact of an article through citations in other publications, including articles in conference proceedings and journal articles as well as patents.
Datasets and Software Code
Other important contributors to private-sector innovation include datasets and software code. Although datasets may provide the basis for laboratory inventions, they are also transferred out of the labs through data downloads, which are not reported. In addition, software code produced in a lab may contribute to further inventions in the lab or may be downloaded for use
___________________
5 Access at https://support.nlm.nih.gov/knowledgebase/article/KA-03247/en-us.
6 Access at https://www.osti.gov/pages/.
outside the lab, and as with datasets, these downloads are not reported or made publicly available. Better understanding of the existence, use, and impact of datasets and software code is critical to understanding the commercialization of the digital products of the labs.
Although statistics on knowledge transfers, data downloads, and software downloads are not reported in the annual technology transfer reports, the committee was able to compile some limited information on publications, datasets, and software based on data from Web of Science, data.gov, and code.gov. These data are presented in Table 7-2, which shows that a very large volume of transfer from labs occurs through such products as these rather than through traditional patenting and licensing channels. As with other fragmentary available data, these are more suggestive than conclusive, since they are not disaggregated by lab.
The dissemination of data collected through experiments and other functions of the federal labs is another critical component of knowledge sharing within the innovation process; however, information on data downloads is not included in the technology transfer report.7 Despite that omission, some agencies collect information on data use, which would be useful if systematically reported. For example, NASA gathers earth observation data and makes these data usable by the public, academia, and industry. NASA tracks daily visits to its open data portal and its application programming interface (API) portal, which help application developers use these data; API.nasa.gov had 9 million hits in May 2019 alone. In addition to its open data portal, NASA operates an Earth Observing System Data Information System (EOSDIS) and Planetary Data System. In 2018, EOSDIS held approximately 37 petabytes of data and delivered more than 1.6 billion data products to more than 4.1 million users around the world. NASA
TABLE 7-2 Innovation Inputs from Federal Researchers and Laboratories
| Agency | Inputs to Innovation | |||
|---|---|---|---|---|
| Datasets | Software Code | Cumulative Publications | Publications, 2019 | |
| DOD | 378 | 17 | 246,703 | 6,194 |
| DOE | 2,868 | 1,948 | 552,452 | 19,052 |
| HHS | 2,041 | 179 | 427,339* | 13,289* |
| NASA | 32,089 | 1,257 | 167,315 | 5,558 |
NOTES: Data are reported for the agencies whose labs have the largest research and development budgets. DOD = Department of Defense; DOE = Department of Energy; HHS = Department of Health and Human Services; NASA = National Aeronautics and Space Administration. * Indicates data for the National Institutes of Health alone.
SOURCE: Datasets at data.gov; source code from code.gov; publication data from Web of Science with author or co-author affiliation from the federal agency.
___________________
7 Included in the list of “optional” metrics for agencies that was released in April 2020 by NIST’s Technology Partnership Office, working with the IAWGTT, was the number of datasets open to the public.
collects metrics across all the EOSDIS distributed active data centers and publishes an annual report of EOSDIS metrics.8 There is evidence of commercial products stemming from NASA’s data and software, such as from WebWorldWind, which has been used “to monitor weather patterns, visualize cities and terrain, track vehicle movement, analyze geospatial data, and educate humanity about Earth.”9
Other agencies not included among the four in Table 7-2 also provide a substantial number of datasets, most of which are available for public use. For example, the Department of the Interior has more than 80,000 datasets, and NIST, the National Oceanic and Atmospheric Administration, and the National Telecommunications and Information Administration’s Institute for Telecommunication Sciences possess nearly 40,000 datasets.
Although measuring the number of datasets is helpful, it is more important to understand the degree to which they are being utilized outside of the government. Without an idea of the number of downloads or dataset citations or, better yet, some sense of how they are contributing to innovation, understanding the economic value of the data produced by federal labs with any accuracy is impossible.10 An additional complicating factor is that once downloaded, these data may be made available on cloud platforms, where there could be widespread additional dissemination without downloading.
Assessing the impact of federally created software on innovation and commercialization can be challenging because the software itself is not typically deployed commercially, but instead enables the development of commercial products, processes, or services. For example, DOE acknowledged challenges in tracking the impact of model simulations on future innovations and products downstream (Lally, 2019). The development of additional APIs and expansion of platforms such as GitHub over the past few years have made it easier to assess the value of federally created software, including the extent of its use and reuse, as well as the interconnections among open-source networks (Keller et al., 2018). NASA has 267 repositories posted on Github.nasa.gov and collects data using scripts on which projects have the most interaction.
Although a number of government agencies and federal labs have implemented policies with respect to collecting and analyzing how their knowledge and information, including digital products, are being used by the private sector, this information is not universally collected. Exemplar agencies, such as DOE, are employing common platforms such as DOE.code11 and code.gov to consolidate information on the number of downloads from their software code depositories. Similarly, NASA has implemented an internally
___________________
8 See https://earthdata.nasa.gov/eosdis/system-performance.
9 See https://worldwind.arc.nasa.gov/web/.
10 It is also difficult to predict potential uses for the data in the future. For example, although Landsat maps were originally designed for agricultural applications, they provided valuable information that aided in gold discovery, such that the rate of significant gold discoveries doubled after a region had been mapped (Nagaraj, 2018).
11 Access at https://www.osti.gov/doecode/.
facing software release program to streamline and standardize the review process for software across all 10 field centers and improve its ability to track downloads of NASA’s public data, software, and APIs (Murphy, 2019). NASA is an exemplar in making its software available and may serve as a model for other agencies to follow in making their software more easily discovered.
Impacts beyond Technology Transfer
As noted in the case of datasets and software, any understanding of the contributions of the federal laboratories to innovation requires understanding how their outputs are utilized outside the lab. No metrics are collected that measure the effect of technology transfer on the recipient organization or the broader economic or societal impact of research at federal labs (Link et al., 2019).
Several federal agencies have conducted their own studies to determine the economic impact of their labs. While not generalizable, these individual economic impact reports can inform data collection and analysis methodologies, contribute to the improvement of technology transfer and commercialization programs, provide a better understanding of the economic and other impacts of specific technologies, and improve technology transfer and commercialization programs (Conover et al., 2010; O’Connor et al., 2019).
These reports may be particularly helpful in assessing the value of data, which are more challenging to value than conventional assets as there is no uniformly established framework for capturing their value (Coyle et al., 2020). For example, a study of the U.S. Geological Survey’s LANDSAT images estimates that LANDSAT provided users an annual benefit of $2.19 billion in 2011, $1.79 billion of which redounded to U.S. users (Miller et al., 2013). An update in 2019 estimates the benefit to be $3.45 billion in 2017, with U.S. users accounting for $2.06 billion of that total (Straub et al., 2019). A 2019 report on the U.S. Air Force’s Global Positioning System (GPS) shows such benefits as “productivity gains from new and existing products and services, improvements in quality, increases in personal enjoyment, and environmental and public health impacts” (O’Connor et al., 2019, p. ES-2). And a 2013 study released by the Battelle Institute estimates that the federal investment in Human Genome Project–related genomics research has resulted in a total U.S. economic impact of nearly $1 trillion since 1988 (Battelle Technology Partnership Practice, 2013).
PROPOSED NEW METRICS
As discussed above, metrics presented in NIST’s annual technology transfer report do not provide sufficient information to conduct a comprehensive assessment of the effectiveness of federal laboratory technology transfer activities with respect to digital products and their subsequent commercialization. Moreover, separate metrics are not currently collected for digital products. The development of metrics for such a specific category will be challenging given the
wide array of digital products arising from research at the federal labs and the combination of components that may exist within a single digital product.
New approaches and measures would enable a more comprehensive evaluation of the effectiveness of the federal labs’ technology transfer and commercialization activities, both as they relate to digital products and more broadly. As a first consideration, it is important to note that most of the data discussed above—R&D spending, patents, publications, CRADAs—do not reflect the development of new products, processes, or services (i.e., innovations). Rather, they reflect either measures of inputs into inventions or innovations (e.g., publications) or inventions themselves (e.g., patents, software). These measures do not reveal what or how many new products, processes, or services were actually developed and commercialized on the basis of these inputs. To obtain such information, it is necessary to survey firms whose commercialization efforts build on the knowledge and inventions derived from the labs (Link et al., 2019). Such a survey of firms need not be a stand-alone survey, but could be added to NSF’s current corporate R&D surveys.12
Survey questions concerning digital products might cover two broad areas: (1) the knowledge flows from federal labs that contribute to firms’ R&D and related efforts, and (2) the acquisition and commercialization of developed inventions (patented and not) from the federal labs.
Survey Questions Concerning Knowledge Flows
Survey questions concerning flows of knowledge from federal laboratories into a firm’s R&D operations might best be targeted to companies’ R&D unit managers or directors (Cohen et al., 2002). Questions could include, for example, whether any of a number of possible sources provided information, data, or knowledge that either (1) suggested a new R&D project, (2) contributed to the completion of an existing project, or (3) resulted in process improvements. In addition to federal labs, other possible sources might include other firms (e.g., buyers, suppliers, competitors), contractors, or universities. Inquiring about such other sources would enable assessment of the importance of knowledge originating from the federal labs and comparison of the importance of the labs and other sources as providers of such knowledge. A question could also be asked regarding the amount of time and effort that was required to “clean up” lab-developed datasets to make them usable for further development and commercialization.
Additional questions regarding the contributions of the federal labs to companies’ R&D could include the percentage of a firm’s R&D projects that make use of various types of outputs, including research findings, techniques, instruments, software, and data, from the labs (or other sources), and the frequency with which federal lab outputs contribute to companies’ R&D projects
___________________
12 The Annual Business Survey, undertaken by NCSES, is an example of an existing survey concerned with corporate R&D and innovation. See https://www.nsf.gov/statistics/srvyabs/.
(e.g., once per week, once per month, once every 6 months). Finally, as an important guide to policy, the survey could explore the pathways through which such knowledge, software, data, or other digital outputs from federal labs were acquired, including, for example, licenses, cooperative arrangements, publications, public meetings or conferences, informal information exchange, use of facilities, and hiring. Note that these pathways should not be viewed as mutually exclusive.
Survey Questions Concerning the Acquisition and Commercialization of Developed Inventions
In addition to the knowledge flows that may serve as inputs into firms’ R&D, a survey could elicit data on the extent to which firms acquire and commercialize such inventions as developed ideas, software, overall concepts, and prototypes.13 Following the methodology used by Arora and colleagues (2016), questions bearing on the acquisition and commercialization of inventions from the federal laboratories would first ask whether the firm introduced any “new” products in the prior 3 years; whether these products were new to the firm; and if so, also new to the firm’s market. Then, focusing the respondent’s attention on a specific, important new product (e.g., one accounting for a plurality of sales revenue in the firm’s line of business), the survey could continue by asking whether that new product either was a digital one (e.g., software, data) or had an essential digital component.
Given an affirmative response to the previous question, a line of inquiry could be followed to obtain a sense of how the federal labs compare with other sources of innovation, and thus how important they are in the division of innovative labor in the U.S. economy. Questions on the source of the invention underlying the new product in question (i.e., the overall concept or prototype) would include a comprehensive range of possibilities (the firm’s own R&D activities, suppliers, buyers, independent inventors, contractors, universities, the federal labs). Then, as with knowledge flows, if the firm acquired the invention from an outside source, the survey could identify the channel(s) used to acquire it (e.g., license, acquisition, contract [including software agreements], cooperative arrangement [including CRADAs], informal information exchange). In this survey, it would be critical to collect data that would allow an assessment of the importance of the new product to the firm, such as the estimated percentage of the revenue in a defined line of business accounted for by the product.
In addition to the above questions about new products (including services), the survey could inquire about the contribution of external sources, especially federal labs, to the development of new processes (i.e., new manufacturing processes, new processes for delivering services) and as sources of data and software.
___________________
13 This would likely be a different survey from the one examining knowledge flows because the respondent within a firm would likely differ.
Thus in addition to collecting data on the activities and outputs of the federal labs, the committee proposes surveying firms that are potential beneficiaries of the knowledge and digital inventions produced in the labs. As noted in Chapter 6, the committee is also recommending a survey of lab managers and scientists to assess a variety of individual factors and organizational practices that may both affect the propensity of scientists to engage in technology transfer and identify best practices in managing technology transfer. Thus, the committee proposes three data collection efforts:
- data from individual federal labs on numerous dimensions of technology transfer, supplementing existing data-gathering efforts;
- data from scientists working at federal labs; and
- data from companies relating to their interactions with federal labs.
IN CLOSING
The committee recognizes that the collection of additional data from federal laboratories and companies may represent a substantial burden of time and effort. Any additional efforts to collect data from the labs and their personnel will therefore need to be appropriately resourced to ensure that the data can be gathered without compromising other lab responsibilities and without placing a burden on technology transfer offices to fund these efforts, which could incentivize them to seek to raise money through royalties and licensing. The allocation of resources will also need to take into account the training and technology needed to collect and analyze the data on the proposed new metrics. To reduce the cost and time burden, the government could, whenever possible, use public and commercially available data and new research tools to supplement or replace the proposed new survey efforts. For instance, the government could use textual analysis techniques to link data on licenses held by the government to patents, systematically track software, and identify startup activities by federal employees. The Federal Lab Consortium has contracted with the Association of University Technology Managers to improve its reporting of metrics, and this initiative holds promise for resulting in better metrics and data-collection methods. Company surveys could be made part of annual reports of licensees. The government could also consider establishing a centralized public repository of information on licenses that might assist in academic research on these topics. Unnecessary data-collection efforts or failure to leverage technological capabilities to collect data that already exist will add to the burdens placed on labs and could discourage the transfer of knowledge and technology.
FINDINGS AND RECOMMENDATIONS
Finding 7-1: Both existing metrics on federal laboratory activities that may result in the commercialization of digital products and the reporting
of these metrics are inadequate. Thus, they do not allow for a comprehensive assessment of the commercialization of either digital products arising from research at federal labs or the federally developed inputs into that research, including their broader impact on the economy.
Recommendation 7-1: The Interagency Working Group on Technology Transfer and the National Science Foundation should coordinate on the collection of a more comprehensive set of metrics on both the inputs and outputs of those federal laboratory activities that may result in commercialization of digital products. These metrics should be reported in the annual report to Congress from the National Institute of Standards and Technology. These metrics should include, but not be limited to, participation in public conferences or meetings, technology transfer budgets, number of employees in the technology transfer office of each lab, research and development (R&D) budgets, the composition of R&D (e.g., percentage of effort devoted to basic research, applied research, and development), software downloads, software licenses, data downloads, cooperative arrangements, software licensing royalties, invention disclosures, patents, and copyrights. This information should be tracked annually and reported publicly at the individual lab level except where national security might be compromised.
Recommendation 7-2: The National Institute of Standards and Technology or the Office of Management and Budget should direct federal agencies to provide a more comprehensive accounting of the activities of and results produced by all cooperative research and development agreements and all other cooperative arrangements between the federal laboratories and the private sector, including accounting of failures.
Recommendation 7-3: The National Science Foundation’s National Center for Science and Engineering Statistics (NCSES) should develop survey questions for firms, in accordance with Paperwork Reduction Act requirements, regarding the data, software, digital content, knowledge, and inventions originating from the federal laboratories that have contributed to firms’ commercialization of new products, processes, and services. Firms should also report on the patents, processes, and products to which the outputs of the federal labs have contributed. These survey questions should encompass firms’ cooperative activities with the labs and the usability of datasets and software released by the labs. These questions could be included in NCSES’s Annual Business Survey or in a separate survey should NCSES conclude that this would be a more effective means of data collection.
Recommendation 7-4: Federal agencies should dedicate sufficient resources to measurement such that analysts and policy makers will have the information needed to develop recommendations regarding the federal laboratories’ technology transfer and other activities that impact the commercialization of the labs’ research and development outputs, including those related to digital products. To this end, the National Science Foundation should standardize the collection and reporting of the current data elements and those proposed by the committee. The Office of Management and Budget and Congress should support both the efforts of the National Center for Science and Engineering Statistics to develop and conduct these surveys and the efforts of the labs to meet these data collection requirements.


