
9
Federal Programs That Support Cancer Prevention and Early Detection
Opportunitiestopromotecancer prevention and early detection span several sectors of society including health systems and providers, educational institutions, social services agencies, employer and labor organizations, and consumer groups. From a public policy perspective, actions to foster change can be taken by the federal government, states, and local entities (e.g., county and city governments and school boards). This chapter briefly describes the federal role in support of cancer-related prevention services in five important areas:
-
national objectives and guideline development,
-
information dissemination,
-
monitoring and surveillance,
-
facilitation of statewide program planning and evaluation, and
-
provision of and payment for services.
The federal government’s role in education and training is described in Chapter 8, and its role in research is described in Chapter 10. Previous chapters highlight the significant roles of state and local entities (both public and private) in carrying out important functions to incorporate cancer prevention and early detection programs into community-based programs (Chapters 4 and 6).
NATIONAL OBJECTIVES AND GUIDELINE DEVELOPMENT
Explicit national health-related goals and objectives have been set as part of the Healthy People 2010 initiative (U.S. DHHS, Office of Disease
Prevention and Health Promotion, 2000), and efforts are under way to chart the nation’s progress toward those goals. Such objectives provide invaluable guidance to policy makers, and assessments of the achievement of these objectives often provide the impetus needed to stimulate systematic changes. Cancer-related objectives from Healthy People 2010 are shown in Box 9.1.
Evidence-based guidelines for clinical and community practice also provide maps for action. The U.S. Preventive Services Task Force (USPSTF) periodically conducts rigorous assessments of the effectiveness of clinical
|
BOX 9.1 Cancer-Related Healthy People 2010 Objectives
SOURCE: US DHHS and Office of Disease Prevention and Health Promotion, 2000 (www.health.gov/healthypeople). |
prevention services, and the U.S. Task Force on Community Preventive Services is assessing the effectiveness of interventions aimed at communities. USPSTF is an ad hoc independent panel of private-sector experts in primary care and prevention convened by the U.S. Public Health Service’s Agency for Healthcare Research and Quality (AHRQ). USPSTF evaluates scientific evidence of the effectiveness of clinical prevention services (e.g., screening tests, counseling, immunization, and chemoprophylaxis) and produces age- and risk factor-specific recommendations for the services that should be included in a periodic health examination. USPSTF is supported by outside experts, two Evidence-Based Practice Centers (groups that systematically synthesize available literature), and liaisons from the major primary care societies and from U.S. Public Health Service agencies. Currently, the third USPSTF, convened in 1998, is issuing recommendations updating its 1996 Guide to Clinical Preventive Services (www.ahrq.gov/clinic/cps3dix.htm).
The 15-member independent, nonfederal Task Force on Community Preventive Services first met in 1996 and issued a number of reports, among them Recommendations Regarding Interventions to Reduce Tobacco Use and Exposure to Environmental Tobacco Smoke (Task Force on Community Preventive Services, 2001).
Other agencies within the federal government such as the Centers for Disease Control and Prevention (CDC) and AHRQ have been at the forefront in identifying effective prevention intervention strategies. CDC, for example, has issued three guidelines aimed at improving the health of school-age children: (1) CDC’s Guidelines for School Health Programs: Promoting Lifelong Healthy Eating (www.cdc.gov/nccdphp/dash/nutguide.htm), (2) Guidelines for School and Community Programs to Promote Lifelong Physical Activity Among Young People (CDC, 1997a), and (3) Guidelines for School and Community Health Programs Preventing Tobacco Use and Addiction (www.cdc.gov/nccdphp/dash/ptuaaag.htm). In 2000 AHRQ helped issue an update of its 1996 smoking cessation guideline that provides exhaustive information on best practices for clinicians (http://www.surgeongeneral.gov/tobacco/systems.htm). Another activity that has provided guidance regarding certain cancer prevention interventions is the National Cancer Institute’s (NCI’s) Consensus Development Conference process. Here, expert panels convene for a few days to review a synthesis of the literature and produce a consensus statement. In the area of cancer prevention and early detection, recent statements are available for breast cancer screening for women ages 40 to 49 (1997),1 cervical cancer (1996), and ovarian cancer screening, treatment, and follow-up (1994) (http://odp.od.nih.gov/consensus/cons/cancer.htm).
|
1 |
The controversy surrounding this statement is described in Chapter 4. |
The federal government also plays an active role in guideline dissemination. The AHRQ Put Prevention into Practice (PPIP) initiative is designed to help implement the recommendations of USPSTF by supplying health care providers with easy-to-use materials to prompt adherence to the guidelines (http://www.ahrq.gov/clinic/ppipix.htm). Roughly 20 percent of the services considered by USPSTF and PPIP relate to cancer detection or prevention.
Another federally sponsored guideline dissemination activity is CONQUEST (Computerized Needs-Oriented Quality Measurement Evaluation System), which consists of a database of performance measures (conditions, diseases, and procedures), measure sets (measures with a common purpose and developer), and conditions (with detailed epidemiological information). CONQUEST includes measures related to the management of several cancers (i.e., colorectal, lung, prostate, and breast cancer), the use of screening tests (i.e., mammography and Pap smear), and cigarette use (www.ahrq.gov/qual/conquest.htm).
INFORMATION DISSEMINATION
NCI is at the center of federal efforts to disseminate cancer-specific information to individuals and health care providers. By telephone, individuals can receive up-to-date cancer information in English or Spanish through the Cancer Information Service (1-800-4-CANCER). Over 390,000 calls are received each year, with 79 percent from cancer patients and their families and the balance from the general public and health care professionals (http://cis.nci.nih.gov/about/underserved.html, accessed January 30, 2002). Through the World Wide Web (www.nci.nih.gov/cancerinfo/index.html), individuals can get information about the basics of cancer; treatment options; clinical trials; genetics, causes, risk factors, and prevention; screening; and information about support and other resources. Information about cancer trials and how to access them is available through a dedicated clinical trial website (http://cancertrials.nci.nih.gov).
In an effort to learn more about the public’s access to and use of cancer-related health information, the NCI is conducting a national survey, the Health Information National Trends Survey. Other research-oriented activities that are a part of NCI’s cancer communications initiative are described in Chapter 10.
PDQ (Physician Data Query) is NCI’s comprehensive cancer database originally designed for use by physicians. The database contains peer-reviewed summaries on cancer treatment, screening, prevention, genetics, and supportive care. These summaries are updated monthly by specialized editorial boards. There are two versions of the screening and detection summaries. One is for health professionals and contains current data, by cancer site, on screening interventions, levels of evidence for statements regarding screening, and the significance and evidence of benefit for the
statements. Another version is available for patients and is written in non-technical language (http://cancernet.nci.nih.gov/pdqfull.html). Provider- and consumer-oriented prevention summaries are also available. In addition to these summaries, PDQ includes an online registry of approximately 1,800 open and 10,300 closed clinical trials from around the world. An additional resource is directories of health professionals and organizations involved in cancer care, and professionals who provide genetics services (e.g., cancer risk assessment, genetic counseling, genetic susceptibility testing).
The Centers for Disease Control and Prevention also supports information dissemination, often targeted to states and localities. Tobacco Information and Prevention Source (TIPS) is a Web portal that provides an array of tobacco control information and links to resources (http://www.cdc.gov/tobacco/issue.htm). The site provides access to guides to tobacco cessation; educational materials for parents, educators, professional and youth leaders; state information, such as best practices; and information of interest to children and young adults (sports initiatives, celebrities against smoking). Also online at CDC’s site is information about obesity and overweight, including guidelines and recommended strategies to prevent chronic diseases and obesity, and programs to support state health departments and their partners (www.cdc.gov/nccdphp/dnpa/obesity/index.htm). In October 2000, CDC’s Division of Nutrition and Physical Activity initiated a program to support state health departments and their partners in developing and implementing targeted nutrition and physical activity interventions in an effort to prevent chronic diseases, especially obesity. Twelve states funded in FY 2000 and 2001 were encouraged to use a social marketing approach in designing their population-based strategies, particularly policy-level and environmental interventions. Information about cancer screening is also available at CDC’s website, including a series of “At-a-Glance” publications focusing on the importance of early detection (www.cdc.gov/health/cancer.htm).
The Office of the Surgeon General has issued a series of reports regarding the health consequences of tobacco (Box 9.2).
MONITORING AND SURVEILLANCE
Several federally supported surveys and administrative record systems provide the data needed to assess progress toward reaching the nation’s cancer prevention and early detection goals (Box 9.3).
The National Health Interview Survey (NHIS) is the principal source of information on the health of the civilian noninstitutionalized population of the United States (http://www.cdc.gov/nchs/about/major/nhis/hisdesc.htm) and provides national estimates of a number of cancer-related health behaviors including tobacco use and use of cancer screening tests. The NCI supports periodic supplements to the NHIS on cancer control (most re-
|
BOX 9.2 Surgeon General’s Reports on Tobacco Control
|
cently, in 2000) to assess knowledge, attitudes, and practices concerning cancer-related health behaviors and cancer screening (Stacey Vandor, Planning Officer, NCI, personal communication to Maria Hewitt, February 11, 2002). The NHIS involves personal interviews in homes to gather information on household members. The NCI also supports a smoking supplement to the Current Population Survey (CPS), a household survey of 60,000 households conducted by the Bureau of Census for the Bureau of Labor Statistics. The CPS provides data on the U.S. labor force and employment statistics (http://www.bls.gov/cps/cps_over.htm#overview).
State-based estimates of preventive health behaviors, knowledge, and attitudes are available through CDC’s Behavioral Risk Factor Surveillance
|
BOX 9.3 Selected Examples of Cancer Prevention and Early Detection Surveillance Tools
|
System. This telephone survey is conducted by states among adults age 18 and older. States generally use a core survey instrument and may add additional items to meet local informational needs.
A number of data systems provide information on important subpopulations. Estimates of rates of tobacco use and levels of access to cigarettes among youth, for example, are available through CDC’s Youth Risk Behavior Surveillance System (CDC, Division of Adolescent and School Health, http://www.cdc.gov/nccdphp/dash/yrbs/), and estimates of cancer screening practices among Medicare beneficiaries are available through the Medicare Beneficiary Survey.
National surveys of ambulatory care practices help gauge the extent to which physicians are delivering preventive health services such as counseling on diet, nutrition, and exercise. Two surveys sponsored by CDC, the National Ambulatory Medical Care Survey and the National Hospital Ambulatory Medical Care Survey, collect data from a representative sample of physicians’ offices and hospital outpatient departments and provide national estimates of the number of ambulatory care visits, reasons for visits (e.g., diagnoses associated with visits and use of selected preventive health interventions), and actions taken during visits (e.g., counseling, ordering of tests, prescriptions for medication).
The National Health and Nutrition Examination Survey, sponsored by CDC, collects information about the health and diet of people in the United States. NHANES is unique in that it combines a home interview with health tests that are done in a mobile examination center (www.cdc.gov/nchs/nhanes.htm). Results of the survey have been used to monitor trends in overweight and obesity (see Chapter 3, figure 3.1).
Some data systems are unique to a system of care. The U.S. Department of Veterans Affairs (VA), for example, uses both survey data and formal audits of medical records to assess progress in cancer prevention and early detection (see Tables 9.3 and 9.4).
FACILITATING STATEWIDE PROGRAM PLANNING AND EVALUATION
National organizations may set guidelines and policy for cancer prevention and control, but implementation of public health measures to reduce the burden of cancer largely falls to state and local health departments, along with their partners, which include consumer and advocacy organizations, universities, and area health care providers. Wide state-level variations in the prevalence of cancer-related risk factors are alarming but provide opportunities to target interventions and achieve gains in health (Box 9.4).
CDC would like to build the capacities of states—and, in turn, their local partners—to both develop and implement comprehensive cancer control plans. As part of CDC’s National Comprehensive Cancer Control
|
BOX 9.4 State-Level Variations in Cancer Risk Factors Tobacco smoking. The rates of smoking among adults in the 10 states with the lowest smoking rates and the 10 states with the highest smoking rates were 19 and 28 percent, respectively, in 1999. Closing this gap, alone, could reduce lung cancer rates by a third in the 10 states with the highest smoking rates. Breast cancer screening. The rate of adherence to current recommendations for screening mammography by women age 50 and older was 84 percent in the 10 states with the highest screening rates in 1999, but the rate was only 70 percent in the 10 states with the lowest rates. Closing this gap could reduce breast cancer mortality rates by 5 percent in the 10 states with the lowest rates. Colorectal cancer screening. The gap between the 10 states with the highest colorectal cancer screening rates and the 10 states with the lowest screening rates is wide (39 versus 30 percent), but much more important is the observation that screening rates are low in all states. Screening for colorectal cancer has a very high potential for saving lives, as it has proven effectiveness, yet it is being applied to only a small proportion of the population. SOURCE: Byers, University of Colorado School of Medicine, unpublished analyses of data from CDC’s Behavioral Risk Factor Surveillance System. |
Program, such plans have been defined as those with an integrated and coordinated approach to reducing the incidence and the rates of morbidity and mortality from cancer through prevention, early detection, treatment, rehabilitation, and palliation (CDC, 2001a; www.cdc.gov/cancer/ncccp/index.htm).
CDC has identified a useful framework for the establishment of a state cancer control program and has provided various models for comprehensive planning and evaluation. Essential elements of a comprehensive plan include (Abed et al., 2000a,b) the following:
-
strategies and mechanisms for developing and maintaining partnerships,
-
assessments and surveillance,
-
infrastructure development,
-
public education,
-
professional education,
-
policy and legislative activities, and
-
evaluation and monitoring.
Phases of implementation of a comprehensive state plan include setting optimal objectives that are data-driven, determining optimal strategies that are science-driven, establishing feasible priorities given the capacity, and implementing effective strategies that are assessed by evaluations of outcomes (Abed et al., 2000b).
Many states have in place some of the essential elements of a comprehensive program. Nearly half of the states, for example, have cancer registries that achieve the standards of completeness, timeliness, and coverage to provide accurate cancer incidence data for planning and evaluation. State data on the prevalence of cancer-related risk factors such as smoking are available through the Behavioral Risk Factor Surveillance System (CDC, Division of Adult and Community Health, http://www.cdc.gov/nccdphp/brfss/) and the Youth Risk Behavior Surveillance System (CDC, Division of Adolescent and School Health, 1999, http://www.cdc.gov/nccdphp/dash/yrbs/index.htm). In the area of early detection, all states have in place CDC-funded breast and cervical cancer screening programs targeted to low-income and underserved women (CDC, The National Breast and Cervical Cancer Early Detection Program, http://www.cdc.gov/cancer/nbccedp/about.htm).
NCI has also promoted the development of state cancer control capacity through its Surveillance, Epidemiology, and End Results Program and through special grants (see the discussion of research initiatives in Chapter 10).
According to a recent CDC assessment, however, only 13 states have comprehensive state plans that are being implemented (or that are ready to be implemented), 14 states and the District of Columbia are creating a new plan (or are updating an old plan), and 23 states have no plan or one that is outdated (Figure 9.1).
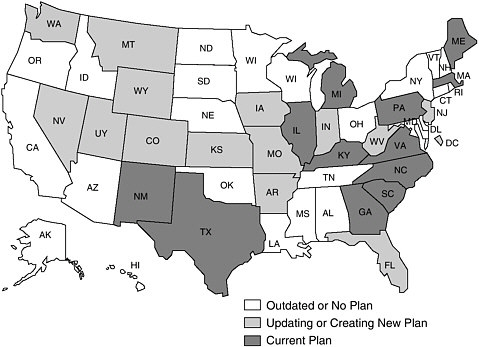
FIGURE 9.1 Comprehensive cancer control plans, 2001.
Although considerable variations in state capacities have been observed and certain barriers to implementation have been identified, it is unclear what levels and types of investments are needed to build state and local capacities and how these needs may vary across the nation. CDC’s Division of Cancer Prevention and Control spends an estimated $250 million on cancer control and prevention annually, but much of the money is categorically targeted to specific activities (e.g., cancer registries), populations, or cancer sites (see Chapter 10). Since 1998, 19 states and 1 tribal organization have received grant support totalling approximately $37 million from CDC to develop and implement a comprehensive cancer control (CCC) plan. In addition, states and tribal organizations have been provided technical assistance regarding CCC plans with $1 million from the CDC (Leslie Given, Division of Cancer Prevention and Control, CDC, personal communication to Maria Hewitt, IOM, September 9, 2002). The CDC-funded states are developing programs that are varied, depending on the needs and organizational preferences of each state. The key to each program is, however, the same: fostering collaborative efforts among many sectors within the states to increase individual and organizational awareness of the state’s cancer burden and achieve objectives that will lead to future reductions in that burden (Byers, University of Colorado School of Medicine, unpublished). Resources appear to be inadequate to meet the need for CCC plan development and implementation. In 2002, for example, CDC had resources to support only half of the requests for assistance from states, territories, and Indian tribes in response to its National Cancer Prevention and Control Program Announcement (Leslie Given, Division of Cancer Prevention and Control, CDC, personal communication to Maria Hewitt, IOM, August 26, 2002). The CDC estimates that $30 million per year would be needed before states would have plans developed and implementation in progress by 2005 (Leslie Given, Division of Cancer Prevention and Control, CDC, personal communication to Maria Hewitt, IOM, August 26, 2002).
CDC also provides guidance to states regarding comprehensive approaches to risk reduction. The CDC’s Office on Smoking and Health, for example has described essential elements of a comprehensive tobacco control program (CDC, 1999d). The extent to which states have such comprehensive programs is discussed in Chapter 11. Guidelines for comprehensive state programs to promote healthy eating and physical activity are forthcoming.
The National Governors Association has launched a website, State Best Practices in Cancer Prevention and Control, to help states communicate their successes and learn from the experience of other states (National Governors Association, http://www.nga.org/center/divisions/1,1188,C_ISSUE_BRIEF^D_1913,00.html). The website also provides basic cancer statistics by state, and summaries of relevant state legislation.
PROVIDING AND PAYING FOR SERVICES
This section reviews the role of the following selected federal programs in the provision of (or reimbursement for) prevention services:
Direct Providers of Services
-
Health Resources and Services Administration programs (Community and Migrant Health Centers)
-
Veterans Health Administration
-
Indian Health Service
-
Centers for Disease Control and Prevention (National Breast and Cervical Cancer Early Detection Program)
-
Office of Family Planning, US DHHS
Indirect Providers of Services (Payers)
-
Centers for Medicare and Medicaid Services (formerly the Health Care Financing Administration)
-
Medicaid
-
Office of Management and Budget (which oversees federal employee health benefits)
Direct Providers of Services
Health Resources and Services Administration
Sometimes called the “access” agency, the Health Resources and Services Administration (HRSA) oversees a number of direct service and training programs that provide primary care and other services to vulnerable and underserved populations. HRSA’s Bureau of Primary Health Care (BPHC) programs serve more than 12 million people in roughly 4,000 primary care sites including Community and Migrant Health Centers, Black Lung Clinics, and clinics along the United States-Mexico border. BPHC programs further bolster the public health infrastructure through training and educational programs, placement of clinicians in areas with shortages of health care professionals, and support of primary care offices in state health departments and independent primary care associations that attempt to build statewide coalitions for primary care health delivery systems. In 1999, BPHC launched the “100% Access and 0 Health Disparities Campaign” to support community leaders in setting and achieving access and disparity goals (Health Resources and Services Administration, 2000a).
Community and Migrant Health Centers HRSA’s largest direct service program is the Community Health Center (CHC) and Migrant Health Center (MHC) Program. In 1998 the program had approximately 700 health centers
with nearly 3,000 clinics providing services to more than 9 million people (Health Resources and Services Administration, 2001; www.hrsa.gov). Most clients of such centers are uninsured or are insured by Medicaid. In 1998, HRSA-funded health centers served approximately 9 percent of Medicaid beneficiaries, 8 percent of uninsured Americans, and 20 to 25 percent of the poor and near-poor uninsured Americans (Health Resources and Services Administration, 2001; Institute of Medicine, 2000d). The majority of BPHC health center patients are from racial or ethnic minority groups (Health Resources and Services Administration, 2001). Health centers must meet certain criteria to be designated federally qualified health centers (FQHCs); for example, they must provide culturally competent, comprehensive primary care services to all age groups, offer services on a sliding scale based on income, and provide services regardless of ability to pay. HRSA’s fiscal year 2001 appropriation for the CHC program is $1.169 billion, and that for the MHC program, $98.9 million.
Rates of Pap smears, screening mammography, and clinical breast examinations among women served in CHCs exceeded those identified as Healthy People 2000 goals when they were examined in 1995 (Regan et al., 1999). Efforts are under way to complete a Health Center Primary Care Effectiveness Review to support continuous quality improvement of health center programs funded by the Bureau of Primary Health Care (www.hrsa.gov). Among the measures included in the review are the availability of written protocols for cancer screening, whether screening intervals are defined, use of patient tracking and recall systems, follow-up for abnormal screening tests, and evidence in medical records of adherence to protocols.
A number of research and demonstration projects have been conducted within CHCs to improve cancer screening (Hedegaard et al., 1996; Kohatsu et al., 1994; Lacey et al, 1993; Lipkus et al., 1996; Paskett et al., 1998; Polednak and Flannery, 1994; Rimer et al., 1996a; Valdini and Cargill, 1997; Yarnall et al., 1998; Zapka et al., 1993) or promote smoking cessation (Lipkus et al., 1999; Tessaro et al., 1997; Yarnall et al., 1998; Zapka et al., 2000b).
BPHC has requested $19.3 million to support several new initiatives to improve its cancer prevention programs (Health Resources and Services Administration, 2000a):
-
launch culturally appropriate prevention campaigns in collaboration with CDC;
-
hire full-time community outreach workers at selected health centers to distribute educational materials in homes, churches, and other community settings;
-
develop training modules on cancer screening and diagnostic procedures for primary care clinicians;
-
establish linkages between primary care sites and cancer treatment facilities to facilitate referral;
-
identify models of success and replicate the models across BPHC programs;
-
fund full-time clinical coordinators in each of the 50 state primary care associations to track primary cancer care performance, exchange information about successful initiatives among member sites, establish and expand linkages between primary care sites and tertiary cancer care centers, support cancer educational initiatives, and coordinate with CDC state cancer coordinators;
-
develop and implement the Cancer Health Disparities Collaborative for BPHC-supported health centers in conjunction with the Institute for Health Care Improvement to address screening, diagnosis, and referral for treatment and follow-up care; and
-
study factors that affect health care access and outcomes among vulnerable populations with breast cancer.
Veterans Health Administration
The Veterans Health Administration (VHA) is one of the nation’s largest integrated health care systems, with 173 medical centers, 771 ambulatory care and community-based clinics, 134 nursing homes, 42 domiciliaries, and 206 counseling centers and other facilities (www.va.gov). These facilities are organized regionally into 22 Veterans Integrated Service Networks (VISN). Each year, VHA, with a budget of more than $20 billion, serves approximately 3.6 million veterans, an estimated 15 percent of the total veteran population (www.va.gov/vetdata). Only about 12 percent of those treated at VA facilities are treated for a service-connected disability. The majority are poor and without other sources of health care (Institute of Medicine, 2000d). Each year, an estimated 50,000 new cases of cancer are diagnosed and 170,000 cancer patients are cared for within the VHA system (www.va.gov/cancer). A national cancer strategy articulated in 1997 addresses the need for high-quality cancer prevention, detection, and treatment services (Box 9.5)
Health promotion and disease prevention practices within VHA are guided by formal recommendations established by the VHA National Center for Health Promotion and Disease Prevention (Veterans Health Administration, 1999). Recommendations regarding counseling for cancer-related behavioral risk factors and cancer screening are summarized in Tables 9.1 and 9.2.
VHA has in place a management system for the implementation of prevention services. Each facility has a designated preventive medicine program coordinator, a health education coordinator, and a smoking cessation coordinator. VHA-wide efforts are facilitated by an individual who provides
|
Box 9.5 VHA National Cancer Strategy Policy Objectives
|
TABLE 9.1 VHA Cancer-Related Behavioral Risk Factor Counseling Recommendations
|
Service |
Target Condition |
Recommendation |
|
Tobacco use screening and counseling |
Cancer and pulmonary and cardiovascular diseases |
All veterans should be screened annually for tobacco use, and counseling should be offered to those who use tobacco. |
|
Problem drinking and alcohol moderation counseling |
Problem alcohol drinking |
Veterans should be asked each year to describe their use of alcohol. The use of a standardized screening questionnaire is recommended. High risk patients (those who consume three or more drinks daily) should receive alcohol counseling. |
|
Weight control and nutrition screening and counseling |
Cardiovascular disease, hypertension, hyperlipidemia, obesity, osteoporosis, and neural tube defects |
All veterans should receive height and weight measurements every 2 years. All veterans should have access to counseling to limit dietary intake of fat and cholesterol, maintain caloric balance, and emphasize the consumption of foods containing fiber. Female veterans should be advised to consume adequate amounts of calcium. Female veterans younger than age 50 years should be advised to take daily multivitamins containing folic acid. |
|
Physical activity screening and counseling |
Cardiovascular disease, hypertension, obesity, and diabetes mellitus |
All veterans should be encouraged annually to engage in a program of physical activity tailored to their health status and personal lifestyles. All veterans should have access to counseling regarding optimizing their level of physical activity. |
|
SOURCE: Veterans Health Administration (1999). |
||
TABLE 9.2 VHA Cancer Screening Recommendations
|
Cancer Site |
Target Group |
Recommendation |
|
Cervical |
Female veterans age 65 and under |
Pap smear testing is recommended every 3 years until age 65 for all women who are or who have been sexually active. |
|
Breast |
All female veterans |
All female veterans age 50 to 69 years should receive a mammogram every 1 to 2 years unless it is medically not indicated. Female veterans age 40 to 49 years should be counseled regarding the risks and benefits of screening, and those desiring mammography will receive that service. |
|
Colon-Rectum |
All veterans age 50 and older |
All persons aged 50 years and older should receive an annual fecal occult blood test or should undergo a sigmoidoscopy every 5 years. |
|
Prostate |
All male veterans age 50 and older |
All male veterans aged 50 years and older should receive annual counseling regarding potential benefits andhazards of prostate-specific antigen testing. |
|
SOURCE: Veterans Health Administration (1999). |
||
field liaison activities, for example, conducting regularly scheduled telephone conference calls with facility and VISN representatives. These contacts, in addition to active e-mail communications, provide opportunities to disseminate information on VHA polices and new research findings and to hear from providers about service-related issues, needs, and barriers. Special-interest groups interested in prevention topics such as nutrition and obesity have been established, and the members of those groups communicate via e-mail. Smoking cessation coordinators also have a group whose members communicate via e-mail.
Many VHA facilities have an electronic medical record system with the capability to provide reminders to clinicians regarding prevention services. Adherence to recommendations is monitored through ongoing independent chart reviews of each facility and periodic surveys of the health of veterans who use VA services. Independent chart audits provide objective evidence of the provision of service but do not detect the prevention services that a veteran may have received outside the VA system (e.g., tobacco counseling from a community-based program). The veterans health survey can capture such out-of-system uses of prevention services and may identify services that were provided within the VA system but not recorded in the chart. A comparison of some results regarding cancer-related prevention services from the 1999 chart audit and the veterans health survey shows somewhat higher rates of adherence to recommendations from the chart review than
from the veterans health survey (Tables 9.3 and 9.4). Some of the discrepancy might be due to a failure of patients to recall events that occurred during a health care visit, for example, remembering that a physician asked about alcohol use. The chart audit was for care provided in 1999, whereas the survey reported on care that may have been provided in the prior year.
TABLE 9.3 Preventive Health Practices, Veterans Health Survey, 1997–1999
|
|
Goals for Year 2000a |
VHA Rate (percent)b |
||
|
Preventive Practice and Group |
1997 |
1998 |
1999 |
|
|
Tobacco use counseling |
|
|||
|
• Men who are current tobacco users |
15 |
30 |
30 |
27 |
|
• Women who are current tobacco users |
15 |
27 |
27 |
25 |
|
• Men tobacco users offered counseling |
75 |
73 |
79 |
79 |
|
• Women tobacco users offered counseling |
75 |
78 |
82 |
84 |
|
Problem drinking and alcohol moderation counseling |
|
|||
|
• Men asked about/screened for problem drinking and alcohol use this year |
75 |
29 |
39 |
38 |
|
• Women asked about/screened for problem drinking and alcohol use this year |
75 |
21 |
29 |
30 |
|
Weight control and nutrition counseling |
|
|||
|
• Men receiving nutrition counseling this year |
75 |
49 |
50 |
50 |
|
• Women receiving nutrition counseling this year |
75 |
45 |
47 |
48 |
|
Physical activity counseling |
|
|||
|
• Men receiving activity counseling this year |
50 |
57 |
60 |
61 |
|
• Women receiving activity counseling this year |
50 |
55 |
58 |
59 |
|
Cervical cancer detection |
|
|||
|
• Women under age 65 with Pap test in past 3 years |
85 |
89 |
89 |
87 |
|
Breast cancer detection |
|
|||
|
• Women ages 50 to 69 receiving a mammogram in the past 2 years |
60 |
85 |
87 |
86 |
|
Colorectal cancer detectionc |
|
|||
|
• Women over age 50 receiving a fecal occult blood test this year |
50 |
33 |
56 |
61 |
|
• Men over age 50 receiving a fecal occult blood test this year |
50 |
29 |
51 |
55 |
|
aHealthy People 2000 goals as stated in VHA Handbook 1101.8. bWeighted as appropriate; 95 percent confidence interval for VHA is less than ±1 percent. Sample size for 1997 = 44,304; sample size for 1998 = 42,625; sample size for 1999 = 45,037. cThe figures for 1997 measure fecal occult blood test in the last year; the figures for 1998 and 1999 also include sigmoidoscopy within the last 5 years. SOURCE: VHA National Center for Health Promotion and Disease Prevention Veterans Health Survey, 1997–1999, June 4, 2001. |
||||
TABLE 9.4 Preventive Health Practices, Results of Chart Audit, External Peer Review Program, 1999
|
Preventive Service |
VHA Rate (percent) |
|
Tobacco use screening |
95 |
|
Smoking counseling |
|
|
One or more times per year |
93 |
|
Three times per year |
49 |
|
Alcohol use screening |
69 |
|
Cancer screening |
|
|
Screening for colorectal cancer |
74 |
|
Mammography |
91 |
|
Cervical cancer |
94 |
|
Prostate cancer |
66 |
|
SOURCE: VHA, 1999 Network Performance Report; Ron Sorrell, administrative officer, National Center for Health Promotion, personal communication, June 4, 2001. |
|
Top-performing programs for prevention services, identified through the chart audit program and veterans health survey, were contacted in 1999 to identify best practices to be shared across the program. Acceptance from clinical staff, the involvement of primary care staff in program planning, and the active involvement of nursing staff as part of multidisciplinary teams were among the elements believed to contribute to program success (Burdick, 1999).
As part of a special initiative in 1997, a directive called for all VHA facilities to implement a strategic plan based on the Agency for Health Care Policy and Research smoking cessation recommendations. According to a 1997 assessment of smoking cessation activities within the 147 VA medical centers that provide primary care services, virtually all facilities offered access to smoking cessation programs (145 of 147 medical centers) and had tobacco user identification systems in place (143 of 147). Among the centers with access to treatment programs, the treatments offered to smokers included brief encouragement during routine office visits (129 of 145 medical centers), intensive tobacco use cessation program (129 of 145 medical centers), and brief tobacco use cessation skills education program (80 of 145 medical centers) (Burdick, 1998). This systemwide review of capacity identified some deficits and has led to program development and improvement (Burdick, M, VA National Center for Health Promotion and Disease Prevention, personal communication, May 31, 2001). Although virtually all medical centers have a smoking cessation program, their contents vary widely, and some recommended services are not available (Oliver Par, VHA, personal communication, May 31, 2001). Nicotine inhalers, for example, although recognized as effective interventions for smoking cessation, are not listed on the national VA formulary and so are not routinely available
throughout the VA system. Under development in collaboration with the U.S. Department of Defense is a smoking cessation “tool kit” which will demonstrate models of excellence in two areas: smoking cessation provided in the context of primary care and specialized intensive services (Burdick, personal communication, May 31, 2001). The program will be disseminated through a satellite conference. As part of the program, an actual tool kit for providers will be made widely available and will include aids to counseling, for example, pocket cards to assist in referrals and playing cards for patients that include smoking informational messages (Oliver Par, VHA, personal communication, May 31, 2001).
Indian Health Service
The Indian Health Service (IHS), an agency within the US DHHS, is responsible for providing health services to American Indians and Alaska Natives. With $2.6 billion in federal appropriations in 2001, IHS serves individuals who are members of any of the 556 federally recognized tribes located in 35 states. The majority (55 percent) of American Indians and Alaska Natives eligible for IHS services rely on IHS as their sole provider of health care.
Care is provided by nearly 15,000 IHS employees in 49 hospitals, 221 health centers; and more than 300 clinics, health stations, and residential treatment centers. In locations where IHS does not have its own facilities or is not equipped to provide a needed service, IHS contracts with local hospitals, state and local health agencies, tribal health institutions, and individual health care providers. Since 1968, IHS has trained American Indian and Alaska Native community health representatives. More than 1,400 community health representatives are employed and supervised by their tribes and communities to provide early intervention and case finding and, in some cases, direct primary care and follow-up services. In addition to direct health services, IHS provides environmental health and engineering services (e.g., occupational health and safety services and pollution control services), and school-based programs (e.g., health education).
IHS serves 1.5 million individuals who reside on or near reservations and 330,000 individuals living in urban areas. Estimates are that 60 percent of the 2.5 million American Indians and Alaska Natives identified in the 1990 census are both eligible for services from IHS by virtue of their tribal affiliation and reside in or proximate to an IHS service area. Most American Indians live in urban areas, and there are concerns that the cancer needs of urban American Indians are not being met (Burhansstipanov, 2000; Michalek et al., 1996).
American Indians and Alaska Natives have historically had very low rates of cancer, in part because of competing causes of death (e.g., infectious diseases like tuberculosis) but, possibly, also because of their diets, physical activity patterns, and limited tobacco use. There is evidence, how-
ever, that the cancer incidence rates of American Indians and Alaska Natives are underestimated because of misclassification of American Indian or Alaska Native status on case reports to cancer registries (Partin et al., 1999; Sugarman et al., 1996).
American Indians have the poorest rate of survival from cancer of any racial or ethnic group, but it is unclear what is responsible for the disparity. In one case-control study, survival differences between Montana American Indians and non-American Indians could not be explained by differences in the cancer stage at diagnosis or the type of treatment received (Dennis, 2000). In another study, poorer survival among American Indians than among whites in western Washington State could not be explained by age, differences in stage at diagnosis, lack of cancer treatment, or residence in nonurban counties (Sugarman et al., 1994).
Although many American Indian cultures traditionally use tobacco ceremonially, habitual smoking is a relatively recent development, and its practice is reflected in rising lung cancer rates among American Indians. Smoking rates among Indian people nationwide are now about twice as high as those among the general population (www.ihs.gov).
Rates of use of screening tests among American Indian and Alaska Native women tend to be low. Mammography within the past 2 years was reported by 65 percent of American Indian and Alaska Native women age 50 and older during the period from 1992 to 1997 in the Behavioral Risk Factor Surveillance System (Coughlin et al., 1999). Studies of the rate of screening mammography use among selected groups of American Indian women—Navajo Indian women (Strauss et al., 1997); Sioux Indian women (Mahmoodian, 1997); American Indian women in Albuquerque, New Mexico (Gilliland et al., 2000); American Indian women in Phoenix, Arizona (Risendal et al., 1999b); and American Indian and Alaska Native women with diabetes (Giroux et al., 2000)—indicated that it is well below the recommended levels. One study suggested that lay health advisers, “Native Sisters,” are effective in motivating American Indian women to have mammograms (Burhansstipanov, 2000).
Cervical cancer rates among American Indian and Alaska Native women are higher than the rates among the U.S. general population. Rates of use of Pap tests among American Indian and Alaska Native women from 1992 to 1997 were relatively high: 83 percent according to the Behavioral Risk Factor Surveillance System (Coughlin et al., 1999). However, among women screened for cervical cancer as part of the National Breast and Cervical Cancer Early Detection Program from 1991 to 1998, American Indian or Alaska Native women were more likely than others to report never having had a prior Pap test and to have had the highest proportion of abnormal Pap tests among those screened for the first time as part of the program (Benar et al., 2001). Limited access to health care, lower than recommended levels of provider referrals, and a lack of knowledge about Pap smears were identified
as barriers to Pap smear use among American Indian women residing in Phoenix, Arizona (Risendal et al., 1999a,b).
Very high rates of alcohol-related disease and injury, diabetes, and mental health conditions among American Indians and Alaska Natives may diminish the emphasis placed on cancer control among programs administered by tribal health directors (Michalek et al., 1996).
Centers for Disease Control and Prevention
Since 1991 CDC has administered the National Breast and Cervical Cancer Early Detection Program (NBCCEDP) to provide screening services to medically underserved women, including older women, women with low incomes, and women of racial and ethnic minority groups. The program has provided more than 2.7 million screening examinations and diagnosed more than 8,600 breast cancers, more than 39,400 precancerous cervical lesions, and more than 660 cervical cancers (CDC, The National Breast and Cervical Cancer Early Detection Program, http://www.cdc.gov/cancer/nbccedp/about.htm).
The program operates in all 50 states, the District of Columbia, 6 U.S. territories, and as part of 12 American Indian and Alaska Native organizations. Fiscal year 2001 appropriations of $174 million enabled CDC to increase its education and outreach programs for women and health care providers, improve quality assurance measures for screening, and improve access to screening and follow-up services (CDC, The National Breast and Cervical Cancer Early Detection Program, http://www.cdc.gov/cancer/nbccedp/about.htm). The program covers postscreening diagnostic services, such as surgical consultation and biopsy, but does not cover treatment. As of July 2002, 43 states had expanded their Medicaid benefits after enactment of the Breast and Cervical Cancer Prevention and Treatment Act of 2000 (PL 106-354; http://www.cdc.gov/cancer/nbccedp/law106-354.htm# actions), a law that gives states the option to provide medical assistance through Medicaid to eligible women who are screened for and found to have breast or cervical cancer (including precancerous conditions) through NBCCEDP.
Estimates are that only 15 percent of women eligible for services receive care through NBCCEDP. Although NBCCEDP operates in all states, coverage within a state may be far from complete. In Louisiana, for example, three of nine regions in the state lack NBCCEDP screening services because of difficulties in recruiting providers in regions outside of major metropolitan areas. Plans are to close this gap by contracting with community primary care centers in underserved areas (Lynn Buggage, Women’s Preventive Health Program, New Orleans, LA, personal communication, to Vivien Chen, Louisiana State University Medical Center, August 21, 2001). The Institute of Medicine Committee on the Early Detection of Breast Cancer recommended in its report, Mammography and Beyond, that the program
be expanded to reach at least 70 percent of the program’s target population (Institute of Medicine, 2001b).
Office of Family Planning, U.S. Department of Health and Human Services
The National Family Planning Program was created in 1970 as Title X of the Public Health Service Act (PL 910572). Grants made under Title X provide funding for comprehensive family planning and preventive reproductive health services (www.os.dhhs.gov/opa/titlex/ofp.html). The Office of Family Planning had appropriations of $238.9 million in fiscal year 2000 and supports services offered through a network of 4,600 clinics nationwide. Grantees include states, family planning councils, Planned Parenthood affiliates, and other public and private entities that provide family planning services. In 1994 an estimated 4.2 million family planning clients were served by clinics administered by Title X-supported agencies (www.agi-usa.org/pubs/ib16.html). In addition to contraceptive services, Title X clinics provide basic reproductive health care such as screening for breast and cervical cancer; screening for sexually transmitted diseases including human immunodeficiency virus infection; and general health education, counseling, and referrals. Services are provided on a sliding scale based on income, with persons whose incomes are at or below the federal poverty level receiving services at no cost. An estimated 97 percent of the population served by Title X clinics are female, 85 percent are from low-income households, and 60 percent are younger than age 25. Family planning clinics are often an entry point into the health care system for young adults and for low-income persons.
Title X clinics are very important sources of Pap testing for women of reproductive age who are uninsured or covered by Medicaid. According to the 1995 National Survey of Family Growth, Pap tests were obtained in the past year by 61.9 percent of women of reproductive age (ages 15 to 44). Women who were uninsured or who had Medicaid coverage were significantly less likely than privately insured women to have been tested at private doctors’ offices or health maintenance organizations (HMOs) and were significantly more likely to have been tested at Title X and other clinics (Table 9.5).2
Indirect Service Providers
Centers for Medicare and Medicaid Services
Programs administered by the Centers for Medicare and Medicaid Services (CMS; formerly the Health Care Financing Administration [HCFA])
TABLE 9.5 Percentage (95% confidence interval) of Reproductive-Age Women Reporting Pap Testing in the Past Year, by Location of Test and Health Insurance Coverage, National Survey of Family Growth, 1995
include Medicare, Medicaid, the State Children’s Health Insurance Program, and the End-Stage Renal Disease Program. This section focuses on prevention services provided as part of Medicare and Medicaid.
Medicare Medicare enrollment in 2001 was estimated to be 40.3 million individuals, most (86 percent) of whom are age 65 and older. Most Medicare beneficiaries (94 percent) have both hospital insurance and supplemental insurance coverage and report relatively high levels of access to routine care. Having had a routine checkup in the past year, for example, was reported by from 74 to 92 percent of Medicare beneficiaries, according to surveys conducted in all 50 states and the District of Columbia (Health Care Financing Administration, 2000a). Most Medicare beneficiaries obtain care in the traditional fee-for-service system. As of 1999 only 18 percent of Medicare beneficiaries were enrolled in managed care plans. Total outlays for Medicare benefit payments were $210.1 billion in 1998, representing an estimated 13 percent of the total federal budget (Health Care Financing Administration, 2000b).
CMS has several mechanisms in place to ensure the quality of care for the beneficiaries it serves. In 1992, CMS initiated the Health Care Quality Improvement Program to address shortcomings in the health care received by its beneficiaries. Although the quality improvement program was initially focused on acute myocardial infarction, CMS has expanded its quality improvement efforts to include five other clinical priority areas (breast cancer, diabetes, heart failure, pneumonia, and stroke) and reductions in disparities in health care (www.cms.hhs.gov/qio/1a1.asp). Much of CMS’s quality improvement work is carried out by its national network of 53 Quality Improvement Organizations (formerly called peer review organizations or PROs) (http://www.cms.hhs.gov/qio/default.asp). A number of national performance goals, including increased rates of receipt of a screening mammography, have been set to hold CMS accountable for improvements in care pursuant to the Government Performance and Results Act of 1993 (PL 103-62). Medicare managed care organizations are required to adopt the quality, access, and utilization performance measures of the National Committee for Quality Assurance’s Health Plan Employer Data and Information Set (http://www.ncqa.org/Programs/HEDIS/), and CMS is in the process of developing performance measures in its fee-for-service program that serves the majority of beneficiaries. Preliminary results of research in this area suggest that measures of screening for breast cancer by mammography could be applied at the national, small geographic, and large group practice levels (www.hcfa.gov/quality/docs/ffs2-es.htm). The Balanced Budget Act of 1997 (PL 105-33) required CMS to provide comparable information regarding performance in both fee-for-service and managed care settings.
Medicare Screening Benefits Until recently, preventive services were explicitly excluded from Medicare coverage. As it was originally conceived, the Medicare program was to limit its coverage to hospital, physician, and certain other services that are “reasonable and necessary for the diagnosis or treatment of illness or injury or to improve the functioning of a malformed body member” (section 1862 of the Social Security Act). Since the program’s inception in 1965, the U.S. Congress has expanded coverage to screening for breast, cervical, colorectal, and prostate cancer (Table 9.6). The coverage is not entirely consistent with recommendations of the U.S. Department of Health and Human Service’s USPSTF. For example, prostate cancer screening by digital rectal examinations or by detection of tumor markers in serum (e.g., prostate-specific antigen) is a Medicare benefit, but screening is not recommended by USPSTF (U.S. Preventive Services Task Force, 1996).
Some of the out-of-pocket costs associated with cancer screening are defrayed by some sort of supplemental coverage through the Medicaid program, private insurance, or an employer-sponsored benefit program. Medicare beneficiaries who receive their care through managed care plans may obtain additional benefits that include prevention services (Centers for Medicare and Medicaid Services, 2002). Estimates of mammography use among female Medicare beneficiaries are shown in Table 9.7
The Mammography Campaign was launched by CMS in 1995 to improve female beneficiaries’ knowledge of breast cancer screening and awareness of Medicare’s annual screening mammography benefit (before 1998, the benefit covered mammography every 2 years). Educational materials for distribution to beneficiaries have been developed in partnership with NCI’s Office of Communications. Both beneficiaries and providers have been targeted for outreach by CMS’s peer review organizations.
The overall rate of use of colorectal cancer screening and diagnostic services among Medicare beneficiaries is generally low, even though more than 70 percent of new cases of colorectal cancer occur among those age 65 and older (Ries et al., 2000b). The rate of use has not changed significantly since 1995, despite the issuance of a clinical practice guideline in 1997 and the expanded Medicare benefit that became effective in 1998. In 1999, only 14.1 percent of beneficiaries age 50 and older used one or more of the covered services for screening or diagnosis of colorectal cancer. The overall rate of use in 1999 was roughly equivalent to the rate in 1995, when 13.6 percent of beneficiaries used any of these services (U.S. General Accounting Office, 2000). In 1999, the rates of use of colorectal cancer screening tests among beneficiaries age 50 and older were 9.1 percent for the fecal occult blood test, 1.9 percent for sigmoidoscopy, 1.9 percent for flexible sigmoidoscopy, and 3.8 percent for colonoscopy. These low levels of screening occur even though nearly all older Americans report having a regular source of health care and a large majority report receiving routine checkups. In
TABLE 9.6 Coverage for Cancer Screening Tests Under Original Medicare Plan, Centers for Medicare and Medicaid Services
|
|
Extent of Coverage |
||||
|
Cancer |
Test |
Individuals Covered |
Test Frequency |
Coinsurance (percent) |
Deductiblea |
|
Breast |
Mammogramb |
Women age 40 and older |
Annual |
20 |
None |
|
Women ages 35 to 39 |
One-time baseline exam |
20 |
None |
||
|
|
Clinical breast exam |
All women |
Every 2 years |
20 |
None |
|
Cervical |
Pap test |
All women |
Every 2 years, annual for high-risk women |
None for lab, 20 for collection |
None |
|
|
Pelvic exam |
All women |
Every 2 years, annual for high-risk women |
20 |
None |
|
Prostate |
Digital rectal exam |
Men age 50 and older |
Annual |
20 |
Yes |
|
|
Prostate-specific antigen (PSA) |
Men age 50 and older |
Annual |
None |
None |
|
Colorectal |
Colonoscopy |
Individuals age 50 and older; at high risk, no minimum age |
Every 10 years, but not within 4 years of a screening flexible sigmoidoscopy. Every 2 years for high-risk individuals |
20c |
Yes |
|
|
Fecal occult blood test |
Individuals age 50 and older |
Annual |
None |
None |
|
|
Flexible sigmoidos-copy |
Individuals age 50 and older |
Every 4 years |
20c |
Yes |
|
|
Barium enema |
Alternative to sigmoidoscopy or colonoscopy |
|
20 |
Yes |
|
aThe Part B deductible is $100 per year. bMedicare also covers new digital technologies for mammogram screening. cBeneficiary pays 25% of the Medicare-approved amount if sigmoidoscopy or colonoscopy is performed in an ambulatory surgical center or hospital outpatient department. SOURCE: Centers for Medicare and Medicaid Services (2002). |
|||||
TABLE 9.7 Mammography Use Within Past 2 Years
|
|
Survey-Based Estimates 1997 (Women Age 65 and Older)% (95% confidence interval) |
Claims-Based Estimate 1997–1999 (Women Ages 52 to 69)% |
|
Rate in median state |
70 |
56 |
|
Rate range |
57–83 |
47–66 |
|
Alabama |
76 (70–81) |
55 |
|
Alaska |
72 (57–87) |
52 |
|
Arizona |
76 (69–83) |
57 |
|
Arkansas |
57 (51–64) |
50 |
|
California |
78 (74–83) |
54 |
|
Colorado |
72 (65–79) |
55 |
|
Connecticut |
75 (69–81) |
60 |
|
Delaware |
74 (69–80) |
59 |
|
District of Columbia |
82 (75–89) |
52 |
|
Florida |
80 (76–83) |
62 |
|
Georgia |
72 (65–79) |
52 |
|
Hawaii |
79 (73–85) |
52 |
|
Idaho |
63 (58–67) |
53 |
|
Illinois |
67 (61–73) |
54 |
|
Indiana |
58 (51–65) |
54 |
|
Iowa |
61 (57–66) |
60 |
|
Kansas |
68 (62–74) |
58 |
|
Kentucky |
66 (62–70) |
53 |
|
Louisiana |
70 (63–78) |
50 |
|
Maine |
76 (70–83) |
66 |
|
Maryland |
76 (70–81) |
58 |
|
Massachusetts |
75 (68–82) |
63 |
|
Michigan |
77 (72–82) |
64 |
|
Minnesota |
68 (64–72) |
61 |
|
Mississippi |
62 (56–69) |
47 |
|
Missouri |
68 (61–74) |
54 |
|
Montana |
71 (65–77) |
59 |
|
Nebraska |
60 (55–66) |
56 |
|
Nevada |
64 (50–77) |
50 |
|
New Hampshire |
75 (67–82) |
63 |
|
New Jersey |
69 (63–75) |
50 |
|
New Mexico |
67 (60–74) |
51 |
|
New York |
75 (70–80) |
56 |
|
North Carolina |
72 (67–76) |
57 |
|
North Dakota |
71 (65–77) |
64 |
|
Ohio |
69 (64–75) |
56 |
|
Oklahoma |
59 (52–65) |
49 |
|
Oregon |
77 (73–82) |
59 |
|
Pennsylvania |
70 (65–75) |
56 |
|
Rhode Island |
83 (78–88) |
58 |
|
South Carolina |
76 (71–81) |
55 |
|
South Dakota |
70 (64–75) |
57 |
|
Tennessee |
69 (64–74) |
53 |
|
Texas |
65 (58–72) |
51 |
|
|
Survey-Based Estimates 1997 (Women Age 65 and Older)% (95% confidence interval) |
Claims-Based Estimate 1997–1999 (Women Ages 52 to 69)% |
|
Utah |
70 (63–77) |
55 |
|
Vermont |
70 (65–76) |
63 |
|
Virginia |
68 (62–75) |
55 |
|
Washington |
69 (64–74) |
59 |
|
West Virginia |
66 (61–71) |
55 |
|
Wisconsin |
69 (63–75) |
60 |
|
Wyoming |
70 (64–76) |
55 |
|
SOURCES: Jencks et al. (2000) and Health Care Financing Administration, state-specific estimates (2000a). |
||
general, higher rates of colorectal screening test use were seen among women than among men, higher rates were seen among whites than among members of racial or ethnic minority groups, and higher rates were seen among beneficiaries ages 70 to 79 than among younger and older beneficiaries (Table 9.8).
Uncertainty remains regarding the benefits of screening for breast cancer at older ages. Resolving these uncertainties is of paramount importance to the Medicare program because nearly half (47 percent) of beneficiaries are age 75 and older.
Smoking Cessation Benefits Within the Medicare Program The rate of current smoking among Medicare beneficiaries age 65 and older varies markedly by state, with the range being from 3.7 percent in Utah to 20.6 in Nevada. Estimates of the share of smokers who have attempted to quit smoking range from 16.7 percent in Arizona to 59.3 percent in Alabama (Health Care Financing Administration, 2000a). According to one estimate, a person who smokes more than 20 cigarettes a day and who quits at age 65 can expect to increase his or her life expectancy by 2 to 3 years (Sachs, 1986). Even though evidence supports the health and quality-of-life benefits of smoking cessation at older ages, Medicare does not provide coverage for smoking cessation programs or products. As part of CMS’s Healthy Aging Initiative, a literature review of the evidence of the effectiveness of interventions to promote smoking cessation in the Medicare population has been completed (DHHS, HCFA, undated). In addition, a demonstration program testing the effects of various benefit enhancements on smoking cessation is in progress. The three benefit options being compared with usual care (smoking cessation information) in the seven-state Medicare Stop Smoking Program are (www.hcfa.gov/healthyaging/1b.htm):
TABLE 9.8 Medicare Beneficiaries’ Rates of Use (Percent) of Tests for Colorectal Cancer Screening and Diagnostic Services, 1995–1999a
-
reimbursement for provider counseling only,
-
reimbursement for provider counseling and Food and Drug Administration-approved prescription or nicotine replacement pharmacotherapy, and
-
a telephone counseling quit line and reimbursement for nicotine replacement therapy.
The program commenced in the summer of 2001 and is expected to be completed in 2003.
Medicaid Medicaid is a joint federal and state program that provides essential medical and medically related services to the nation’s most vulnerable populations (HCFA, 2000d). Three types of health protection are available through Medicaid:
-
health insurance for low-income families with children and people with disabilities;
-
long-term care for older Americans and individuals with disabilities; and
-
supplemental coverage for low-income Medicare beneficiaries for services not covered by Medicare and Medicare premiums, deductibles, and cost sharing.3
Each state establishes its own eligibility standards, benefits package, payment rates, and program administration under broad federal guidelines. Many variations exist among state Medicaid programs regarding not only which services are covered but also the amount, duration, and scope of services. Each state Medicaid program must cover “mandatory services” identified by statute and have the discretion to cover additional “optional services.” Early and Periodic Screening, Diagnosis, and Treatment services are mandatory for individuals under age 21, whereas screening and prevention services are optional for older enrollees (Health Care Financing Administration, 2000d).
The population enrolled in the Medicaid program is dynamic, with individuals entering and leaving the program at fairly high rates, but at any point in time an estimated 12 percent of the U.S. population is enrolled, with most of these individuals consisting of low-income women and children. In 1998, Medicaid enrollment was 41.4 million, with children under age 21 making up 54 percent of Medicaid enrollment (HCFA, 2000d). In 1998 it was estimated that one in five U.S. children was served by the Medicaid program.4 Total outlays for Medicaid medical assistance payments were $96.4 billion in 1998.
Throughout the 1990s states significantly expanded the enrollments in Medicaid managed care programs.5 By 1998, more than half (54 percent) of the Medicaid population was enrolled in some type of managed care plan. Medicaid managed care penetration varies greatly by state: 2 states (Alaska, Wyoming) have no beneficiaries enrolled in managed care plans, whereas 12 states (Arizona, Colorado, Delaware, Georgia, Hawaii, Iowa, Montana, New Mexico, Oregon, Tennessee, Utah, and Washington) have more than 75 percent of their beneficiaries enrolled in such plans. As of 1998, 35 states and the District of Columbia operated Freedom of Choice
waivers [84 Section 1915(b)] to mandatorily enroll beneficiaries in managed care programs, provide additional services via the savings produced from managed care, or create a “carve-out” system for the delivery of specialty care (e.g., behavioral health).6
Smoking rates tend to be higher among the Medicaid population, and 5 million or more adult smokers were estimated to be covered by the program in 1999 (Schauffler et al., 2001a). Only half of the states, however, cover even one smoking cessation treatment for their Medicaid recipients, according to a review of Medicaid coverage for treatments for tobacco dependence in 1998 (Schauffler et al., 2001a). State Medicaid programs were most likely to cover pharmacotherapy for tobacco dependence, including bupropion, the nicotine patch, nicotine gum, and a nicotine nasal spray (Table 9.9). Six states (Delaware, Maine, Maryland, Minnesota, New Mexico, and Oregon) offered comprehensive Medicaid benefits for the treatment of tobacco dependence (all forms of nicotine replacement therapy, bupropion, and both group and individual counseling). Even in states whose Medicaid programs did provide coverage for treatments for tobacco dependence, the programs made little effort to inform smokers of the availability of these benefits or how to access and use them. Only four state Medicaid programs (those in Arizona, Maine, Rhode Island, and Wyoming) reported offering any special programs designed to assist women who are pregnant or breast-feeding to quit smoking, despite the strong evidence that the cessation of smoking during pregnancy reduces the incidence of low birth weight.
Cancer screening rates among Medicaid beneficiaries appear to be similar to those among privately insured individuals, according to recent studies (Potosky et al., 1998; Hewitt et al., 2002).
Office of Management and Budget
In 1997, a presidential executive order established smoke-free environments for the more than 1.8 million civilian federal employees and members of the public visiting or using federal facilities. In 2001, federal departments and agencies were directed to establish a policy that provides up to 4 hours of excused absence each year, without a loss of pay or a charge to leave, for participation in preventive health screenings. Agencies were also directed to develop or expand programs offered at the worksite to help employees understand their risks for disease, obtain preventive health services, and make healthy lifestyle choices. The Office of Personnel Management has issued guidance for a model smoking cessation program and is
TABLE 9.9 Medicaid Program Coverage of Pharmacotherapy and Counseling—United States,a 2000
|
|
Over-the-counter medication |
Prescription Medication |
||||
|
State |
Any treatment |
Gum |
Patch |
Any |
Spray |
Inhaler |
|
Arizona |
•b |
• |
• |
|
||
|
Arkansas |
• |
|
• |
|
||
|
Californiac |
• |
• |
• |
• |
• |
• |
|
Coloradoc |
• |
• |
• |
• |
• |
• |
|
Delawarec |
• |
• |
• |
• |
• |
• |
|
District of Columbia |
• |
|
• |
• |
|
|
|
Florida |
• |
• |
• |
• |
|
|
|
Hawaii |
• |
|
• |
• |
• |
|
|
Illinoisc |
• |
• |
• |
• |
• |
• |
|
Indianac |
• |
• |
• |
• |
• |
• |
|
Kansas |
• |
|
• |
• |
|
|
|
Louisiana |
• |
|
• |
• |
• |
|
|
Mainec |
• |
• |
• |
• |
• |
• |
|
Maryland |
• |
|
• |
• |
• |
|
|
Massachusetts |
• |
|
||||
|
Michigan |
• |
• |
• |
• |
|
|
|
Minnesotac |
• |
• |
• |
• |
• |
• |
|
Montana |
• |
• |
• |
• |
|
|
|
Nevadac |
• |
• |
• |
• |
• |
• |
|
New Hampshirec |
• |
• |
• |
• |
• |
• |
|
New Jerseyc |
• |
• |
• |
• |
• |
• |
|
New Mexicoc |
• |
• |
• |
• |
• |
• |
|
New Yorkc |
• |
• |
• |
• |
• |
• |
|
North Carolina |
• |
|
• |
• |
• |
|
|
North Dakota |
• |
• |
• |
• |
|
|
|
Ohio |
• |
• |
• |
• |
|
• |
|
Oklahoma |
• |
|
• |
|
||
|
Oregond |
• |
• |
• |
• |
• |
• |
|
Rhode Island |
• |
|
||||
|
Texasc |
• |
• |
• |
• |
• |
• |
|
Vermont |
• |
• |
• |
• |
• |
• |
|
Virginia |
• |
|
• |
• |
• |
|
|
West Virginiac |
• |
• |
• |
• |
• |
• |
|
Wisconsin |
• |
|
• |
• |
• |
|
|
No. states in 2000 |
34 |
22 |
23 |
31 |
23 |
23 |
|
% states in 2000 |
67 |
43 |
45 |
61 |
45 |
45 |
|
aCovered treatment. bStates offering no coverage were Alabama, Alaska, Connecticut, Georgia, Idaho, Iowa, Kentucky, Mississippi, Missouri, Nebraska, Pennsylvania, South Carolina, South Dakota, Tennessee, Utah, Washington, and Wyoming. cOffered all pharmacotherapy recommended in Public Health Service Clinical Practice Guideline for Treating Tobacco Use and Dependence. dOffered all treatments. eCovers pregnant women only. SOURCE: Adapted from CDC, 2001e. |
||||||
|
Prescription Medication |
Counseling |
|||||
|
Zyban |
Wellbutrin |
Bupropion |
Any |
Group |
Individual |
Telephone |
|
|
• |
• |
• |
|
||
|
• |
• |
|
||||
|
• |
• |
• |
|
|||
|
• |
• |
• |
|
|||
|
• |
• |
• |
|
|||
|
• |
• |
• |
|
|||
|
• |
|
|||||
|
• |
• |
• |
|
|||
|
• |
• |
• |
|
|||
|
• |
• |
• |
• |
|
• |
|
|
• |
• |
• |
• |
• |
• |
|
|
• |
• |
• |
|
|||
|
• |
• |
• |
• |
• |
• |
|
|
• |
• |
• |
•e |
•e |
•e |
|
|
|
• |
• |
• |
|
||
|
• |
• |
|
||||
|
• |
• |
• |
• |
• |
• |
|
|
• |
|
|||||
|
• |
• |
• |
|
|||
|
• |
• |
• |
• |
• |
• |
|
|
• |
• |
• |
|
|||
|
• |
• |
• |
•e |
•e |
•e |
•e |
|
• |
• |
• |
|
|||
|
• |
• |
• |
|
|||
|
• |
• |
• |
|
|||
|
• |
• |
• |
|
|||
|
• |
• |
• |
|
|||
|
• |
• |
• |
• |
• |
• |
• |
|
|
• |
• |
• |
|
||
|
• |
• |
• |
|
|||
|
• |
• |
• |
|
|||
|
• |
• |
• |
|
|||
|
• |
• |
• |
• |
|
• |
• |
|
• |
• |
• |
• |
|
• |
|
|
31 |
29 |
27 |
13 |
10 |
13 |
3 |
|
61 |
57 |
53 |
26 |
20 |
26 |
6 |
compiling a list of best practices to be shared with agencies. Agencies can pay the costs incurred by employees participating in agency-authorized smoking cessation programs, including payment for nicotine replacement therapy when it is purchased as part of an agency’s smoking cessation program (www.opm.gov/ehs).
SUMMARY AND CONCLUSIONS
The federal government provides many opportunities to further cancer prevention and early detection by promulgating national goals and objectives, issuing clinical guidelines, disseminating information, carrying out monitoring and surveillance activities, facilitating statewide program planning and evaluation, and providing or paying for services.
Explicit national cancer-related goals and objectives have been set as part of the Healthy People 2010 initiative (US DHHS and Office of Disease Prevention and Health Promotion, 2000), and efforts are under way to chart the nation’s progress toward those goals. Federally sponsored evidence-based guidelines for clinical and community practice provide clinicians and public health providers with the information they need to achieve these goals. NCI is the lead federal agency in the dissemination of cancer-related information to clinicians, consumers, and the public health community through a number of channels including its telephone Cancer Information Service, its websites, and PDQ, a comprehensive cancer information database. Tracking the successes of these and other efforts in reaching cancer prevention and early detection goals often relies on federally sponsored surveys and surveillance systems that assess the prevalence of risk behaviors, levels of access to services, and health behaviors among the general and selected members of the U.S. population. Federal safety net providers including Community and Migrant Health Centers and Title X family planning clinics are key to closing the gap in service use and, ultimately, in reducing the unequal burden of cancer observed among poor and disadvantaged populations.
Although some federal programs are at the forefront of promoting effective cancer prevention and early detection interventions, there appears to be much room for improvement. In particular, policies are needed to improve coverage of evidence-based smoking cessation interventions within the Medicare and Medicaid programs. Such policies could greatly reduce the burden of cancer. In addition, the significant variations in the rates of use of screening services among beneficiaries served by the Medicare and VHA programs suggest that interventions are needed to improve rates of adherence to evidence-based guidelines.


