
4
Improving the Quantity and Quality of Coastal Reference Frame Data
The costs associated with the acquisition of data (in particular reference frame data) dominate mapping and charting activities. The presentations and submissions received by the committee repeatedly indicated that the present mapping and charting database is inadequate for applications ranging from safety of navigation to coastal resource management. While the nation will benefit from the collection of additional coastal zone data of many types, the need for more fundamental reference frame data—topography and particularly bathymetry—was consistently cited as having the highest priority. In 1999 the Coastal Services Center (CSC) surveyed 270 offices representing state resource and environmental protection agencies, coastal zone management programs, Sea Grant programs, National Estuarine Research Reserves, National Estuary Programs, and National Marine Sanctuaries (CSC, 1999). The issues represented by these coastal zone groups included public access to the coast, dredging and port issues, land use and land-use changes, coastal erosion and accretion, planning and response for oil and other hazardous material spills, point and nonpoint source pollution, habitat mapping, fish and shellfish stocks, and watershed management. The survey concluded that, out of 29 possible priority datasets, nearshore bathymetry ranked second highest, after high-resolution aerial photography. Although the 2002 CSC survey results were not published prior to completion of this report, the draft report indicated that 83 percent of the respondents require nearshore bathymetry, and of 37 possible priority datasets, bathymetry (when combining estuarine, nearshore, and offshore) ranked number one in use and
demand (CSC, 2002). These conclusions are neither unexpected nor novel—earlier assessments have consistently reached the same conclusions:
“The greatest information needs of the users in the states, industry, and academia are for bathymetry, imagery, and seabed characterization” (NRC, 1992; p. 2).
“The nation has a large and growing backlog of requests for new surveys and charts. At the present level of effort, the backlog cannot be reduced” (NRC, 1994a; p. 66).
“NOAA should accelerate the current timetable of approximately 15 to 20 years to reduce the current survey backlog. The backlog prevents NOAA from making progress on surveys and charts for the rest of the exclusive economic zone (EEZ)” (USDOT, 1999; p. 103).
Nearly half the depths published on current charts were measured using lead line techniques over a sparse grid prior to 1940, and one-third of the national shoreline has yet to be mapped. Given limited resources, the National Oceanic and Atmospheric Administration (NOAA) must allocate priority for survey to “critical areas.” These areas include only primary coastal shipping lanes and approaches to major U.S. ports and largely exclude the extensive nearshore areas used by fishing fleets, oilfield service vessels, and other commercial, government, academic, and recreational vessels. Also excluded from these surveys are most of the vast coastal areas managed by the nation’s primary coastal zone managers, as well as many of the areas containing “essential fish habitat” that require mandatory mapping under the Magnuson-Stevens Fishery Conservation and Management Act. The public cost for inadequate bathymetric data becomes staggering when all factors are included (see Box 4.1).
SHALLOW BATHYMETRY—THE MOST CRITICAL GAP
There is a clear need for an expanded effort in bathymetric data acquisition in the coastal zone. In deeper waters (greater than about 10 meters) the technology to collect these data is available and relatively efficient (see Chapter 2). Accordingly, if a national commitment to accomplishing this deeper mapping exists, it should be straightforward to establish an overarching structure to ensure that it is done efficiently and effectively. The committee is confident that the approaches outlined here could form the basis for effective national planning as well as cost savings that could be directed to additional data collection. The real challenge and
|
BOX 4.1
|
impediment, however, is the acquisition of high-quality bathymetry in the shallowest regions—the surf zone, the intertidal zone between low water and Mean Sea Level (MSL), and over bars and shoals at river mouths and tidal inlets. Although the U.S. Geological Survey (USGS) and NOAA datasets function essentially as national cartographic industry standards and, with tens of millions of users, are the two most widely used map/ chart series available in the United States, it is clear that it is not possible to create a single, seamless database combining the two without considerable effort. One very important reason for this is that the surface area between Mean Lower Low Water (MLLW) and MSL is not routinely mapped by either agency. Along shorelines of low relief (the most common
|
case) this gap may extend horizontally for many meters (and in extreme cases can extend for hundreds or thousands of meters) and may extend vertically for a meter or more.
The problem is not just one of mandate, but rather the real technological and logistical difficulty of collecting high-quality data in very shallow water regions. The most comprehensive modern bathymetric data being collected in shallow water are currently acquired with multibeam sonar from a survey launch. Standard multibeam sonar acoustic techniques for collecting high-resolution bathymetric data map a swath of seafloor over a fixed angle (typically 120° to 150° or 3.4 to 7.4 times the water depth). The deeper the water, the greater the area covered. As the
water shoals, the seafloor area sampled by the echo sounder decreases, making surveying with multibeam sonar an inherently inefficient process in very shallow water (in 2 meters of water the swath from a 150° multibeam sonar would be less than 15 meters wide—using typical survey protocols, a multibeam survey in this water depth would cover a swath only about 6 meters wide on each survey line). Survey launches are small (typically 7 to 10 meters long), manned, and generally constrained to daylight hours and good sea conditions. As a result, the actual productive survey time for a survey launch is generally less than 10 hours in a 24-hour period, and such surveys often progress very slowly in shallow waters where navigational hazards may be present.
In some areas, problems of survey efficiency and the dangers of operating a vessel in very shallow waters can be overcome through the use of airborne Light Detection and Ranging (LIDAR) systems. While current bathymetric LIDAR systems do not achieve the same data density or level of resolution as multibeam acoustic systems in similar water depths, they can rapidly provide a relatively complete and accurate picture of seafloor bathymetry. They can record data in up to 50 to 60 meters of water where water clarity permits, with a swath width that is unchanged by water depth (typically about 200 meters). Water clarity is the critical limiting factor in the applicability of bathymetric LIDAR, and high water turbidity precludes the efficient use of bathymetric LIDAR in many regions of the coastal United States.
Thus, acoustic systems are difficult to operate in the very shallowest regions of the coast, and bathymetric LIDAR systems, which can be operated safely from the air, may have difficulty in regions with high turbidity. Faced with this dilemma, the committee explored what technologies may aid in mapping the “shallowest of the shallow.”
STRATEGIES FOR PROVIDING SHALLOW BATHYMETRY
To respond to the need for comprehensive and accurate data in shallow nearshore waters and along beaches, new and improved mapping and data acquisition technologies are being developed. Although research activities are attempting to increase the resolution and range of acoustic systems, in shallow water the physics of sound transmission in water is a fundamental limitation. Sweep systems that use an array of vertical-incidence transducers rigged on large booms to either side of the survey vessel may also be efficient in shallow water but need very calm conditions to be effective. Incremental advances in swath width may be gained by new interferometric and synthetic aperture sonars. These sonars provide excellent sidescan sonar data, but with some compromise of the fundamental framework bathymetric data. Nonetheless, these systems
have proven to be a useful means of efficient geologic mapping in some shallow coastal areas (Denny and Danforth, 2002). Since these systems are also deployed from small vessels, they are subject to the same operational dangers that multibeam systems face in the surf zone.
The following is a discussion of other technologies and approaches that may help address the serious problem of collecting bathymetric and topographic data in the very shallow coastal zone. These technologies and approaches include the deployment of sonar systems on new platforms being developed to operate more safely and efficiently in shallow water (Autonomous Underwater Vehicles [AUVs] and Unmanned Underwater Vehicles [UUVs]), a new generation of LIDAR systems, innovative vehicles that drive through the surf zone, and the collection of “opportunistic” data with the help of the general public.
AUV-Deployed Sonars
An alternative to launches in turbid waters where bathymetric LIDAR is impossible is the use of AUV technology as the platform for sonar and imagery sensors. With the right type of AUVs, enhanced endurance and the ability to operate in a higher sea state can dramatically improve the productive survey time. Autonomous semi-submersible vehicles (e.g., Figure 4.1) have shown impressive productivity improvements during demonstrations. These systems operate just below the water surface to substantially increase the operational weather window but have a mast and antennas that remain above the water surface.
Smaller and more economical vehicles of this type would theoretically be able to operate for up to 72 hours at four knots before refueling. Further, multiple units can be operated simultaneously from the same mother ship, thus substantially increasing productivity. Each would be able to collect multibeam bathymetry, co-located imagery, and sidescan sonar data. Use of an Automatic Identification System (AIS) would allow the autonomous vessels to be plotted in real time on an Electronic Chart Display and Information System (ECDIS) with a radar overlay to assist in collision avoidance. Another AUV technology that may contribute to future survey efforts is the Solar Autonomous Underwater Vehicle (SAUV). The top of the SAUV hull is a solar panel that generates power for both sensors and propulsion (see Figure 4.2). Several SAUVs have been constructed, and they have demonstrated the ability to operate for more than a month at a time. Improvements in AUV technology will undoubtedly provide additional opportunities for their application to coastal zone surveying, where they may prove to be an effective and efficient means of collecting data without exposing field personnel to dangerous launch operations.
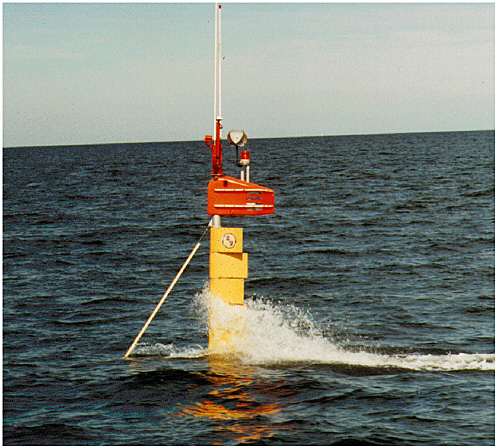
FIGURE 4.1 Mast of ORCA AUV underway while surveying. The ORCA is diesel powered, with a surface mast that allows precise positioning using differential Global Positioning System (GPS) information. Image courtesy of C&C Technologies.
New-Generation LIDARs
Airborne bathymetric LIDAR will always be limited by water clarity. However, new developments in integrated airborne/terrestrial LIDAR offer hope for providing datasets that will greatly facilitate the integration of onshore and offshore data. These new systems will simultaneously collect data from airborne bathymetric LIDAR, airborne topographic LIDAR, digital imaging systems, and perhaps even a hyperspectral scanner. All systems will be navigated using the same satellite-based system to provide a common vertical and horizontal reference frame. In one version of these new generations of LIDAR systems, the U.S. Army Corps of Engineers (USACE) Compact Hydrographic Airborne Raid Total Survey
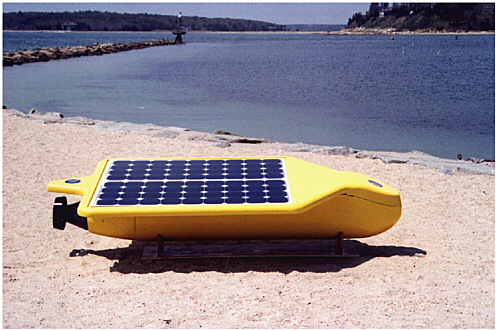
FIGURE 4.2 Solar-powered AUV. Image courtesy of the Autonomous Undersea Systems Institute.
(CHARTS) system, the bathymetric LIDAR component operates at a rate of 1,000 Hz, while the topographic LIDAR component operates at 10,000 Hz. The system is compact and easily fits onto most photogrammetric aircraft of opportunity. When linked with the Vdatum tools described earlier, these new systems will provide data that are ideally suited to address the “data gap” at the land-sea interface (see Figure 4.3). Finally, while water clarity will always be an issue with bathymetric LIDARs, the careful planning of surveys with respect to season and tidal state may help mitigate this problem. Again, with a national structure that allows coordination of efforts, it should be possible to maximize LIDAR coverage.
Innovative Surf Zone Vehicles
Difficulties in using acoustic and other remote sensing technologies in very turbid water and in the surf zone have led investigators to develop a variety of bottom-following devices that are tracked by instruments to provide instantaneous measurements of bottom elevation. Early devices included a variety of sea sleds that were towed from the shoreline to outside the surf zone. Typically, these measured the elevation of the sled
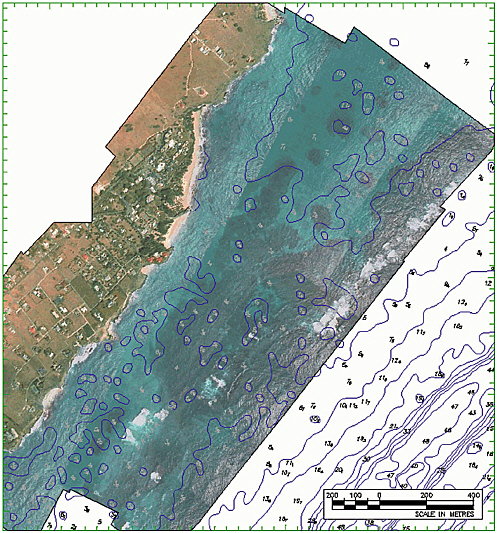
FIGURE 4.3 Airborne LIDAR bathymetry registered with rectified digital imagery. SOURCE: Quinn (2000).
base using a surveyor’s level and a corresponding rod on a mast, while determining the sled’s horizontal position using either a measured cable or triangulation. With the advent of total surveying stations, all that is needed is a reflecting prism mounted on the top of the mast to obtain its spatial coordinates.
Self-propelled vehicles to eliminate the need for towing were developed in the 1970s (Birkemeier and Mason, 1984), and with the advent of high-resolution Differential Global Positioning System (DGPS), continuous
movement of the vehicle significantly reduced the cost and time of nearshore surveys. These types of vehicles have been used extensively for repetitive surveys along the North Carolina coast and also for a few preproject surveys (particularly for sand budget projects of the USACE).
Opportunistic Mapping
Historically, government agencies charged with the collection of data and the generation of mapping and charting products have been very reluctant to accept data from external sources, with government liability for the accuracy of navigation information often cited as the greatest obstacle to accepting third-party information. Incorporating data from sources other than well-qualified private industry partners remains problematic for nearshore hydrographic data. There are, however, numerous examples where public activities provide valuable feedback and, in some cases, data collection. The U.S. Power Squadron and the U.S. Coast Guard (USCG) Auxiliary provide quality assurance of charts and aids to navigation by noting discrepancies in charted versus observed nautical information. Commercial mariners routinely provide weather observations and, through NOAA’s Voluntary Observing Ship Program, commercial ships are equipped to take bathythermograph observations. The members of the International Seakeepers Society equip their yachts with sophisticated observation modules capable of measuring several meteorological and near-surface water column parameters.
A potentially viable means for collecting high-quality bathymetric and other data may be by using a certified “black box” approach, where a sealed and calibrated data collection system is installed onboard vessels of opportunity. These systems record the parameters of interest (e.g., depth) together with DGPS-based position information. The recorded data are then downloaded to a central repository for quality control and processing.
TERRESTRIAL SATELLITE IMAGING
The coastal zone has a large and important terrestrial component. While mapping challenges for the “dry” regions of the coastal zone are less severe than those for water-covered areas, new developments in remote sensing techniques are rapidly improving the ability to document this important region. The recent introduction of high resolution commercial satellite imaging systems such as IKONOS (1-meter and 4-meter resolution, depending on channels used) and QuickBird (0.6-meter resolution) provide an important new data source for coastal mapping. In addition to offering high resolution and multispectral data, these systems
provide a short revisit time (around 3 days) and have stereo mapping capability. In particular, stereo pairs can be formed in near real time due to a very flexible pointing mechanism. These characteristics make these new high-resolution satellite imagery systems very attractive for monitoring and change detection as well as coastal mapping.
If ground control is used, IKONOS images are capable of producing mapping products with meter position accuracy for general land features and submeter accuracy for objects that can be measured at subpixel level (Di et al., 2003). Although the sensor model is not provided to the users, so-called rational function coefficients are supplied along with stereo imagery to allow generation of Digital Elevation Models (DEMs), orthoimages, and other features. Recent results of tests and experiments to use IKONOS images for coastal mapping have demonstrated the potential to produce shorelines with about 1-meter horizontal and 2-meter vertical accuracy (Li et al., 2002). Since a satellite system has a prescribed orbit, it is impractical to require that the satellite images be taken at the time of a local MLLW or Mean High Water (MHW) level. Shorelines extracted from IKONOS images are therefore always instantaneous shorelines. In conjunction with an accurate Vdatum model, however, instantaneous shorelines can be converted to more traditional tidal datum-based or orthometric shorelines. Accordingly, high-resolution satellite imagery appears to have considerable potential for augmenting or replacing aerial photogrammetry in coastal mapping. There are numerous online resources already available that provide access to aerial- or space-derived imagery. These include the USACE Topographic Engineering Center’s Commercial and Civil Imagery Office,1 the USGS Global Land Information System,2 and the Microsoft TerraServer web site.3


