
3
Hydrology and Water Management
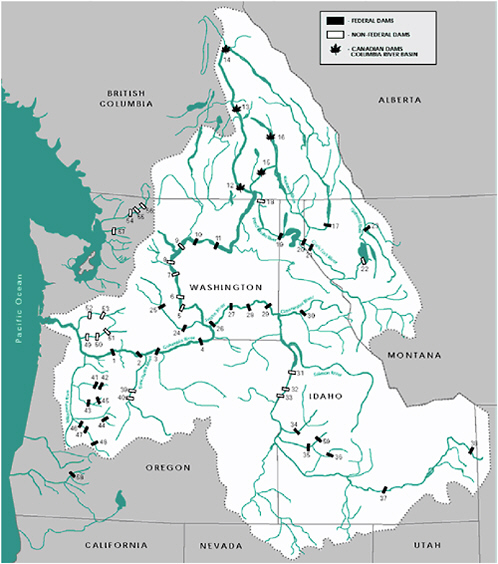
Columbia River water flows have generated enormous social and economic benefits. These uses include hydropower generation, flood control, instream flows for fish and habitat, irrigation, commercial and subsistence fishing, navigation, and water for municipalities and industries. A vast number of jurisdictions and individuals use Columbia River water, including seven U.S. states, the Canadian province of British Columbia, and several Indian reservations (Figure 3-1). The geographical focus in this study, however, is on the mainstem Columbia River in the State of Washington.
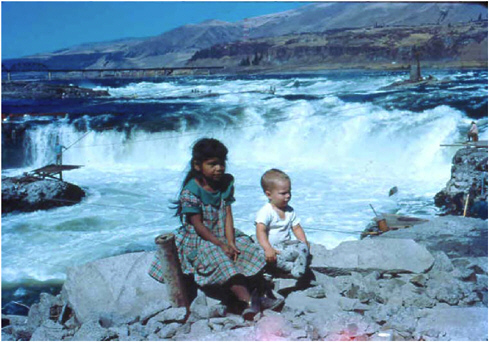
August 1955. Fishing at Celilo Falls, where The Dalles dam was later constructed. In the background, an American Indian prepares to take a fish out of the net from a scaffold. Photo courtesy of Ernest Smerdon.
As explained in Chapter 2, there are many large dams (storage and run-of-the-river) and reservoirs along the river that compose the Federal Columbia River Power System (FCRPS). The Columbia River dams in Washington State are owned and operated by federal entities and by state public utility districts. Their daily operations are designed to meet the needs of many sectors, the most important being flood control, hydroelectric power generation, and instream flows. Like most regions of the western United States, irrigated agriculture is the largest consumptive water user in the region. Irrigated agriculture along the Columbia River in the State of Washington consists of one very large withdrawal—the Columbia Basin Project—and a large number of small (relative to the Columbia’s flows) withdrawals by individual irrigators. These structures and uses have affected stream flows, water quality, and water temperature. This chapter examines twentieth-century changes in Columbia basin hydrology and the annual hydrograph, the current and prospective future picture of water withdrawals (this study’s primary focus), water quality, and changes in water temperature and related prospective future changes in basin climate.1
This study focuses on the implications of water withdrawals from the mainstem Columbia River for salmon survival. An analysis of the relative impacts of mainstem surface and groundwater withdrawals in comparison to the hydrological impacts of Columbia River dam and reservoir construction and operations was beyond the scope of this study. This report focuses on mainstem water withdrawals because this topic was central to the committee’s Statement of Tasks, not because of the relative
|
MAJOR NORTHWEST DAMS |
||
|
1. BONNEVILLE Columbia River, USACE |
21. NOXON, RAPIDS Clark Fork River, WWP |
41. BIG CLIFF N. Santiam River, USACE |
|
2. THE DALLES Columbia River, USACE |
22. KERR Flathead River, MPC |
42. DETROIT N. Santiam River, USACE |
|
3. JOHN DAY Columbia River, USACE |
23. HUNGRY HORSE Flathead River, USBR |
43. FOSTER S. Santiam River, USACE |
|
4. McNARY Columbia River, USACE |
24. CHANDLER Yakima River, USBR |
44. COUGAR McKenzie River, USACE |
|
5. PRIEST RAPIDS Columbia River, Grant Co. PUD |
25. ROZA Yakima River, USBR |
45. GREEN PETER M. Santiam River, USACE |
|
6. WANAPUM Columbia River, Grant Co. PUD |
26. ICE HARBOR Snake River, USACE |
46. DEXTER Willamette River, USACE |
|
7. ROCK ISLAND Columbia River, Chelan Co. PUD |
27. LOWER MONUMENTAL Snake River, USACE |
47. LOOKOUT POINT Willamette River, USACE |
|
8. ROCKY REACH Columbia River, Chelan Co. PUD |
28. LITTLE GOOSE Snake River, USACE |
48. HILLS CREEK Willamette River, USACE |
|
9. WELLS Columbia River, Douglas Co. PUD |
29. LOWER GRANITE Snake River, USACE |
49. MERWIN Lewis River, PP&L |
|
10. CHIEF JOSEPH Columbia River, USACE |
30. DWORSHAK N.F. Clearwater River, USACE |
50. YALE Lewis River, PP&L |
|
11. GRAND COULEE Columbia River, USBR |
31. HELLS CANYON Snake River, IP |
51. SWIFT Lewis River, PP&L |
|
12. KEENLEYSIDE Columbia River, BC Hydro |
32. OXBOW Snake River, IP |
52. MAYFIELD Cowlitz River, TCL |
|
13. REVELSTOKE Columbia River, BC Hydro |
33. BROWNLEE Snake River, IP |
53. MOSSYROCK Cowlitz River, TCL |
|
14. MICA Columbia River, BC Hydro |
34. BLACK CANYON Payette River, USBR |
54. GORGE Skagit River, SCL |
|
15. CORRA LINN Kootenay River, W. Kootenay |
35. BOISE RIVER DIVERSION Boise River, USBR |
55. DIABLO Skagit River, SCL |
|
16. DUNCAN Duncan River, BC Hydro |
36. ANDERSON RANCH Boise River, USBR |
56. ROSS Skagit River, SCL |
|
17. LIBBY Kootenai River, USACE |
37. MINIDOKA Snake River, USBR |
57. CULMBACK Sultan River, Snohomish Co. PUD |
|
18. BOUNDARY Pend Oreille River, SCL |
38. PALISADES Snake River, USBR |
58. LOST CREEK Rogue River, USACE |
|
19. ALBENI FALLS Pend Oreille River, USACE |
39. PELTON Deschutes River, PGE |
59. LUCKY PEAK Boise River, USACE |
|
20. CABINET GORGE Clark Fork River, WWP |
40. ROUND BUTTE Deschutes River, PGE |
60. GREEN SPRINGS Emigrant Creek, USBR |
influence of withdrawals in comparison to other system users or management objectives.
COLUMBIA RIVER FLOWS
Changes to the Hydrograph
The annual Columbia River hydrograph underwent fundamental changes during the twentieth century. These changes were driven primarily by the construction of dozens of dams and reservoirs on the river’s mainstem, hundreds of projects on tributary streams (some of these dams, such as those on the Snake River, are also quite large), and system operations. Although constructed to serve multiple purposes, the driving force behind Columbia River dam construction was hydroelectric power development and, to a lesser extent, flood control. With its solid rock channel, low levels of silt, and relative steepness, the Columbia River was uniquely suited for large-scale hydropower development.
Construction of the first federal Columbia mainstem projects began in 1933 at Bonneville and Grand Coulee. World War II increased pressure to further tap the river’s hydroelectric power production potential, and between 1944 and 1945 Congress authorized several water projects in the basin. In the five years following the war, Chief Joseph Dam, Albeni Falls, Libby, John Day, and The Dalles dams were all authorized (Volkman, 1997). Support for federal dams on the mid-Columbia faded during the 1950s, but licenses were issued to county public utility districts to construct Priest Rapids Dam, Rocky Reach Dam, Wanapum Dam, and Wells Dam, all of which today are operated by public utility districts. Upstream dams that augmented storage and power production capabilities were constructed pursuant to the Columbia River Treaty signed between Canada and the United States in 1961; these dams included Libby Dam in Montana and Arrow Lakes, Duncan, and Mica dams in Canada. The treaty focused primarily on two water management sectors: hydropower and flood control.
The hydrological implications of the construction of this dam and reservoir system, and the operations of that system, on the Columbia River annual hydrograph were tremendous. Fig-
ures 3-2 and 3-3 provide two different portrayals of these changes. The long-term (1879-2002) average discharge of the Columbia River, as measured at The Dalles, is roughly 139,000,000 acre-feet per year (or roughly 192,000 cfs; USGS, 2003). Figure 3-2 shows how annual Columbia River hydrological seasonality has “flattened” the river’s annual discharge patterns, as original high seasonal (“summer”) flows have decreased and low seasonal (“winter”) flows have increased. Figure 3-3 shows how the balance of flows between summer (April-September) and winter (October-March) has changed since the late 1800s. Through time this summer-winter division of flows has become closer to a 50:50 balance in response to system construction and operations largely oriented to serve hydroelectric power needs and operations. In addition to the smoothing of the annual Columbia River hydrograph, construction and operations of the dam and reservoir system have had two other major physical impacts: water velocities have decreased (which has significantly increased the amount of time required for juvenile salmon to travel downstream and into the sea), and the size and orientation of the Columbia River plume (a zone of fresh water extend-
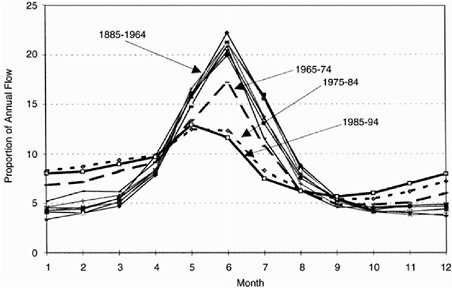
FIGURE 3-2 Distribution of monthly flows at The Dalles by 10-year blocks. SOURCE: Volkman (1997).
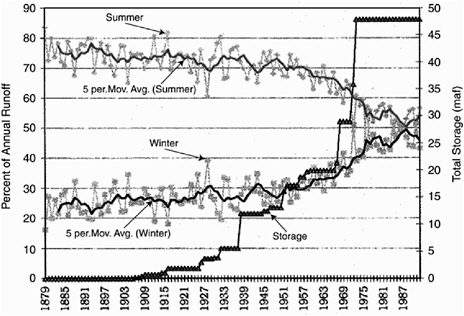
FIGURE 3-3 Changes in seasonal Columbia River flows at The Dalles, 1879 to 1992. SOURCE: Volkman (1997).
ing from the mouth of the Columbia into the Pacific have been greatly altered (Ebbesmeyer and Tangborn, 1992). This is particularly an issue when salmon smolts (young salmon two to three years old) are moving downstream. These changes, however, have not eliminated all variability of Columbia River flows. Figure 3-4, for example, demonstrates that considerable variability of annual Columbia River discharge exists between years. Flows also continue to vary on other timescales; for example, daily flow patterns below hydropower dams often vary substantially as flows are adjusted to demands in electric power. The cumulative impact of all these hydrological changes has likely had significant effects on the early ocean survival of juvenile fish leaving the Columbia River (Pearcy, 1992). Because of concerns over possible impacts on salmon from the construction and operation of the hydropower system, federal and state management and resources agencies have implemented some changes to system operations to help provide instream flows designed to support and enhance salmon habitat. The flows are referred to as “flow targets” and are discussed in the following section.
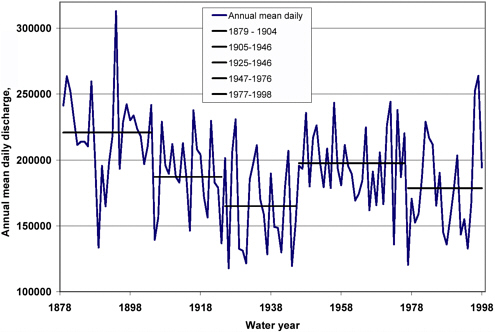
FIGURE 3-4 Columbia River discharge (in cfs), 1879 to 2000, at The Dalles, Oregon. SOURCE: USGS (2003).
Biological Flow Targets
Passage of federal environmental legislation in the 1960s and 1970s, such as the Environmental Policy Act (1969) and the Endangered Species Act (1973), led to changes in system operations as some flows were devoted to protect and sustain endangered salmon species and habitat. “Flow targets” were developed by federal and state resources agencies in efforts to ensure adequate instream flows. Key flow targets involving fishery resources include consideration of smolt migration, spawning flows for chum salmon below Bonneville Dam, spawning and incubation flows at Vernita Bar (see Box 3-1), water elevations in storage reservoirs, and minimum instream flows at reservoir outlets. Specifications regarding these flow targets are provided in the 2000 National Marine Fisheries Service Federal Columbia River Power System Biological Opinion (NMFS, 2000). Of all these flow targets, the most critical with respect to this discussion involves smolt migration flows.
|
BOX 3-1 The Vernita Bar Settlement Agreement, approved in 1988, ensures flows to incubate fall Chinook embryos and fry at Vernita Bar, a large gravel bar and an important spawning area 4 miles downstream from Priest Rapids Dam. Signatories to the agreement include the Bonneville Power Administration (BPA), the National Marine Fisheries Service (since renamed NOAA Fisheries), the Confederated Tribes of the Umatilla Indian Reservation and Colville Indian Reservation, the Yakama Indian Nation, the Washington Department of Fisheries (now Washington Department of Fish and Wildlife), the Oregon Department of Fish and Wildlife, and the Grant, Chelan, and Douglas county public utility districts. The agreement specifies how the Grant, Chelan, and Douglas public utility districts and BPA will provide the required flows and identifies special conditions in the event of inability to perform and adverse water conditions. Flows are regulated to minimize excavation of salmon redds (spawning nests) at flows higher than 70,000 cubic feet per second (kcfs). Grant County Public Utility District is to operate the Priest Rapids Project to the extent feasible to yield river flows during daylight equal to 68 percent of daily mean inflow to Wanapum pool. The agreement does |
As pointed out, the Columbia River system continues to exhibit significant variability of discharge on many different timescales. Partly as a result of this variability, migration flow targets are not always met, and it has generally proven difficult to maintain mainstem flows above the target for the entire fish migration period. In years of low to moderate precipitation, decreased flows in the Columbia River exacerbate this phenomenon. Furthermore, because of consumptive use and hydropower demands during low-flow years, tradeoffs between fishery demands often come into play, particularly between biological needs within storage reservoirs and the associated outlets and anadromous migration conditions in the mainstem. Competing biological demands for water thus often make it impossible to achieve stated flow targets. Although these target flows have at times not been met, meeting the needs of biological and ecological objectives has become an objective with operational priority on par with flood control and hydroelectric power generation.
|
not obligate BPA to limit fall discharge, but BPA attempts to do so. After the end of the salmon spawning season, a field inspection assesses the protection level flow (minimum flow to protect established salmon redds) by several criteria. Protection of redds is related to flow levels in the guidelines. The protection level even considers details such as weekdays versus holidays or weekends and is highly specific. Some flexibility is permitted within the foregoing schedule as long as alternatives provide an equivalent volume. The biological monitoring program tracks temperature data to predict dates of spawning, hatching, emergence of fry, and the end of emergence. At the end of emergence, usually in mid-May, the protection flow level is terminated. As this report went to press, an expanded Vernita Bar Agreement was being drafted. The new agreement, tentatively called the “Hanford Reach Fall Chinook Protection Program,” is to be submitted to the Federal Energy Regulatory Commission for consideration in the relicensing process. |
Hydropower Generation and Spill
The FCRPS is operated to furnish electrical power for industrial, urban, and agricultural needs. This results in daily variability in discharge to meet high demand during daylight hours and low demand during nighttime hours. Coordination between release of water from one dam to the next is important because (1) there are relatively short distances between the dams; (2) most of the dams are run-of-the-river, with little or no storage; and (3) the outflow from one dam is usually the start of the pool behind the next downstream dam. There is also the need to allow some “spill” (the bypassing of water around hydropower generation turbines) of water during downstream migration of salmon smolts to enhance their prospects for survival. The fish spill program is implemented during both the spring and summer
smolt migration periods, from April through August. This strategy is designed to intentionally discharge water over spillways at different dams in the FCRPS in accordance with guidelines specified in NOAA Fisheries 2000 Biological Opinion. These operational features result in sharp changes in diurnal discharge patterns at dams on the Columbia and Snake rivers.
WATER WITHDRAWALS
Existing Water Rights
The Washington State Department of Ecology issues water rights permits in the state. After water use has commenced, department staff visit the site of use and issue a certificate. State law specifies that, if the full volume of a water right is not used at its allocated rate over a five-year period, the volume of the water right not used can be taken away. Historical trends indicate that most permit holders do not divert their full allocations during most years.
The Washington State Department of Ecology has, to date, issued 754 permits for surface water withdrawals from the mainstem Columbia River between the Canadian boundary and Bonneville Dam. The total maximum withdrawal volume of these permits is 4,240,000 acre-feet per year. Withdrawal permits held by the Columbia Basin Project total 3,160,000 acre-feet per year, which represents 74 percent (by volume) of the water rights issued in this reach of the Columbia River. The department has also issued 110 water rights for groundwater extractions within 1 mile of the River, which amount to 440,000 acre-feet per year. Permits in the State of Washington currently issued for Columbia River surface water and groundwater withdrawals within 1 mile of the river thus amount to about 4,700,000 acre-feet per year. An itemized list of surface water permits showed that roughly 96 percent of surface water diversions were used for irrigation, with the remaining 4 percent being used by municipalities and other uses (figures based on data provided by John Covert, Washington State Department of Ecology, 2003).
Table 3-1 illustrates and compares permitted volumes of water withdrawals from the mainstem Columbia River and from groundwater within 1 mile of the river, with regard to maximum,
TABLE 3-1 Columbia River Flows at John Day Dam, 1960-1999 and monthly Columbia River withdrawals
mean, and minimum monthly discharges at John Day Dam2 (1960 to 1999 database, USGS, 2001). Columns 1 through 3 list 1960-1999 Columbia River discharge figures recorded at John Day Dam. Column 4 lists the monthly distribution of water withdrawal permits along the river in the State of Washington. These monthly values are based on actual monthly withdrawal data at Franklin D. Roosevelt Lake by the Columbia Basin Project (agriculture, 96 percent of the withdrawals) and the city of Pasco (municipalities and industry, the remaining 4 percent). No water use data on groundwater withdrawals were available, so Table 3-1 assumes that 75 percent of groundwater withdrawals were used for irrigation and that 25 percent of groundwater was used for commercial, industrial, municipal, domestic, and other uses.
Consumptive use at the Columbia Basin Project is about 70 percent of the volume of surface water withdrawals (Montgomery Water Group, 1997; see also Appendix C). This 70 percent figure was assumed to apply to other areas of irrigated agriculture along the Columbia River mainstem (keeping in mind as well that the Columbia Basin Project represents the largest irrigated agriculture diversion along the river), with the remaining 30 percent of withdrawals eventually returning to the Columbia River as irrigation return flows and groundwater seepage. With regard to the municipal and industrial (M&I) water reflected in Table 3-1, data indicate that roughly 30 percent of municipal water is returned to the Columbia River through wastewater treatment plants (City of Pasco, 2003). It was further assumed that an additional 10 percent of M&I withdrawals returned to the Columbia River through groundwater seepage, for a total consumption of 60 percent of M&I water withdrawals.
Column 5 in Table 3-1 shows that withdrawals of existing water permits under high-flow conditions, as a percentage of total flows, ranged from 0.1 (in December) to 5.9 percent (in August). In contrast, Column 7 shows that withdrawals under
|
2 |
John Day Dam was used as a reference site because almost all existing Columbia River consumptive withdrawals are upstream of this dam. Nearly all the pending permits for additional consumptive withdrawals in the State of Washington are also upstream of John Day Dam. Columbia River discharge figures at John Day include inflows from the Snake River; discharge data in Table 3.1 are thus higher than they would be for stations upstream of the Columbia-Snake confluence. |
minimum flow conditions ranged from 0.2 (in January) to 16.6 percent (July). The critical months of withdrawals under minimum flow conditions are in July and August. These months are periods of high water withdrawals for irrigated agriculture and municipalities. The pronounced seasonality of withdrawals and the sharp differences in the effects of withdrawals according to season are key messages from Table 3-1. These data show that January withdrawals have very little effect on the overall flows of the Columbia but that during July and August current withdrawal volumes have noticeable effects on mainstem flows, especially during lower-than-average discharge years.
Columbia Basin Project
The U.S. Bureau of Reclamation’s Columbia Basin Project (Figure 3-5) is the largest irrigation project in the Columbia River basin. The centerpiece of the project is the Grand Coulee Dam. Completed in 1941, it is the nation’s largest concrete dam. It impounds about 9,400,000 acre-feet of water in Franklin D. Roosevelt Lake, which provides water to the East Columbia Basin Irrigation District, the Quincy Columbia Basin Irrigation District, and the South Columbia River Basin Irrigation District (http://www.usbr.gov/dataweb/html/columbia.html, accessed February 5, 2004). The most important crops on the project are alfalfa, apples, corn, potatoes, and wheat. The project’s network of canals, tunnels, reservoir and pumping plants was intended to deliver water to about 1,100,000 acres of irrigated farmland, but today about 671,000 acres are irrigated (ibid.). Irrigation return flows from the Columbia Basin Project are discharged into the Columbia River through wasteways, creeks, and groundwater seepage.
Withdrawals
Rates and patterns of withdrawals at the Columbia Basin Project vary within and between years. Table 3-2 displays average monthly pumping rates from Franklin D. Roosevelt Lake
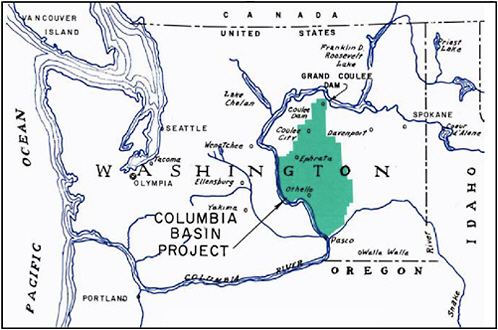
FIGURE 3-5 The Columbia Basin Project. SOURCE: Courtesy of U.S. Bureau of Reclamation, Ephrata, Washington.
(from which water is conveyed to the Columbia Basin Project) and shows that irrigation water is generally applied from March through October, with highest usage during June and July. Figure 3-6 shows annual withdrawals for 1975 to 2000 from Franklin Roosevelt Lake to the Columbia Basin Project. Maximum and minimum annual values were 3,090,000 acre-feet and 1,450,000 acre- feet per year, respectively. The low withdrawal in 1980 corresponds to the eruption of Mount St. Helens. Note that in only one year—1995—did project withdrawals approach the permitted maximum (the U.S. Bureau of Reclamation has water rights for 3,158,000 acre-feet of water per year at Grand Coulee). Expansion of irrigated agriculture on Columbia Basin Project lands would increase withdrawals toward this permitted maximum, which would reduce downstream flows (although roughly 30 percent of the additional withdrawals would return to the Columbia River, a figure that could decrease over time with more efficient irrigation systems). During the time period displayed in Figure 3-6, annual withdrawals averaged roughly 80 percent of the permitted level (1990 withdrawals, depicted in
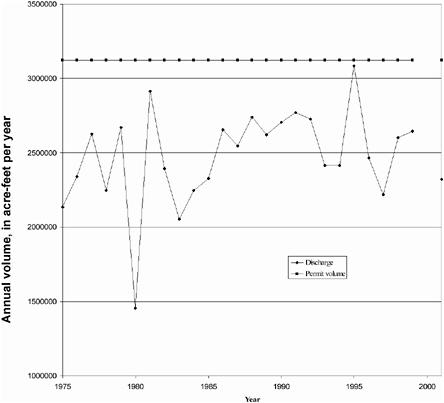
FIGURE 3-6 Annual withdrawals from the Columbia River at Grande Coulee Dam by the Columbia Basin Project. SOURCE: USGS (2003a).
Table 3-2, represented an above-average annual withdrawal for the time period in Figure 3-6). If the Columbia Basin Project were to withdraw its full entitlement of water each year, it would result in an average 25 percent increase of water being delivered to the project (an increase in withdrawals of about 600,000 acre-feet per year). As mentioned, the Columbia Basin Project currently accounts for roughly 74 percent of total water withdrawals from the middle reach of the Columbia River in the State of Washington.
Potential Additional Withdrawals from the Columbia River
One focus of this study was consideration of the effects and risks to salmonid survival over a specific range of proposed additional water withdrawals (250,000 acre-feet per year—1,300,000 acre-feet per year). An additional 1,300,000 acre-feet per year of water withdrawals from the mainstem Columbia River from the Canada-U.S. border to Bonneville Dam would constitute roughly a 28 percent increase in the volume of water permits that have been issued by the State of Washington for surface water withdrawals from the Columbia River and groundwater withdrawals from within 1 mile of the river (current permitted total maximum volume is 4,240,000 acre-feet per year). The effects of these proposed additional withdrawals, and their attendant risks, will vary considerably depending on flow levels in the Columbia River at any given time. Under current withdrawal patterns, the greatest effects of withdrawals on flows are during July and August (particularly during low-flow years), as these are the months of highest withdrawals. The seasonality of proposed additional withdrawals was assumed to be similar to existing water uses for irrigation and municipal uses and is of overriding importance in considering the implications of Columbia River withdrawals for salmon survival. Under current conditions, during January, less than 1 percent of total annual withdrawals are made. About 18 percent of total annual withdrawals are made in July.
TABLE 3-2 Average monthly volumes (thousands of acre-feet) of water pumped from Franklin D. Roosevelt Lake, 1990.
|
Month |
Mar |
April |
May |
June |
July |
|
Volume |
38 |
387 |
508 |
525 |
539 |
|
Percent of Total Annual Withdrawal |
1.3 |
13.4 |
17.6 |
18.2 |
18.7 |
|
SOURCE: Bonneville Power Administration (1993). |
|||||
Numerous calculations and speculations could be made regarding to the proposed range of withdrawals. Assuming that the seasonal pattern of withdrawals continues essentially unchanged and that the upper end of the range of proposed additional withdrawals (1.3 million acre-feet per year) is diverted, this would entail additional withdrawals of roughly 2,600 acre-feet in January and roughly 234,000 acre-feet in July. The effects in January of the upper end of the proposed range of additional diversions would still result in total withdrawals being less than 1 percent of mean January Columbia River flows. The effects in July of the upper end of the proposed range of diversions, by contrast, would increase July withdrawals from roughly 6.8 percent of mean Columbia River flows to roughly 8.6 percent of mean Columbia River flows at John Day Dam (based on 1960to 1999 flows; see Table 3-1). Under minimum July flow conditions, the upper end of the proposed range of diversions would increase July withdrawals from roughly 16.6 percent of Columbia River minimum flows to roughly 21 percent of Columbia River flows at John Day Dam.
In addition to permit applications for withdrawals currently being considered by the State of Washington, other factors point to the possibility of further reductions in future Columbia River flows. Regional climate warming could reduce flows in low-flow periods, human population growth is likely to exert pressures for additional withdrawals from the Columbia, and current users (e.g., tribal reservations) may seek to increase current levels of withdrawals. The occasional but virtually certain coinci-
|
August |
September |
October |
Annual |
Permitted Maximum |
|
473 |
274 |
141 |
2,885 |
3,158 |
|
16.4 |
9.3 |
4.9 |
|
|
dence of unfavorable ocean conditions with one or all of these trends poses additional and substantial risks to Columbia River salmonid survival or recovery of salmonid populations. Later sections of this report elaborate on the concept of risks and their management in the context of Columbia River flows, withdrawals, and salmon survival rates.
RETURN FLOWS AND WATER QUALITY
In addition to water withdrawals, return flows from irrigation projects like the Columbia Basin Project add to river flows and have implications for Columbia River system water quality and quantity as well as for salmon survival. Complete accounting of surface and subsurface discharges of irrigation return flows from the Columbia Basin Project is not possible because they are not measured. A report from the Montgomery Water Group (1997), however, provides some data from which irrigation return flows can be estimated (the rationale and assumptions made in the mass balance of water in the Columbia Basin Project from 1975 through 1994 are provided in Appendix C). Irrigation return flows from the Columbia Basin Project consist of canal and lateral operational spills, surface irrigation drainage, and groundwater outflow. Canal and lateral operational spills are gauged, but surface irrigation and groundwater outflows to the mainstem are unmeasured and were calculated as the closure (balancing) term in the Columbia Basin Project water balance. From 1975 to 1994, canal and lateral spills averaged 265,000 acre-feet per year and irrigation and groundwater outflow to the river combined to average 540,000 acre-feet per year, for an average total return flow to the Columbia River of 805,000 acre-feet per year. Over this 20-year period of record, 30 percent of the irrigation water for the Columbia Basin Project was thus eventually returned to the river. This also means that 70 percent of the water supply for the Columbia Basin Project was consumed or was evaporated, because the change in water storage in the project was assumed to be zero (see Appendix C).
Several water quality parameters are of key concern in the Columbia River system, including water temperature, dissolved oxygen, nutrients, suspended sediments, pesticides, trace metals,
and pharmaceuticals (USGS, 1998). Concerns regarding water temperature are illustrated by summer water temperatures in Crab Creek, a small stream near Beverly, Washington. Crab Creek conveys irrigation return flows from the Columbia Basin Project. Water temperatures in Crab Creek (Figure 3-7) generally reflect variations in air temperature from July to September. Based on daily water temperature records from 1975 through 2002 at Crab Creek, and at the Columbia River at Grand Coulee Dam and near Vernita (Washington Department of Ecology, 2003b), water temperatures in Crab Creek are higher than those in the Columbia River during late winter and spring and lower than Columbia River water temperatures during fall and early winter.
The U.S. Geological Survey’s National Water Quality Assessment (NAWQA) Program for the Central Columbia Plateau for 1992 to 1995 reported that “the health of the aquatic ecosystems is substantially affected by agricultural practices and, in a few streams, by wastewater discharges” (USGS, 1998) in Washington and Idaho. Numerous water quality parameters can
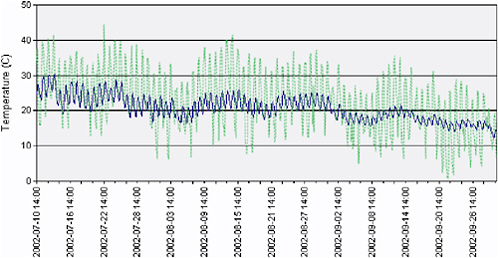
FIGURE 3-7 Water temperatures (bold) in Crab Creek (which conveys return flows from the Columbia Basin Project), and air temperatures, in July, August, and September, 2002. SOURCE: Washington State Dept of Ecology (2003a).
be influenced by agricultural practices and wastewater discharge, including nutrients (specifically nitrogen and phosphorus), sediment, and organic and trace metal contaminants. For example, the NAWQA study found that nitrate-N concentrations increased from less than 1 mg per L in the 1960s to about 3 mg per L in the 1980s (USGS, 1998). Irrigation can also lead to increases in soil erosion and therefore increased sedimentation in streambeds. In the Columbia Basin Project, however, the conversion of surface furrow irrigation to pressurized irrigation (center pivot and sprinkler) since the 1970s (Montgomery Water Group, 1997) has reduced daily suspended sediment yields (load per acre) from about 0.3 pounds per acre in 1975 to about 0.1 pounds per acre in the 1980s (USGS, 1998). In contrast, agricultural return flows in the Yakima River basin have at times contributed to impaired water quality in the Yakima River (U.S. Bureau of Reclamation, 2002). In addition to the influence of sediment on the quality of stream habitat, sediment yield is an important concern because most organochlorine pesticides, such as DDT, are found in streambed sediments. Long banned from use, DDT levels exceeding general standards for aquatic life protection have nonetheless been found in streambed sediments in upper reaches of Crab Creek (USGS, 1998). In the Yakima River basin, DDT and its breakdown products have been found in fish tissue in excess of recommended human health criteria, and concentrations of these pesticides have been correlated with suspended sediment levels (ibid.). Some studies have noted increased cancer risks in certain populations, such as Native Americans, that consume high amounts of Columbia River basin fish (Columbia Basin Bulletin, 2002).
Groundwater samples taken from the Columbia Basin Project exhibit elevated nitrate concentrations, which vary by location. For example, nitrate values in groundwater exceed drinking water standards in shallow groundwater (observation wells), with smaller background concentrations found in deeper wells (USGS, 1998). Pesticide residues were found to be present in high nitrate wells, sometimes exceeding the Maximum Contaminant Level (MCL) for drinking water (USGS, 1998). The U.S. Geological Survey has initiated studies in its NAWQA program to intensively investigate surface and groundwater quality in the Central Columbia Plateau and Yakima River basin (USGS, 2003b).
Beyond immediate human health concerns associated with exposure to pesticides and trace metals through consumption of fish, high concentrations of contaminants and nutrient enrichment in return flows could have long-term implications for the health of salmon populations. For example, in a nationwide reconnaissance of 139 streams conducted in 1999 to 2000 by the U.S. Geological Survey, a wide range of organic wastewater contaminants, including pharmaceuticals and hormones, were detected in streams downstream of sources of human, industrial, and agricultural wastes (Kolpin et al., 2002). Multiple organic wastewater contaminant detection was common, including many compounds for which aquatic life criteria have not been established.
The exposure of fish to organic contaminants, particularly treated municipal sewage discharge, has been demonstrated to impact fish health at several levels, ranging from biochemical processes, to organ functions, to organism fitness (Porter and Janz, 2003). Exposure of adult fish to synthetic hormones and other contaminants with estrogenic properties can significantly impair fertility (Schulz et al., 2003). Exposure to low but detectable levels of organic wastewater contaminants from increasing municipal and agricultural uses of water may thus impact the survival and reproduction of the salmon, especially during summer in low-flow years, when concentrations would be greatest.
WATER TEMPERATURE
There are data for Columbia River water temperatures that date back to 1938 (USACE, 2000. Data provided to Stuart McKenzie for a report sponsored for the Northwest Power Planning Council.). Figure 3-8 shows maximum and average Columbia River August water temperatures at Bonneville Dam. As the figure indicates, the trend lines show clear increases in August water temperatures over time. Water temperature data at Bonneville Dam also reveal that the first and last dates on which water temperatures equal or exceed 20°C are occurring earlier in the year later in the year, respectively. Average and maximum values of Columbia River water temperatures are today both well above 20°C. These increasing trends in water temperatures are
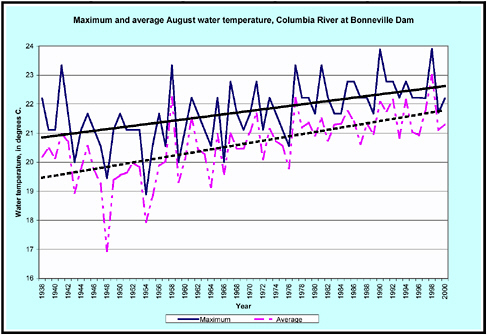
FIGURE 3-8 Maximum and average August water temperatures in the Columbia River at Bonneville Dam (straight lines reflect trends for maximum and average values). SOURCE: USACE, 2000. Data provided to Stuart McKenzie for a report prepared for the Northwest Power Planning Council.
of great concern with regard to the survival of Columbia River salmon. For example, August temperatures at Bonneville Dam exceed temperatures preferred by cold water fish like salmonids (~10° to 15°C; Kling et al., 2003). More importantly, it means that Columbia River water temperatures are approaching the upper limits of thermal tolerance for cold water fishes (~20° to 24°C; Mohseni et al., 2003) such as salmonids.
These temperature changes appear to have been driven by (1) construction of the dam and reservoir system (the large surface areas of Columbia River reservoirs and the increased residence time of water in these reservoirs both contribute to higher water temperatures) and (2) increased temperatures of inflows from tributaries from watersheds that have lost riparian cover that provided shade for those streams.
CLIMATE VARIABILITY AND CHANGE
Changes and variability in regional climate across the Columbia River basin influence discharge and water temperatures of the basin. For example, winter precipitation amounts and snowpack depths in the basin’s higher-elevation areas affect seasonal patterns of the river’s discharge. Climate variability and changes also have important implications for Columbia River water temperatures (as shown in Figure 3-8). The influences of climatic variability on Columbia River flows have been investigated by many scientists (e.g., Miles et al., 2000; Mote, 2003; Payne et al., 2004), and there is evidence of a gradual warming of Pacific Northwest climate during the twentieth century. For example, in a report for the U.S. Global Change Research Program, a scientific team that evaluated the potential consequence of climate change for the Pacific Northwest concluded that “over the 20th century, annual average temperature in the Northwest rose 1 to 3°F (0.6 to 1.7°C) over most of the region” (Mote et al., 1999). The Columbia River was subjected to many changes and human influences during the twentieth century, and care must be taken in ascribing cause-and-effect explanations for climatic and hydrological trends. Some of the concerns regarding possible future climate warming in the region are related to increasing global mean surface air temperature during the twentieth century (about 0.4° to 0.8 °C, or 0.7° to 1.5°F; NRC, 2001a). Further evidence of possible regional climate changes might be gained by evaluating climate variability in the undammed Fraser River in Canada, which lies just to the north of the Columbia River basin (see Box 3-2). Climate change and possible warming across the Columbia River basin represent additional uncertainties, such as possible upstream development, tribal water rights adjudications, or variations in ocean conditions, that will affect the cumulative future impacts of water management decisions across the basin.
A key concern regarding possible future climate warming across the basin is the potential effects on the basin’s snowpack. Recent research suggests that warmer temperatures across the basin are contributing to declines in total snow accumulations and that the decline in the Cascade Mountains may be as much as 60 percent (Mote, 2003). The implications are that the melting of snowpack earlier in the spring will increase spring runoff
|
BOX 3-2 Evaluating the impacts of climate changes and variability is often complicated because the results from other nonclimate variables can intervene and cause similar impacts. For example, water temperatures can be affected by changes in water levels and human activities, such as thermal effects of power plants. In seeking an understanding of how twentieth-century climate affected Columbia River temperatures, a convenient frame of reference exists: Canada’s Fraser River. Comparisons between the Fraser and Columbia are useful because the Fraser is relatively close to the Columbia, and its basin is of similar dimensions and has features in common with the Columbia (e.g., headwaters along the western flanks of North America’s Rocky Mountains). The Fraser also makes for useful comparison because it is undammed and thus allows for climatic effects on water temperatures in the absence of dams—perhaps the most important human-induced change in Columbia River hydrology—to be considered. As the figure here illustrates, from 1953 to 1998, the mean summer temperature of Fraser River water temperature increased by 1.1°C (available online at http://wlapwww.gov.bc.ca/soerpt/, British Columbia Ministry of Water, Land and Air Protection website). Air temperature in the interior of the Fraser River basin also rose by 1.1 °C in the same period. Fraser River flow has declined since 1913. Although it is not exactly clear what has caused the increases in Fraser River temperature, the increase did not |
peaks and reduce summer streamflow.
As Daniel Cayan, a climate scientist at the Scripps Institution of Oceanography explained, “It doesn’t mean we’ve lost water…. It means the water is coming off earlier” (quoted in Service, 2004). The upshot is thus that winters would be wetter and summers drier. Not all scientists agree that recent warming across the basin necessarily portends a warmer future, however, as some climate scientists argue that broad trends in temperature and snow accumulation across the basin are due to natural multidecadal oscillations in climate patters.
Many atmospheric scientists are concerned that twentieth-century climate warming in the Columbia River basin was a result of global increases in “greenhouse gases” such as carbon dioxide, and there are some concerns that warming will continue
|
result from dams and their operations. In considering twentieth-century increases in Columbia River water temperatures, data for the Fraser River suggest that the Columbia’s temperature increases may not be entirely a result of dams and impoundments and may be affected by other factors such as increasing air temperatures (i.e., climate change). Average Fraser River temperature (1953 to 1998) 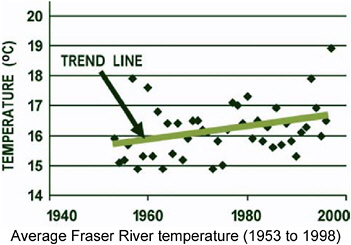 SOURCE: Pacific Salmon Commission (1941-1998), Environment Canada, analysis by Canadian Institute for Climate Studies. Figure available online at http://wlapwww.gov.bc.ca/soerpt/pdf/997climate/fraser.pdf. |
during the twenty-first century. Atmospheric and climate scientists have developed general circulation models (GCMs) that are used to simulate behavior of the global climate system and to forecast future global and regional changes in climate. Several of these GCMs are used by scientists in North America and Europe, and they are frequently used to forecast regional climatic implications of continued increases in greenhouse gas levels. For example, future Pacific Northwest climate change scenarios from the Intergovernmental Panel on Climate Change and other groups and scientists (Table 3-3) suggest that air temperatures across the region are likely to increase, with less agreement on possible changes in precipitation. In its evaluation of potential climate change impacts on the Pacific Northwest, changes in
TABLE 3-3 Projected Climate Changes over the Columbia River Basin
|
Area |
Winter Temp, °C |
Summer Temp, °C |
Winter Precipitation |
Summer Precipitation, % Change |
Year of Projection |
Source |
|
Western North America |
+4 to +6 |
+3 to +5.4 |
0 to +40 % change |
-10 to +10% change |
2071-2100 minus 1961-1990 |
Houghton et al. (2001) |
|
Pacific Northwest States |
+4.5 to +6 |
+4 to +4.5 |
Annual 0 to +50% change |
2090 |
US National Assessment (2000) |
|
|
Pacific Northwest regional climate |
Annual +4.8 to +7.3 |
-1.0 to +10.4 cm |
-4.6 to +2.0 cm |
2050 |
Mote et al. (1999) |
|
|
Columbia River basin |
Annual +1.3 |
+5 % change |
|
2040-2069 |
Payne et al. (2004) |
|
precipitation. In its evaluation of potential climate change impacts on the Pacific Northwest, the U.S. Global Change Research Program stated that “regional warming is projected to continue at an increased rate” and also noted less agreement on precipitation forecasts (National Assessment Synthesis Team, 2000). Possible shifts in precipitation patterns and increasing air temperatures have implications for Columbia River hydrology and water management, including water withdrawal permitting decisions. These scenarios represent well-informed speculation on the future, although details across scenarios often show varying results. Nonetheless, the weight of scientific evidence suggests that long-term climate warming of recent decades across the basin is likely to continue. Such long-term temperature increases would represent an increased risk to the survival of Columbia River salmonids, as increasing temperature would represent a threat in terms of further increases in Columbia River water temperatures (which also increased during the latter twentieth century) and reduced flows during low-flow periods. Some observers have noted that the Columbia River water system experiences
stresses during low-flow periods under current conditions and that “the best water management and planning of today will be done by those with an eye towards both natural patterns of climate variability and possible changes in climate” (Miles et al., 2000). Given the increasing water temperatures in the Columbia River, climate warming across the basin during the late twentieth century, and the prospect of possible additional warming across the basin in the twenty-first century, water management agencies would be well advised to monitor climate data and variability and prepare to adjust operational decisions accordingly as new information becomes available. Appendix D contains additional discussion on climate change and its implications for Columbia River basin hydrology.
SUMMARY
The Columbia River basin experienced a variety of substantial changes to its patterns of water flows and its water quality during the twentieth century. The most dramatic of these changes was the fundamental alteration of the great river’s annual hydrograph. At the start of the century, that hydrograph exhibited a great seasonality between its low-flow and high-flow periods. With the construction and operation of the Federal Columbia River Power System, the annual hydrograph was substantially “flattened.” By the end of the twentieth century, the differences in flows throughout the year had been greatly reduced, in large part to stabilize flows used to generate hydroelectric power. Considerable interannual and diurnal variability in flows remains, however. Other key operational considerations in the system are flood control, instream flows, and irrigation withdrawals.
There are many users of water along the Columbia River in Washington State. As is the case across the West, irrigated agriculture is the largest consumptive user. About 96 percent of withdrawals are utilized by irrigators, the other 4 percent by municipalities and industries (mainly in the Tri-Cities of Richland, Kennewick, and Pasco). By far the largest irrigator is the federal Columbia Basin Project, which diverts an impressive 74 percent of total irrigation water withdrawals from the Columbia River in Washington. The remaining withdrawals are from a
large number of small (relative to the Columbia’s flows) withdrawals.
The current pattern of withdrawals is such that they have very little effect on Columbia River flows during January, a period of low demand. By contrast, the volumes of withdrawals in July and August—a period of highest demand—have noticeable effects on Columbia River flows. Although hydrological data on Columbia River withdrawals are imperfect, the data that are available suggest that summer withdrawals in July divert roughly 16.6 percent of river flows at John Day Dam. The upper end of the range of prospective additional withdrawals considered in this study would increase that figure, raising it to roughly 21 percent. A key issue in considering the implications of prospective additional water diversions clearly is the seasonality of those diversions.
Other important changes to the river include deteriorating water quality, which has implications for Columbia River salmon, and increasing water temperatures. Water temperatures in the mainstem Columbia increased steadily during the latter part of the twentieth century. Most observers attribute this increase to the construction of dams and impoundments along the river. Other watersheds in the region that have had fewer hydrological alterations—such as Canada’s Fraser River—exhibit increases in water temperature in the absence of impoundments (the magnitude of temperature increases there, however, is smaller than in the Columbia). Prospective climate warming across the Columbia basin may thus also be contributing to this trend. Although precise cause-and-effect mechanisms are hard to define clearly, the changes in Columbia River hydrology identified in this chapter have greatly affected the basin’s salmon populations. The following chapter examines relationships between Columbia River salmon and several environmental changes and variables.


