
7
Analysis of the R&D Data Funding Discrepancies
One characteristic of the portfolio of R&D expenditure surveys is that each survey was designed to meet a specific goal or set of goals. A previous National Research Council study concluded that each survey was developed to address a narrow topic rather than serve as an integrated part of a comprehensive system of R&D expenditure data (National Research Council, 2000). The nonintegrated nature of the portfolio came about as the survey managers scrambled to meet priority needs and initiated collections as resources became available, not necessarily as part of an overall master plan.
Despite much attention on the part of NSF to a concordance of concepts and definitions across the data collections, the independent development of the pieces of the R&D expenditure portfolio has led to gaps and anomalies that are of some trouble to data users. Perhaps no gap is more troublesome over time than the apparent discrepancy in funding and performance estimates among the surveys.
The topside measures of the apparent discrepancy illustrate this problem. When NSF collects data from the federal government on the amount that Congress authorizes to be spent on R&D (budget authority) that goes to academia and industry, it reports that the federal government has $86.8 billion to spend on R&D in fiscal year 2001. But when NSF tallies reports from academia and industry on funding received from federal sources during that same fiscal year, it only comes up with $72.6 billion. This discrepancy of $14.1 billion between budget authority and receipts is one depiction of the size of the discrepancy. Often, a comparison is made between obligations (which are tracked in detail in the federal funds survey) and
performer receipts. The discrepancy between obligations and performer receipts in fiscal year (FY) 2001 amounted to a hefty $7.3 billion—smaller than the discrepancy between authority and receipts, but still worthy of attention. In an ideal world, the reports of spending and receipts would match, perhaps with some adjustment for lags in the transfer of funds.
There have been several attempts to disentangle this apparent discrepancy over the past several years (Congressional Research Service, 2000). This is considered an important issue by many. The discrepancy is annoying as an accounting anomaly to analysts who seek to trace the funding streams and answer the question “Where did the money go?” (Koizumi, 2003). It is also of concern to members of Congress and others who have oversight and legislative responsibilities, because the discrepancy casts a shadow over the accuracy of the data that are used to gauge the overall health and vitality of the nation’s R&D enterprise, as well as answer the question “Are spending and receipt estimates accurately depicting how the money is flowing, and are the funds flowing in amounts and directions prescribed by legislation?” (U.S. General Accounting Office, 2001).
The discrepancy is of special concern to the panel and others who have studied it because its existence may signal a systemic quality problem in one or more of the NSF datasets. One litmus test of the quality of any statistical series is to compare the series with comparable data collected by other means. It is common statistical practice for federal statistical agencies to use administrative data sources to benchmark the totals derived from surveys. Measurement of undercoverage and overcoverage error (the failure to include or exclude some population units in the frame used for sample selection) often rely on comparing survey estimates to independent sources (U.S. Office of Management and Budget, 2001).
NATURE OF THE DISCREPANCY
As shown in Table 7-1, the discrepancy as measured by both obligations and outlays (see Box 2-1) has appeared to change course three times over the past three decades.
-
Prior to 1980, the discrepancy was quite small and generally indicated that federal obligations exceeded performer spending.
-
In the 1980s, the discrepancy became noticeable and changed, and for nearly a decade, spending appeared to significantly exceed obligations.
-
Around 1990, the trend shifted again, and spending once again has lagged obligations and outlays, only now by fairly substantial amounts.
The timing of these swings in the data series is in close alignment with changes in the design and operation of the NSF data collections, so it is
TABLE 7-1 Comparisons of Federal- and Performer-Reported Expenditures for Federal R&D ($millions)
useful to examine the possible relationship of these shifts with changes in survey design and implementation.
As the nature of the discrepancy suggests, there is probably no single point of origin of the difference between the data series. The discrepancy could arise from differing concepts, definitions, and interpretations in the data sources; from errors in the administrative reporting of federal funds; from measurement errors in the survey of R&D expenditures at universities and colleges; from sampling and measurement errors in the survey of industrial research and development; or from combinations of these sources of error. It has also been postulated that some of the discrepancy may be attributed to systemic reporting problems arising from the classified nature of some Department of Defense (DoD) R&D spending. In this section, we examine each of these potential sources of error.
Differing Concepts, Definitions, and Interpretations
In order for the data on federal obligations and performer expenditures to add up to the same total, they must be based on the same definitional criteria and have the same time horizon. However, federal obligations and performer expenditures are not definitionally the same and they do not necessarily pertain to the same point in time. In its report on the discrepancy, the General Accounting Office (GAO) pointed out that obligations are estimates of payments to be made by federal agencies without regard to when the payments may (or may not) ultimately be made. These obligations are made on the basis of the availability of appropriations and on the assumption that the performers will meet their expectations. Expenditures represent actual performer cost or expense data without regard to when the federal obligation was made. These expenses can occur years after the obligation (U.S. General Accounting Office, 2001).
Obligations are tied to orders placed, contracts awarded, services received, and similar transactions during a given period, regardless of when the future payment of money is actually required. The period for the reporting of obligations is standardized on the federal fiscal year: October 1 to September 30. Expenditures are reported when a reimbursement is made and in reference to a calendar year. These basic differences are exacerbated by federal contract payment practices. It was pointed out at the panel’s workshop that no money comes to an academic contactor as a result of an obligation until the work is actually performed and billed, with a wait of 30-90 days for payment. Thus, at the performing institution, reported federal expenditures lag actual spending of money by several months. Since the average award is made toward the end of the fiscal year, this dynamic could lead to a natural delay between an obligation and an expenditure of 18 months to 2 years.
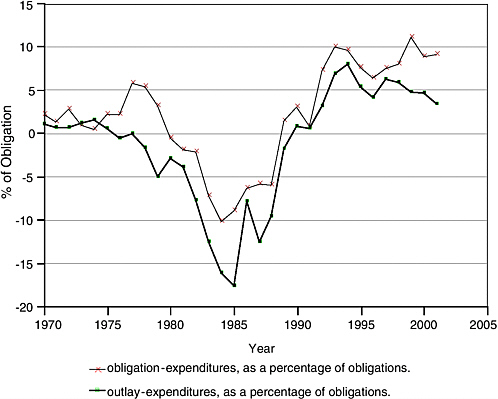
FIGURE 7-1 Comparison of annual federal and performer-related expenditures, 1970-2001.
NOTE: Data are shown as a percentage of annual obligations in order to adjust for inflation and changing level of federal support.
Considering these definitional differences, it is not surprising that there should be a discrepancy. The GAO report concluded that the discrepancy results primarily from annually comparing two separate and distinct types of financial data—federal obligations and performer expenditures—that are not comparable (U.S. General Accounting Office, 2001).
The extent of the contribution of this difference in definition and time horizon to explaining the alleged discrepancy can be seen when the comparison is made using outlays rather than obligations as the basis of comparison with expenditures. Outlays are generally considered to be closely akin to spending. They represent the amounts for checks issued and cash payments made during a given period, regardless of when the funds were appropriated or obligated. When these more comparable parameters are used as the basis for the reconciliation, a good part of the apparent discrepancy disappears. In 2001, when obligations exceeded expenditures by $7.3 billion, the difference between outlays and expenditures was just $2.7 billion (see Figure 7-1).
Although the size of this discrepancy varies by year, it could be said that the more valid comparison of federal outlays and performer expenditures reduces the discrepancy by one-half to two-thirds. On this basis, the panel recommends that future comparisons of federal funding and performer expenditures be based on outlays versus expenditures, not obligations versus expenditures (Recommendation 7.1). However, this more proximate alignment of definitions and time horizons still does not explain away the gap. Something else is apparently affecting the comparison.
Sampling and Measurement Errors in the Industrial R&D Survey
The most significant discrepancy resides between data reported by the federal government as obligated to R&D in industry and that reported by industry as expenditures in the industrial research and development survey. In this section, we examine the size and direction of this gap, summarize previous investigations into the source of this difference, and introduce discussion of a potential cause of the growing discrepancy over the 1990s.
As previously discussed, most of the overall discrepancy between federal obligations and reported expenditures has been between federally reported obligations to industry and the amounts reported as being received and expended by industry. The survey of federal funds reported $27.0 billion in obligations to industry in 2001, while the survey of industrial R&D reported that the federal government was the source of just $16.9 billion in industry expenditures. This gap of $10.1 billion, or nearly one-third, could be more than explained by the discrepancy between what DoD reports as R&D funding (obligations) and what industry reports it receives from DoD, a gap that amounted to $11.4 billion that year. Other agency-related gaps were smaller or offsetting.
A Congressional Research Service (CRS) study discussed several potential reasons for the phase shift in the gap in industry R&D numbers in the 1990s: acquisitions, mergers, and other structural changes in defense and aerospace industries in the decade; differing interpretations of R&D in the federal government and industry; and partial reporting by industry (Congressional Research Service, 1999, 2000).
When companies merge and acquire other companies, the quality and consistency of data reporting may suffer. In the 1990s there was an aggressive round of mergers, acquisitions, and other structural changes in the defense and aerospace industry that may have resulted in decreased awareness of the nature and scope of R&D in the new company. In some cases, smaller firms that were R&D intensive and contributed significantly to the estimates simply went away. Their R&D activities may or may not have been identified in the new reports of R&D data to the government provided by the acquiring company. This led to the conclusion that consolidation of
the defense and aerospace industry contributed to the R&D data reporting problem (Quantum Research Corporation, 1999). Further on this issue, according to the CRS, DoD officials postulate that corporate mergers have affected continuity of reporting because job losses that accompany the consolidations have often pared individuals in front offices who had competently completed these surveys in the past (Congressional Research Service, 1999).
Although the definitions of R&D are reasonably clear and have been consistent over time, we have observed that there can be different interpretations of what constitutes R&D between a government agency and the companies that receive the funds at the individual project level. The Quantum Research Corporation (QRC) study compared a set of examples of project awards classified as research, development, test, and evaluation (RDT&E) by DoD with the categorizations provided by the recipient companies. The results of this small test were striking. Two-thirds of the companies did not consider most of the activities selected by DoD to meet their definition of traditional, reportable R&D work. A Census Bureau study of defense subcontractors came up with the same conclusion. Many of the subcontractors reported work as general R&D without ascribing it to an agency, often because the agency detail was not mandated by law (U.S. Census Bureau, 1997). This observation may well account for the fact that DoD expenditures are underreported by industry, while industry reports more “other” sources of funding than does the federal government. However, even if all of the gap in “other” were ascribed to DoD, it would account for only a minority of the DoD discrepancy.
Recalling that one of the so-called phase shifts in the gap between federal obligations for industry R&D and the amount reported by industry performers took place between 1991 and 1992, the panel examined results of the large-scale revision of the industry R&D survey that was introduced in 1991 to determine if that might have had an effect on the gap. Prior to the 1992 survey, the sample of firms surveyed was selected at irregular intervals, roughly associated with the economic census updates.1 In the intervening years, only a panel of the largest firms known to perform R&D was surveyed. In latter years of the 1980s, for example, the sample was refreshed in 1987, when 14,000 firms were surveyed. From 1988 to 1991, just 1,700 of these firms were resurveyed, and the R&D data for the rest were estimated. This survey design biased the survey results in favor of large manufacturing firms, when it was increasingly apparent that there was substantial growth in R&D performance in the
nonmanufacturing sector and among smaller firms. Consequently, in 1991, the survey was redesigned to draw new samples with broader coverage annually and increase the sample size to approximately 23,000 firms each year. The impact of this change in the sample design is seen in the revisions to the data for the immediately prior year, 1990. The new sample design accounted for $13.7 billion or about 93 percent of the total $14.7 billion revision to total R&D, with most of that revision ($11.4 billion) attributed to better coverage of nonmanufacturing industries. In keeping with standard practice when dealing with large revisions, the new levels were wedged back in time, in this case to 1987, the year in which the last full sample was surveyed.
Although new estimates were prepared for 1991, it is obvious that a good part of the jump of nearly $5 billion in the size of the discrepancy between agency R&D spending and industry performer reports was attributable to changes in survey design. Some of the increase that year may be due to a one-time dip in DoD R&D spending, probably associated with diversion of R&D funds to support the Persian Gulf war effort, but the fact that the discrepancy continued to grow over the next couple of years, when DoD spending returned to prewar levels, indicates that a long-term shift in the data series indeed occurred.
The impact of the 1991-1992 survey redesign is readily apparent, but the question remains, why? In this matter, we can only speculate that the larger representation of small firms and nonmanufacturing industries changed reporting patterns. Outside the manufacturing sector, where R&D is conducted in a very formalized setting usually involving laboratories and R&D management structures, there may be less knowledge of the source of origination of R&D funds and more frequent pass-through and collaborative arrangements, which might well confuse respondents when asked to report on funding from federal sources. This may lead to underreporting among these firms. When the results of the underreported federal R&D receipts in the nonmanufacturing sector are weighted by the employment in that sector, the resulting estimate will fall short of an estimate derived largely from a survey that previously covered mainly the manufacturing sector. This downward bias in reporting of federal receipts appears to date back to the 1991 redesign of the industrial R&D survey. As the weight of the manufacturing sector in the survey has continued to decline with the growth in nonmanufacturing, this effect may well be the source of a large part of the growing reported discrepancy.
Errors in the Administrative Reporting of Federal Funds
In Chapter 5, we discuss several sources of potential error in the administrative reporting of federal funds in the annual Survey of Federal Funds
for Research and Development. In this section, we highlight several of those sources of potential error, culled largely from previous studies by CRS and GAO as a means of pinpointing possible reasons for the discrepancy.
There is considerable evidence that timely and accurate completion of this survey is not a high priority for the federal agencies that annually provide the data. Top agency officials do not seem to understand the purpose and importance of collecting obligation data, in addition to the authority and outlay data provided regularly on a priority basis to the U.S. Office of Management and Budget (OMB) and to Congress on a “real-time” basis. Consequently, agency reporters may not receive sufficient resources to fully provide complete and timely data to NSF.
The lack of timeliness of data submission is indicative of the problem. NSF broadcasts its call for data in February of each year, closely on the heels of the release of the president’s budget, requesting that agencies submit the data by May 15. Only about half of agencies meet that deadline, most blaming the requirements for extraordinary data compilation to levels not called for in managing the R&D programs nor in reporting to OMB. Labor-intensive and time-consuming processes without direct payoff to the agency are likely to be error-ridden, no matter how conscientious the agency reporters who have responsibility for furnishing the data.
Further complicating the ability to provide data to NSF have been dramatic changes in procurement practices in the federal government over the past decade. The shift away from specific task-oriented R&D contracts with the ultimate performer to larger contract awards which tend to be multiyear, multiagency, “blanket” indefinite order-type contracts and a trend toward “bunching” smaller contracts into large vehicles may have caused a difference in how R&D activities are categorized by respondents. These shifts in the composition of RDT&E procurements during the past 10 years were labeled the “most likely cause of divergence between the NSF reports” in a study by the Quantum Research Corporation (1999). However, a subsequent CRS study reported that DoD officials did not agree with the assessment that this was a primary cause, since many of the procurement reforms proceeded the growth in the gap (Congressional Research Service, 1999).
There is some speculation that agencies may not be consistently reporting R&D, despite the fact that NSF provides survey respondents with definitions of each data item collected on the surveys and stands ready to provide extensive hands-on assistance in ensuring that the right data are collected. Many of the agency reporters are budget analysts without detailed knowledge of the R&D enterprise and procurement activities in their agency. When confronted with judgment calls (e.g., should training, program evaluation, and construction be included?) they may not be as qualified to make the judgment as scientists and engineers and procurement
officials (Congressional Research Service, 1999, 2000). Furthermore, even when agencies agree on definitions, they may be at variance with performer practices. Federal agencies often consider program management as an R&D activity, but performers may not (U.S. General Accounting Office, 2001).
Another source of potential error identified by participants in the 1998 NSF workshop on federal R&D was the challenge of determining the ultimate performer of R&D, particularly in larger R&D agencies with many of the aforementioned multitask, multiyear procurement vehicles. Even when the agency is able to identify the ultimate performer, the multitask contracts may mingle procurement and R&D activities in ways that make it difficult for the ultimate performers to appropriately break down the contract into its procurement and R&D pieces to prepare their NSF report. It has been observed that agencies tend to overreport intramural funding for federal laboratories, while underreporting R&D funding spent at an industrial or academic institution (Congressional Research Service, 1999, 2000). In addition, the visibility of some R&D funding appears to disappear when sent to another agency for dispersal. There may be inadequate mechanisms for interagency exchange of information that allows tracing of R&D data to the ultimate performer.
The changing nature of federal programs as they move through time is a further potential complication. An emerging program often moves through a progression from basic research to applied research to development to implementation, and the reporting system may not catch up with that progression. An example used quite often in the literature is the ambitious National Aeronautic and Space Administration (NASA) space station program, which saw significantly increased reported R&D obligations during the 1990s and sharply reduced reported R&D in 2000 when the program matured from an R&D-intensive activity to other categories of reporting. Industry-reported NASA R&D expenditures did not correspondingly reflect this upsurge and reduction in R&D, so the gap widened over the 1990s to the extent that, in 1998, industry reported a level of spending only one-third that reported by NASA (see Table 7-2).
Measurement Errors in the Survey of Academic R&D Expenditures
Compared with the size of the gap in the reporting of federal R&D outlays to industry and industry-reported R&D expenditures, the gap between reports of the federal government and academic institutions is minuscule (Table 7-3). In 2001, the difference between federal R&D obligations and reported university R&D expenditures amounted to only $397,000, or 2.0 percent of the total.
When adjusted to eliminate double-counting of funds passed through from one academic institution to another, the difference was a bit larger, totaling $1.1 million, or 5.6 percent. This adjustment for double-counting
TABLE 7-2 Selected Differences in Agency Reported R&D Funding to Industry and Industry-Reported R&D Expenditures ($millions)
TABLE 7-3 Comparison of University Federal R&D Expenditures with Agency-Reported R&D Obligations ($millions)
has been made to university R&D since 1998 and was enabled by the addition of questions to the data collection form that break out how much of the R&D expenditures were passed through the institution to subrecipients, and how much were received by the institution as a subrecipient. These questions were added when NSF determined, as the result of an investigation, that at least $350 million of the $1.9 million difference in 1996 was due to double-counting (National Research Council, 2000). The effect of this correction was dramatic, although not necessarily consistent in direction (see Figure 7-1).
RECONCILING THE ESTIMATES
It is tempting to suggest that differences in definitions, time horizons, data collection methodology, and the effect of sampling and measurement errors simply invalidate a direct comparison of federal spending and performer expenditures. The estimates of federal funding for R&D in academia and industry, academic R&D expenditures, and industry R&D expenditures are independently derived from very different sources and cannot be expected to add up. However, it is essential to continue to peel away these potential sources of the discrepancy as a means of aiding in the interpretation of the NSF data, as well as a means of assisting in identifying sources of error in the estimates.
Thus, the panel’s recommendation is that a reconciliation of the estimates of federal outlays for R&D and performer expenditures be conducted by NSF on an annual basis (Recommendation 7.2). This reconciliation should be published and widely disseminated by NSF as an aid to data users and as a blueprint for modifying the structure and implementation of the data collections to improve their concordance over time. The recent decision on the part of NSF to attempt to reduce a source of noncomparatibility by collecting data on potential double-counting of university R&D subcontracting was in direct response to attention to the size of the discrepancy. This change in data collection indicates that shining the spotlight on these differences can lead to improvements in data collection that, in turn, will reduce the gap over time.


