
6
Flash Flood Warning Process in Los Angeles and Ventura Counties
Forecasting flash floods in Los Angeles and Ventura Counties is a complex process that begins with an understanding of the geographical makeup of the counties and knowledge of the preferential regions of heavy rainfall (i.e., precipitation climatology) for the area of responsibility. The geography and orography of the region for which the National Weather Service (NWS) Los Angeles-Oxnard (LOX) office is responsible are among the more varied in the United States. The elevation ranges from sea level to 10,500 feet over a mere 50 miles, and the land surface varies from ocean to islands, mountains to valleys, desert to agricultural lands to major metropolitan areas. Mountain chains run not only roughly parallel to the coastline but also nearly east-west, making them almost perpendicular to the moist, southerly flow of approaching winter storms.
The relatively flat Ventura County coast is located between the coastal mountain chains of the Santa Ynez Mountains to the north (i.e., near Santa Barbara) and the Santa Monica Mountains to the south (i.e., near Malibu). Two rivers discharge to the Pacific Ocean from Ventura County: the Ventura River’s outlet is located just north of the city, and the Santa Clara drains into the ocean just south of the city. Several smaller creeks that originate in the surrounding mountains feed these two rivers, which have a total drainage area of approximately 4500 km2.
The City of Los Angeles extends mainly southeast of the Sulphur Mountain NEXRAD (KVTX) location. Figures 6.1–6.4 show the main geographic features of the region approximately to the east, southeast, southwest, and west, respectively, as seen from the site of the Sulphur Mountain radar. Figure 6.2 includes a view of the Los Angeles basin and metropolitan area; Los Angeles International Airport is in the direction of 125° from the north. Of the major rivers in Los Angeles County, the Santa Clara River originates in Los Angeles County and then flows into Ventura County, and the Los Angeles and San
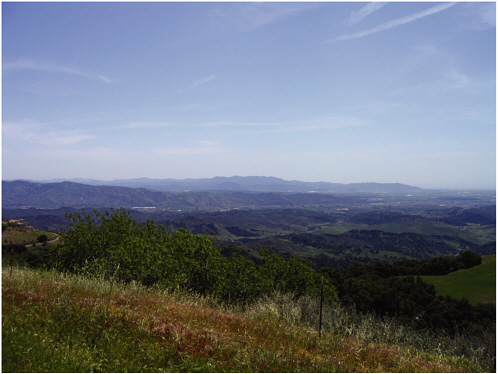
FIGURE 6.1 Photograph taken on March 29, 2004, from the site of the Sulphur Mountain NEXRAD looking approximately east-southeast. SOURCE: Julie Demuth, National Research Council.
Gabriel Rivers flow into the ocean. The latter two rivers have a total drainage area of 3056 km2.
The forecast process requires a forecaster to be cognizant not only of the antecedent hydrological and current meteorological conditions that may trigger a flash flood, but also of modifications of approaching weather systems as they impinge on the complex, mountainous terrain surrounding the highly populous urban areas in southern California. The impact of urbanization on both weather patterns and water runoff and the potential for recent fire-burned regions to modify watershed response and runoff must
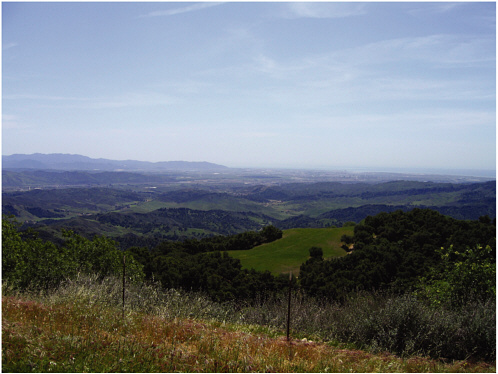
FIGURE 6.2 Photograph taken on March 29, 2004, from the site of the Sulphur Mountain NEXRAD looking approximately southeast toward the City of Los Angeles. SOURCE: Julie Demuth, National Research Council.
also be factored into the flash flood warning process. When it becomes clear that the conditions are ripe for the potential for flash flooding, the NWS Los Angeles-Oxnard Weather Forecast Office (WFO) has the primary responsibility for issuing flash flood warnings to the public. The process for communicating and disseminating warnings to the community is complex, involving not only the NWS, but other government and private agencies as well. The end-to-end process of formulating, issuing, and disseminating flash flood forecasts, watches, and warnings to the Los Angeles and Ventura County communities is documented in the following sections.
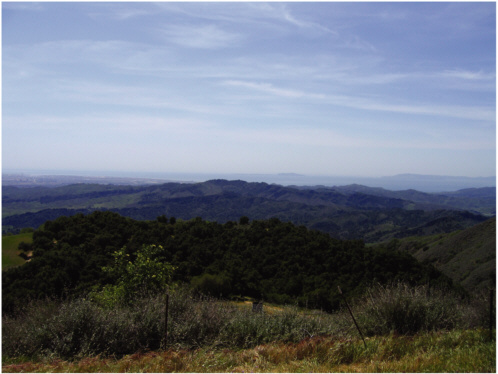
FIGURE 6.3 Photograph taken on March 29, 2004, from the site of the Sulphur Mountain NEXRAD looking approximately southwest toward the westernmost part of Los Angeles (left) and toward the Pacific Ocean and the Channel Islands (center, right). SOURCE: Julie Demuth, National Research Council.
RAINFALL RECORDS FOR LOS ANGELES AND VENTURA COUNTIES
The rainy season in Southern California occurs from November through March, as shown by the tables of average monthly rainfall (Tables 6.1 and 6.2) and average number of days per month with measurable precipitation (Table 6.3). These tables are based on data from the National Climatic Data Center and the Southwest Regional Climate Center for a sampling of stations. Monthly record precipitation amounts (Table 6.4) and daily record precipitation by month (Table 6.5) indicate that the winter months generally are the ones with heaviest rainfall. However, heavy rains occasionally fall in other
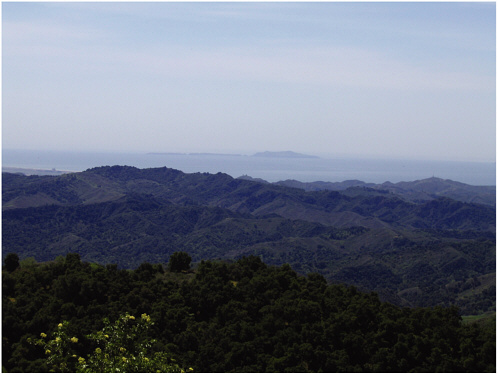
FIGURE 6.4 Photograph taken on March 29, 2004, from the site of the Sulphur Mountain NEXRAD looking approximately west-southwest over the Pacific Ocean and toward the Channel Islands. SOURCE: Julie Demuth, National Research Council.
months, sometimes from thunderstorms or tropical weather systems. Haynes (2001) studied storms that produced at least 3 inches of rain at three or more stations in Southern California and found that most occurred from November through March (Figure 6.5). Table 6.6 illustrates the same information for events of 4 inches or more.
Highest measured precipitation events in Southern California include more than 24 inches in 24 hours (at Haynes Canyon) in mountainous regions. Even with precipitation measured by many rain gauges, actual precipitation measurements still are available for only a small fraction of the overall area of Southern California; thus, it is possible that the largest pre-
TABLE 6.1 Los Angeles Area Average Precipitation (Inches), 1971–2000
|
|
Long Beach |
Los Angeles Airport |
Los Angeles Civic Center |
Santa Barbara |
|
January |
2.95 |
2.98 |
3.33 |
3.57 |
|
February |
3.01 |
3.11 |
3.68 |
4.28 |
|
March |
2.43 |
2.40 |
3.14 |
3.51 |
|
April |
0.60 |
0.63 |
0.83 |
0.63 |
|
May |
0.23 |
0.24 |
0.31 |
0.23 |
|
June |
0.08 |
0.08 |
0.06 |
0.05 |
|
July |
0.02 |
0.03 |
0.01 |
0.03 |
|
August |
0.10 |
0.14 |
0.13 |
0.11 |
|
September |
0.24 |
0.26 |
0.32 |
0.42 |
|
October |
0.40 |
0.36 |
0.37 |
0.52 |
|
November |
1.12 |
1.13 |
1.05 |
1.32 |
|
December |
1.76 |
1.79 |
1.91 |
2.26 |
|
Annual |
12.94 |
13.15 |
15.14 |
16.93 |
|
SOURCE: The National Climatic Data Center (NCDC). |
||||
TABLE 6.2 Other Stations, Variable Lengths of Record
|
|
Riverside |
Rancho Cucamonga |
Orange |
Oxnard |
|
January |
2.1 |
2.4 |
2.7 |
2.9 |
|
February |
2.0 |
2.2 |
2.4 |
2.4 |
|
March |
1.7 |
2.1 |
2.5 |
2.0 |
|
April |
0.8 |
1.1 |
1.0 |
0.8 |
|
May |
0.2 |
0.4 |
0.2 |
0.1 |
|
June |
0.1 |
0.1 |
0.1 |
<0.1 |
|
July |
0.1 |
0.1 |
<0.1 |
<0.1 |
|
August |
0.2 |
0.2 |
0.1 |
0.1 |
|
September |
0.3 |
0.4 |
0.2 |
0.3 |
|
October |
0.4 |
0.5 |
0.3 |
0.2 |
|
November |
0.9 |
1.5 |
1.3 |
1.5 |
|
December |
1.5 |
1.9 |
1.8 |
1.7 |
|
Annual |
10.1 |
12.7 |
12.6 |
12.0 |
|
SOURCE: Southwest Regional Climate Center. |
||||
TABLE 6.3 Los Angeles Area Average Number of Days with Precipitation, 58–67 Years of Data
|
|
Long Beach |
Los Angeles Airport |
Los Angeles Civic Center |
Santa Barbara |
Riverside |
Rancho Cucamonga |
|
January |
6 |
6 |
6 |
6 |
6 |
6 |
|
February |
5 |
6 |
6 |
6 |
6 |
5 |
|
March |
5 |
6 |
6 |
6 |
6 |
7 |
|
April |
3 |
3 |
3 |
2 |
4 |
4 |
|
May |
1 |
1 |
1 |
1 |
1 |
2 |
|
June |
<1 |
1 |
1 |
1 |
1 |
1 |
|
July |
<1 |
1 |
<1 |
1 |
1 |
1 |
|
August |
<1 |
<1 |
1 |
<1 |
1 |
1 |
|
September |
1 |
1 |
1 |
1 |
1 |
1 |
|
October |
2 |
2 |
2 |
2 |
2 |
2 |
|
November |
3 |
3 |
3 |
3 |
3 |
4 |
|
December |
5 |
5 |
5 |
5 |
5 |
5 |
|
Annual |
31 |
35 |
35 |
33 |
37 |
39 |
|
SOURCE: Southwest Regional Climate Center. |
||||||
TABLE 6.4 Monthly Record Precipitation Amounts
|
|
Long Beach |
Los Angeles Airport |
Santa Barbara |
Oxnard |
Riverside |
Orange |
Rancho Cucamonga |
|
January |
12.8 |
10.0 |
13.0 |
13.2 |
9.0 |
12.6 |
11.2 |
|
February |
9.4 |
12.4 |
13.6 |
13.8 |
8.9 |
11.7 |
10.5 |
|
March |
8.8 |
8.1 |
11.4 |
7.6 |
6.1 |
10.2 |
8.1 |
|
April |
4.4 |
9.9 |
5.8 |
4.2 |
4.6 |
5.4 |
4.8 |
|
May |
2.3 |
3.6 |
1.8 |
1.0 |
2.1 |
1.2 |
2.5 |
|
June |
0.9 |
1.1 |
0.5 |
0.6 |
0.9 |
1.0 |
0.7 |
|
July |
0.2 |
<0.1 |
0.9 |
0.2 |
1.5 |
0.3 |
0.4 |
|
August |
2.0 |
0.4 |
1.9 |
1.2 |
2.4 |
0.8 |
2.2 |
|
September |
1.4 |
5.7 |
4.1 |
5.0 |
3.0 |
2.2 |
3.9 |
|
October |
1.6 |
2.3 |
2.4 |
2.2 |
2.9 |
1.7 |
3.0 |
|
November |
6.0 |
6.0 |
6.9 |
6.4 |
5.6 |
6.7 |
8.0 |
|
December |
5.3 |
8.5 |
5.9 |
5.3 |
6.1 |
5.5 |
7.8 |
|
Annual |
27.7 |
31.3 |
40.7 |
29.9 |
24.0 |
31.4 |
28.8 |
|
SOURCE: Southwest Regional Climate Center. |
|||||||
TABLE 6.5 Most Rain Reported in a Day
|
|
Riverside |
Rancho Cucamonga |
Long Beach |
Los Angeles Airport |
Los Angeles Civic Center |
Santa Barbara |
Oxnard |
|
January |
3.1 |
4.0 |
3.75 |
4.56 |
5.71 |
4.02 |
5.96 |
|
February |
2.4 |
2.3 |
2.78 |
3.91 |
4.25 |
3.97 |
4.29 |
|
March |
2.4 |
2.2 |
3.46 |
3.10 |
5.87 |
4.73 |
4.60 |
|
April |
1.6 |
1.6 |
1.61 |
1.35 |
2.74 |
2.83 |
2.00 |
|
May |
1.1 |
1.5 |
2.03 |
1.67 |
2.02 |
1.16 |
1.35 |
|
June |
0.9 |
0.5 |
0.48 |
0.74 |
0.76 |
0.41 |
0.62 |
|
July |
1.4 |
0.3 |
0.26 |
0.28 |
0.13 |
0.91 |
0.58 |
|
August |
1.7 |
1.9 |
1.75 |
2.09 |
2.06 |
0.98 |
0.89 |
|
September |
2.1 |
3.3 |
1.39 |
1.66 |
3.95 |
3.01 |
3.72 |
|
October |
1.1 |
1.6 |
1.81 |
1.75 |
1.71 |
2.39 |
1.74 |
|
November |
2.1 |
3.8 |
2.03 |
5.60 |
3.85 |
3.69 |
3.78 |
|
December |
2.7 |
3.9 |
3.16 |
2.84 |
4.85 |
3.28 |
5.10 |
|
Annual |
3.1 |
4.0 |
3.75 |
5.60 |
5.87 |
4.73 |
5.96 |
|
SOURCE: Southwest Regional Climate Center. |
|||||||
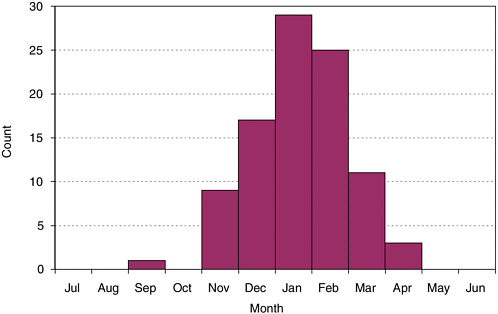
FIGURE 6.5 Monthly distribution of heavy rainfall in which at least three stations in Southern California had at least 3 inches of rain. SOURCE: Haynes (2001).
TABLE 6.6 Days with at Least 4.00 Inches of Rain at One of the Stations Listed in Table 6.5
|
Date |
Location (Rainfall Amount in Inches) |
|
January 17, 1918 |
Los Angeles Civic Center (4.16) |
|
January 24, 1967 |
Santa Barbara (4.02) |
|
January 26, 1956 |
Oxnard (5.96), Los Angeles Civic Center (5.71), LAX (4.56) |
|
February 8, 1962 |
Oxnard (4.29) |
|
February 18, 1914 |
Los Angeles Civic Center (4.25) |
|
March 2, 1938 |
Los Angeles Civic Center (5.87) |
|
March 8, 1968 |
Oxnard (4.60) |
|
March 15, 2003 |
Santa Barbara (4.73), Los Angeles Civic Center (4.10) |
|
March 18, 1991 |
Santa Barbara (4.46) |
|
November 21, 1967 |
LAX (5.60) |
|
December 5, 1997 |
Oxnard (5.10) |
|
December 20, 1964 |
Oxnard (4.44) |
|
December 31, 1933 |
Los Angeles Civic Center (4.85) |
|
SOURCE: Southwest Regional Climate Center. |
|
cipitation event may not have been measured. In fact, hydrologists (Corrigan et al., 1999) have estimated the probable maximum precipitation1 over Southern California to be in excess of 30 inches in 24 hours for the foothills and mountainous regions, with the largest value in excess of 48 inches.
THE NWS LOS ANGELES-OXNARD FLASH FLOOD WARNING PROCESS
During the several days prior to the onset of heavy rainfall in the Los Angeles basin, forecasters at the NWS LOX office monitor weather patterns around the hemisphere to detect weather systems that may affect Southern California. They make heavy use of numerical weather prediction model guidance and their own experience to forecast the timing and amount of upcoming precipitation. During this period, they contact emergency management officials (i.e., California Office of Emergency Services) to alert them to the possibility of an upcoming heavy rainstorm. The LOX office may issue flash flood and flood watches to indicate future risks of severe weather to the public. Watches of this type are disseminated on the National Oceanic
& Atmospheric Administration (NOAA) and NWS data circuits and are received by the media and private sector meteorologists for dissemination to the public. The watches are also broadcast on NOAA Weather Radio and displayed on NWS web sites.
Once precipitation is more imminent, the warning process becomes focused on the detection and monitoring of heavy rainfall areas using radar and satellite information and on using these and other observed and forecast data to predict where and when flooding may occur. For the Los Angeles area—where flooding develops quickly both in urban drainage areas and along steep terrain slopes—flash flood warnings are usually issued when the heaviest precipitation bands are offshore to give the public and other users adequate warning times. The NWS Advanced Weather Interactive Processing System (AWIPS) software tracks radar-identified storm cells and projects them forward in a forecast for the next hour.
The main reason the LOX office is forced to issue flash flood warnings an hour or more before heavy rain gets to the potential flood area is that the region is “flashy”—that is, the response time for streams in the area can be as little as 10 minutes from heavy rainfall to flooding. Only at the mouths of the major rivers in the Los Angeles area do response times exceed 2 hours. Thus, in most places, to obtain a flash flood warning lead time of an hour requires that a warning be issued about an hour before the heavy rain begins.
The LOX office obtains flash flood guidance values from the NWS California-Nevada River Forecast Center in Sacramento, California, and from the Ventura County Watershed Protection District (Table 6.7). The LOX office Service Hydrologist provides additional analysis of the situation. These guidance values indicate the rainfall rates and accumulated amounts needed to cause flooding at various locations in the forecast area. The LOX office then combines these guidance values with short-term forecasts of rainfall rate and accumulation to issue warnings of flash floods, urban floods, and slower-moving floods for various locations in the Los Angeles and Ventura County areas. LOX forecasters also monitor rain gauge and stream gauge reports, such as the Automated Local Evaluation in Real Time (ALERT) system (described later in this chapter), and feedback from spotters and emergency managers to indicate how much rain has fallen and where flooding is occurring. There are about 600 spotters trained by LOX forecasters to assist them by reporting severe weather and flooding.
When LOX forecasters determine that a flash flood warning is necessary, a warning is issued indicating the county or counties in which flooding is imminent or in progress, listing the specific locations most at risk. The
TABLE 6.7 An Example of a Hydrologic Conditions Report Issued for Ventura County by Its Watershed Protection District for February 23, 2004
|
Rainfall Rate or Accumulation |
Results |
|
>0.5 in. h–1 or 1.0 in per 3 h |
Could cause mud and debris flows:
|
|
>0.6 in. h–1 for 30 minutes or longer |
Urban flooding in Oxnard near Hwy 101 bridge |
|
>0.6 in. h–1 |
Urban flooding Ventura RV Park, Meiners Oaks, Casitas Springs, San Antonio Creek |
|
>0.7 in. h–1 |
|
|
>0.7 in. h–1 for extended |
Urban flooding problems in Simi Valley, Thousand Oaks, Moorpark and duration Camarillo. |
|
>3.0 in. per 6 h at Hopper Mountain (ALERT 662) |
Flood problems at 4th Street and Island View Street in Fillmore along Pole Creek. |
|
>4.0 in. per 6 h |
|
|
>5.0 in. per 6 h |
Could cause problems along Tapo Canyon in Simi Valley and at Las Llajas Dam |
|
>6.0 in. per 8 h |
Could cause damage at the Simi Sanitation Plant below Simi Valley |
|
>8.0 in. |
Problems Hwy 1—Pacific Coast Highway, Local Canyon Roads |
|
>8.0 in. per day |
Flooding on the Lower Calleguas Creek and/or Conejo Creek possible |
|
Additional 10–14 in. in the upper watershed |
Major problems along the Ventura River and tributaries |
warning message is disseminated to NOAA data circuits for distribution to the media and private sector meteorologists and dissemination to the public. The warning is also disseminated to the Emergency Activation System (EAS) network, which is received by the headquarters of the California Office of Emergency Services (CA OES) and then disseminated to its field offices. LOX contacts the CA OES by telephone to ensure that the message has been received. The warning also is broadcast on NOAA Weather Radio. Transmitters are positioned at several locations throughout a NWS office’s area of responsibility. Thus, nearly all residents can receive the information if they own the proper receiving equipment, although only a fraction of citizens rely on NOAA Weather Radio for warning information. Law enforcement and emergency management agencies can receive information from this source, but they may also receive it over the EAS or be contacted directly by the LOX office. In dangerous weather situations that have been predicted well in advance, additional NWS staff or community volunteers (e.g., ham radio operators) are sometimes present in the LOX office to assist with communications.
PRIVATE SECTOR ROLE IN FORECASTS AND DISSEMINATION
The NWS flash flood watch and warning statements are disseminated to the public, emergency managers, and law enforcement officials both directly and indirectly (e.g., through the media). The media play a crucial role in disseminating flash flood and urban flood warnings to the public. In addition, meteorologists in the private sector issue advisories and provide other relevant information to the public and other clientele. This group, sometimes referred to as the commercial weather industry (CWI), plays a vital role in conveying weather information to the public and other commercial and government clientele.
CWI meteorologists, sometimes employed by local television stations or operating remotely from a commercial weather service, generally have access to the same weather data and numerical model guidance as do forecasters at the local NWS WFO. CWI meteorologists generally have no access to the exact radar information displayed in the WFO, but they may have alternative and even comparable display systems. Some may have access only to radar data with slightly coarser resolution than in the NWS office and only to a subset of the full suite of scans at various elevation angles. Other CWI meteorologists, however, have their own weather radar and possibly networks of spotters who report rainfall amounts and observations of flooding. Most private sector meteorologists pass along warnings
being transmitted by the NWS in addition to their own assessment of the situation. There are nearly two dozen commercial television stations in Southern California, with at least one operating its own weather radar.
Private weather firms play important roles in the hydrological services of the Los Angeles area as well. For example, Fox Weather LLC provides detailed precipitation forecasts to the Ventura County Watershed Protection District. This information is used in water management activities and in anticipation of heavy rainfall events and flooding. Each county in Southern California employs hydrologists, who often assist the NWS by providing flash flood guidance for locations within their counties.
STAKEHOLDERS
The LOX forecasting area includes Los Angeles County, San Luis Obispo County, Santa Barbara County, and Ventura County. Los Angeles and Ventura Counties have two of the larger populations in the United States with approximately 9.8 million and 0.8 million people, respectively. On the smaller end, the populations of San Luis Obispo and Santa Barbara Counties, respectively, are approximately 250,000 and 400,000. Combined, the total population for which LOX is responsible is about 11.3 million people, nearly one-third of California’s total population (CADOF, 2002).
Ventura County is home to 10 municipalities—among them, the cities of Ojai, Oxnard, and San Buenaventura (Ventura)—as well as numerous other unincorporated communities, all of which total an area of 4779 km2 (CADOF, 2002). Within the county’s Public Works Agency is the Ventura County Watershed Protection District (VCWPD), which, until January 2003, was known as the Ventura County Flood Control District. The VCWPD exists to “…protect life, property, watercourses, watersheds, and public infrastructure from the dangers and damages associated with flood and stormwaters” (VCWPD, 2004). With a population of more than three-quarters of a million people, the county is becoming increasingly urbanized, making the district’s task of monitoring watersheds and controlling floodwaters, and LOX’s task of flash flood forecasting and warning, increasingly important.
The Ventura County warning system monitors a total of 6825 km2, which encompasses the Santa Clara River, including Sespe Creek (4175 km2); Calleguas Creek, including Revolon Slough (834 km2); and the Ventura River (290 km2). To monitor this region, the VCWPD relies heavily on the ALERT storm watch system (Box 6.1), which includes data from more than 60 rain gauges and 30 stream gauges in Ventura County (Figure 6.6). An additional 104 precipitation and 47 stream gauges also monitor conditions but do not transmit data in real-time. Compared to Ventura County, Los
|
BOX 6.1 The ALERT system was developed by the NWS California-Nevada River Forecast Center in the late 1970s (NWS, 1997) with the intention of providing local communities with a low-cost means of acquiring real-time rainfall and streamflow data to better evaluate flood potential. The ALERT system consists of in situ instruments designed to meet a common set of communications criteria. Components of the ALERT system particularly relevant for flash flood forecasting include precipitation and stream gauges (see Figure 6.6). The ALERT precipitation gauge is a standard tipping bucket design. When the buckets tip, a signal is sent to a central ALERT command center, which in turn transmits the information to a flood control district office. Based on the history of precipitation at each ALERT station, an alarm will sound when the amount of precipitation reaches a threshold value that is known to result in flooding. Similarly, when river levels reach a predetermined stage, flood stage sensors send information to the flood control district offices and the local office of the NWS. The NWS issues flash flood watches and warnings accordingly. Real-time data also go directly to the county’s Emergency Operations Center and county road crew supervisors to prepare them for the potential of flash flooding. 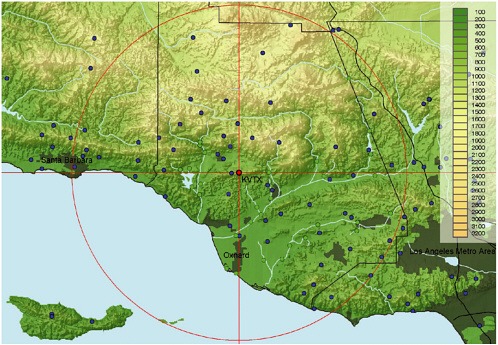 FIGURE 6.6 Topographic map of Ventura County and neighboring Los Angeles and Santa Barbara Counties showing the ALERT rain (blue dots) and stream (green dots) gauges. For reference purposes, the location of the Sulphur Mountain NEXRAD is denoted by the red dot, and its 50-km radius is denoted by the red circle. SOURCE: Image created by Witold Krajewski, University of Iowa. Rain and stream gauge latitude and longitude coordinates from the Ventura County Watershed Protection District. |
Angeles County is only twice as large physically—with a total land area of 10,517 km2—but it houses more than 12 times as many people (CADOF, 2002). The Department of Public Works Watershed Management Division has four main sections dedicated to managing the following major watersheds: Los Angeles River, San Gabriel River, Ballona Creek-Malibu Creek-Dominguez Channel, and Santa Clara River-Antelope Valley. The Los Angeles County Department of Public Works maintains and operates a flood monitoring system consisting of 100 automatic recording tipping bucket rain gauges, 94 of which are on the ALERT system, and nearly 200 nonrecording rain gauges that are observed once daily (LADPW, 2004).
NEED FOR MULTIAGENCY AND PUBLIC COLLABORATION
The NWS is the only agency that has the legal responsibility and authority to issue flash flood warnings. However, a review of the newspaper coverage of flash floods and warnings for Los Angeles and Ventura Counties reveals that numerous local, state, and federal agencies as well as nonprofits and private interest groups are communicating with the public about the risks and appropriate actions to take. A review of the broadcast media would probably also highlight numerous other agencies and parties providing information to the various “publics” in the greater Los Angeles metropolitan area.
While the role of the NWS in producing flash flood forecasts and warnings through the use of NEXRAD and other forecasting tools is essential to the decision-making process for warnings, the public is bombarded with a wide range of information from alternative sources as flash flood situations develop. The watershed districts that operate and maintain the ALERT systems do not officially interact with the public. They are in contact with emergency managers and public officials throughout the region. They use an extensive network of real-time ALERT stream and rain gauge data, a private meteorological service, and their own interpretations of hydrologic models. At the federal level, many agencies are involved and also provide real-time data to enhance the ALERT system. These include the U.S. Geological Survey, the U.S. Forest Service, the Bureau of Land Management, the National Park Service, and the U.S. Army Corps of Engineers. The use of NEXRAD and AWIPS technologies together with forecasting experience allows forecasts and warnings to be made for the counties affected by hazardous weather that develops over the ocean.
The at-risk public must be prepared to take the initiative during a flash flood. Environmental cues, such as intense rainfall for an extended period of time or rainfall when the ground is already saturated, are unofficial warnings.
For example, in January 2004 San Bernadino County—which is outside the LOX WFO’s jurisdiction—sent out 113,000 warning letters to residents and property owners advising them that mudslides, debris flows, and flash floods would likely occur with little or no warning with each rainfall for at least the next few years. This action was taken following several bad fires in the area; this “warning” for Southern California may be extended if current dry conditions persist (San Bernardino County Public Information Office, 2004). The decision to alert the public via a letter points out how particularly difficult it is to precisely issue official timely warnings of flooding in areas where watersheds have been significantly altered by extensive burns. One may also wonder what role these messages play in the public’s perception of flash flood threats and its willingness to take, or not to take, timely actions when flash floods are imminent.
The warning process is complex and involves the NWS and many others working together to provide timely dissemination of flash flood warnings to the community in a format that both is useful and elicits an appropriate, anticipatory response by the stakeholders and the public at risk.
|
Recommendation: NWS Weather Forecast Offices nationwide, including the Los Angeles-Oxnard Weather Forecast Office, should continue to expand their collaborative efforts with key stakeholders (e.g., county, police, and emergency management officials) to enhance the effectiveness of flash flood forecasts, watches, and warnings. The committee commends the Los Angeles-Oxnard WFO on its efforts to communicate with local emergency management officials and the media about potential flash flood situations. However, the committee was informed that the criteria for issuing flash flood warnings are not always sufficient to address all the specific needs of a WFO’s end-user community. Existing and new tools—such as geographic information systems (GIS) and the Flash Flood Monitoring and Prediction (FFMP) program, polarimetric radar, and ensemble probabilistic modeling—will make it possible to provide warnings with improved specificity. Moreover, forecasts formulated in a manner analogous to the NWS convective outlooks and with an event severity index analogous to the Fujita scale for tornadoes would provide useful indications of the magnitude of threats. Flash flood forecasts couched in probabilistic terms also would be a useful way to convey uncertainty |
|
information. Advanced technologies enable new ways of displaying and communicating individualized warnings to improve the efficiency of the warning process. In the spirit of the recent National Research Council report, Fair Weather (NRC, 2003), this should be done in cooperation with the private sector. In addition, in partnership with the media and emergency management officials, the NWS should continue to educate the public about the risks of flash flooding. |


