
7
Evaluation of the Sulphur Mountain Radar and Flash Flood Warnings in Los Angeles and Ventura Counties
As discussed in Chapter 5, the beam visibility of radars sited in complex terrain can suffer from a combination of complete and partial beam blockage, which varies with azimuth depending on the surrounding orography. The visibility of low-level precipitation also is limited by Earth’s curvature and, in the case of NEXRAD, by the current restriction to a minimum antenna elevation angle of 0.5°. More fundamentally, the operational effectiveness of a radar also depends on its availability—that is, whether or not it is functioning properly. Both of these aspects have been among the main criticisms of the Sulphur Mountain NEXRAD. For instance, some have questioned the radar’s capability to detect low-level weather systems (i.e., below 1.83 km or 6000 ft), including Paris (1997a, 1997b, 1998, 2001), The Rose Institute (1997, 1998), and Fox (2003). Moreover, the General Accounting Office (GAO, 1998) concluded that the Sulphur Mountain radar was not consistently available, increasing the risk that the radar data may be unavailable to the National Weather Service (NWS) and other users when needed for flash flood forecasting and warning purposes. This chapter provides a comprehensive analysis of coverage provided by the Sulphur Mountain NEXRAD and its availability to address these concerns.
RADAR COVERAGE
Sulphur Mountain
Figure 7.1 shows the relief in the 50-km vicinity of the Sulphur Mountain radar location. There are considerably higher mountains to the west, north, and east of the radar site. To the north, the mountainous region includes the Topatopa Mountains with the Hines Peak of 2043 m MSL (above mean sea level) and the Pine Mountain ridge a little further northwest with an eleva-
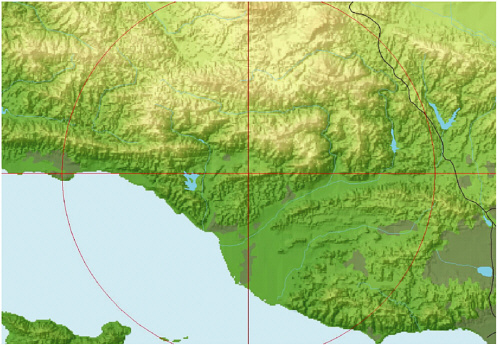
FIGURE 7.1 The location of the Sulphur Mountain NEXRAD radar (at the crosshairs) and its 50-km vicinity (the red ring). SOURCE: Witold Krajewski, University of Iowa.
tion of about 2000 m MSL. These mountain chains constitute the southern edge of the Los Padres National Forest. Immediately to the east, the Santa Paula Ridge presents the highest peak of 1511 m MSL. To the west, the Santa Ynez Mountains extending in the west-east direction feature several peaks of about 1500 m MSL. To the south, a small South Mountain separates Sulphur Mountain, at an elevation of 829 m, from the coastal Santa Monica Mountains that reach elevations greater than 800 m MSL.
The surrounding orography causes blockage of the beam from the Sulphur Mountain NEXRAD in some directions, especially to the north. A west-east mountain range 10 km to the north of the radar essentially blocks the lower elevation angles over a considerable sector extending from about
300° to 90°, where 0° is to the north. Another small hill immediately to the west partially blocks the radar beam. The radar enjoys an “open view” of the southern sector, which covers directions toward Los Angeles International Airport and the main part of the city and toward the direction of many approaching storms from the Pacific Ocean.
The committee performed detailed calculations of low-level radar coverage and partial beam blockage using high-resolution (i.e., 30-m) digital elevation model (DEM) data and assuming standard atmosphere propagation conditions. These calculations consider the width of the beam and account for the fact that the radar power is concentrated near the beam axis and falls off approximately following a Gaussian function. The calculations consider main beam power loss only, meaning that they do not account for the much lower-intensity sidelobes (i.e., weaker beams that radiate from the antenna in directions away from the main beam). Detailed integration of the power distribution within a beam that may be partially blocked by the terrain allows determination of the percentage of the power loss as a function of distance from the radar. Figure 7.2 shows a conceptual representation of the integration process; for details of the procedure, see Kucera et al. (2004).
The calculations performed by the committee are more realistic than those by Paris (1997a; 1997b; 1998; 2001) in that they account for the entire three-dimensional shape and size of the radar beam; Paris’s calculations only considered the location of the main axis of the radar beam. The terrain data used by the committee are also of higher resolution, which has some effect on the results. The committee’s calculations do not account for the variable atmospheric conditions that can cause anomalous propagation of the radar beam. However, the committee analyzed a large sample of actual Level II (Crum et al., 1993; Crum et al., 1998) reflectivity data from the Sulphur Mountain radar and concluded that our calculations well represent the essential features of the radar coverage.
The committee performed the calculations for three antenna elevation angles: 0.5°, 0.0°, and –0.5°. According to the current practice of all NEXRADs operated by the NWS, the lowest antenna elevation angle is 0.5°, which forms the “base” scan. The committee’s calculations confirm that, at the 0.5° base scan elevation angle, the beam axis rises to 6000 ft MSL at about a 75-km range from the radar. However, half of the beam is still below that level at this range; thus, to infer that there is no coverage below 6000 ft is not correct. The lower half-power (3 dB) point of the beam does not pass above the 6000-ft level until approximately a range of 125 km. Calculations further reveal that using the 0.5° antenna elevation angle, the radar beam pointed in the direction of the Santa Ynez Mountains is only
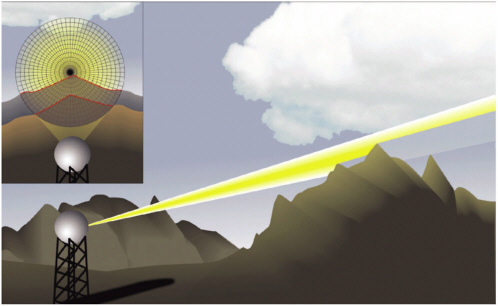
FIGURE 7.2 Schematic representation of the beam power loss integration. The varied intensity of the yellow color signifies the fact that more power is concentrated near the beam axis. SOURCE: Witold Krajewski, University of Iowa.
partially blocked. For example, the beam loses only about one-quarter of the echo power (i.e., assuming a beam-filling target) in the direction of 280° from the north (Figure 7.31).
In the direction of the open ocean at the same antenna elevation angle and at a range of about 100 km from the radar, the beam “illuminates” a portion of the atmosphere that extends from 1.5 km to slightly more than
|
1 |
The mean-sea-level contour of Earth’s surface curves down and away from any given point. Under standard conditions of atmospheric refraction, a microwave beam launched horizontally from a point also curves slightly downward with distance. To simplify illustrations such as Figure 7.3, radar specialists commonly depict Earth’s surface as flat and show the heights of the beams of interest above that surface. Thus, the radar beams appear to curve upward in the diagrams. The height of the beams is shown correctly, even though neither the surface nor the beams themselves are accurately portrayed. |
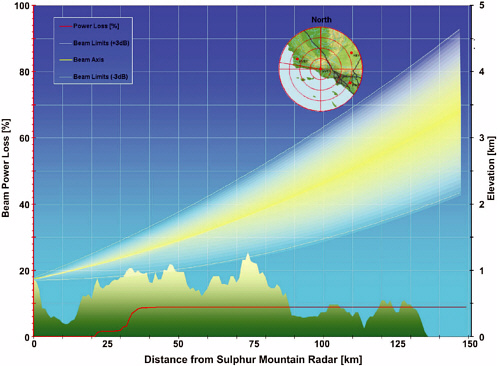
FIGURE 7.3 Sulphur Mountain NEXRAD (KVTX) 0.5° beam and terrain profile in the direction of the Santa Ynez Mountains (280° from the north). SOURCE: Witold Krajewski, University of Iowa.
3 km in the vertical. At the range of 150 km the corresponding portion extends from 2.25 to 4.75 km. Coverage down to the typical altitude of the low-level jet (about 1 km) is restricted to ranges of a few tens of kilometers.
Some researchers (Brown et al., 2002; Wood et al., 2003a, 2003b) have suggested using 0.0° or even negative elevation angles for radars sited at higher elevation, so the committee explored this concept for the Sulphur Mountain radar. By lowering the antenna to the horizontal (0.0°) position, the respective altitude coverage ranges would be 600 m to 2.3 km at a range of 100 km and 1 to 3.5 km at a range of 150 km. This would provide beam-axis coverage at or below 6000-ft altitude all the way out to 125 km as well as some detection capability at the 1-km level out to nearly 150 km. Slightly
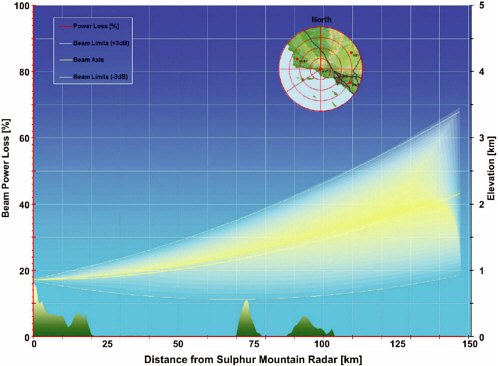
FIGURE 7.4 KVTX radar 0.0° beam and terrain profile in the direction of the Santa Cruz Island of the Channel Islands. SOURCE: Witold Krajewski, University of Iowa.
negative elevation angles could be used to extend the low-level coverage farther out over the water, though with a concomitant increase in beam blockage in some directions. In addition, there would be some increase in side-lobe clutter. Figure 7.4 shows a relevant cross section in the direction of the Santa Cruz Island of the Channel Islands. Lowering the antenna elevation to 0.0° would cause some power loss (i.e., up to about 30 percent) in the beam in the direction of Catalina Island but only over a very narrow sector of about 6° (see Figure 7.5). The direction toward Los Angeles International Airport would remain unaffected (Figure 7.6). Since the radar is situated at an elevated site, the beam would remain well above the ground on its way toward the open waters.
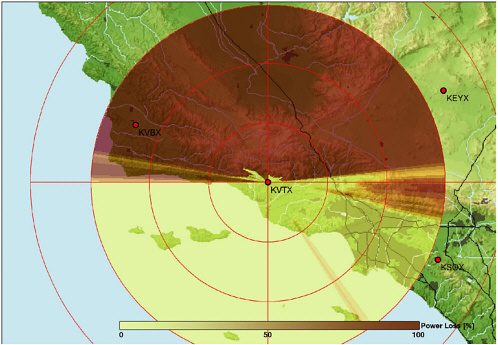
FIGURE 7.5 Power loss distribution of the Sulphur Mountain NEXRAD (KVTX) at a beam elevation angle of 0.0°. Darker colors signify the extent of power loss. SOURCE: Witold Krajewski, University of Iowa.
In addition to Figures 7.3, 7.4, and 7.6, which show cross sections of the radar beam propagation and power loss at just a few azimuths and radar beam elevations, the committee completed calculations at every degree (i.e., 360 azimuths) for the radar beam at 0.5°, 0.0°, and –0.5° elevation. All 1080 of the calculations are available electronically from the following National Academies web site: http://dels.nas.edu/basc/nexradsm/radar_beam_and_terrain_viewer.html. This interactive presentation provides the user an opportunity to see how the Sulphur Mountain radar beam propagation and power loss change with direction based on three different beam elevation angles.
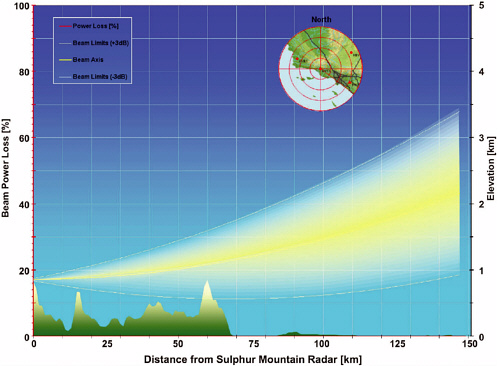
FIGURE 7.6 Cross section toward Los Angeles International Airport for 0.0° elevation angle. SOURCE: Witold Krajewski, University of Iowa.
Adjoining Radars
The detailed calculations performed by the committee for the Sulphur Mountain radar are very labor-intensive and time-consuming; thus, the committee did not repeat them at this level of detail to analyze the coverage from neighboring NEXRADs (i.e., Vandenberg Air Force Base [AFB], KVBX; Santa Ana Mountain, KSOX; San Diego, KNKX; Edwards AFB, KEYX). Instead, the committee performed simplified calculations, similar to those by Paris but using the higher-resolution DEM data and considering the width of the main lobe of the radar beam (i.e., not just the axis). This is a
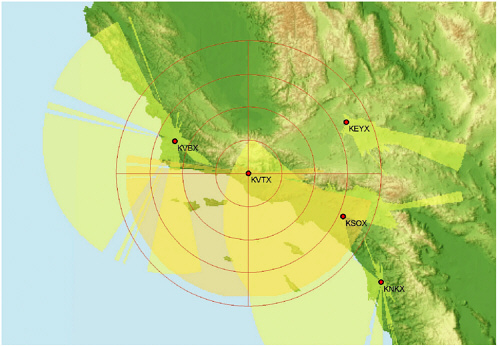
FIGURE 7.7 Southern California radar network coverage of the 0–3 km atmospheric layer. The light brown shaded region shows coverage provided solely by the Sulphur Mountain (KVTX) radar. The coverage shown is at different elevations, which depend on the distance from the respective radar. SOURCE: Witold Krajewski, University of Iowa.
conservative approach because it reveals only the completely unblocked coverage.
The results of these analyses are illustrated in Figure 7.7, which shows the coverage provided by each respective radar between 0 and 3 km (0 and 9843 ft) MSL. Coverage from the KVBX, KSOX, KNKX, and KEYX radars is shown in light yellow; coverage from the Sulphur Mountain radar is shown in dark yellow; and the area covered by the Sulphur Mountain radar but not by any other adjoining radar is shown in light brown. The latter reveals that the Sulphur Mountain radar provides sole coverage to its southwest, in (1) a north-south swath over some of the Channel Islands, including parts of the
Santa Cruz and Santa Rosa islands and (2) a north-northeast to south-southwest swath west of the Channel Islands. Although these areas are small, they are vital for providing coverage over a key area from which incoming weather systems approach. In addition, diagrams similar to Figure 7.3 would show that KVTX provides better low-level coverage over many areas near the Sulphur Mountain site than do any of the other radars. Figure 7.7 also shows that if the KSOX radar located south of Los Angeles ever fails, the Sulphur Mountain radar provides redundant coverage of the Los Angeles basin. Therefore, the Sulphur Mountain radar is sited in an appropriate position to provide unique, key coverage of the offshore waters.
AVAILABILITY OF THE SULPHUR MOUNTAIN RADAR
A National Weather Service standard exists for the satisfactory availability of all NEXRAD radar systems as outlined in the Weather Surveillance Radar-1988 Doppler Integrated Logistics Support Plan (NWS, 2002a). The operational availability (Ao) of a NEXRAD system is defined as the total operating and standby times (in hours) divided by the total possible time (i.e., 8760 hours per system per year), which is the sum of the total operating time, standby time, preventative maintenance downtime, corrective maintenance downtime, logistics delay down time, and administrative delay downtime. A variation of this measure is the service availability (As), which does not include downtime for preventative maintenance and is a more accurate reflection of the radar functionality; it is required to be no lower than 96.2 percent.
When the General Accounting Office (GAO, 1998) analyzed the Sulphur Mountain radar performance, its main criticism was that the radar was not consistently meeting the As requirement. Over the 30-month period analyzed by the GAO—from October 1995 through March 1998—the monthly average availability statistics were below 96.2 percent one-third of the time. The availability fell below 90 percent in four of those months, hitting a low of only 79.3 percent in February 1997. In the six months between the period examined by GAO and the time its report was released in October 1998, the monthly averaged availability of the Sulphur Mountain radar fell below the 96.2 percent threshold one other time (Figure 7.8). According to the NWS, the radar was not meeting the availability requirements primarily because of the delay that occurred when a part failed and had to be reordered and installed. The NWS responded to the GAO’s analysis by adopting several methods to reduce component failures and to monitor and expedite replacement (GAO, 1998).
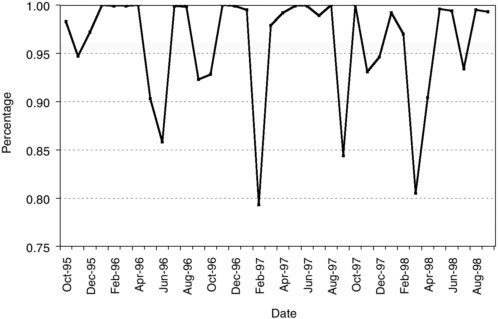
FIGURE 7.8 Monthly average service availability statistics for the Sulphur Mountain radar from October 1995 through September 1998. SOURCE: Compiled by Julie Demuth from data from the GAO (1998) and the National Oceanic and Atmospheric Administration (NOAA).
From the time of the release of the GAO report in October 1998 through December 2003, the monthly average service availability of the Sulphur Mountain radar fell below the 96.2-percent requirement only 4 months out of 63 (Figure 7.9), all of which were due to component failures. The availability of the radar averaged over this entire time period was 98.9 percent, indicating that the Sulphur Mountain radar now exceeds the NWS standard availability requirements and, therefore, is amply functional for use by the Los Angeles-Oxnard (LOX) Weather Forecast Office (WFO) for flash flood forecasting purposes.
FLASH FLOOD WARNING STATISTICS
A directives system exists within the NWS, the purpose of which is to translate the ideas, goals, and principles underlying the NWS mission and strategic goals into action-related items. Among the many areas defined by these directives is one that pertains to operations and services and, more
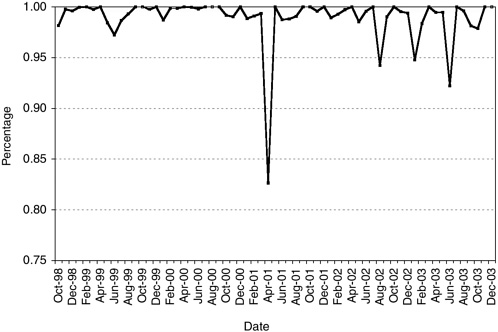
FIGURE 7.9 Monthly average service availability statistics for the Sulphur Mountain radar from October 1998 through December 2003. SOURCE: Compiled by Julie Demuth from NOAA data.
specifically, to performance. The objectives of the performance directive include, among other things, collecting data on significant events and measuring service quality and product accuracy (NWS, 2003b). Accordingly, a directive exists that outlines specific actions to verify various weather watches, warnings, and events, including flash flood warnings (NWS, 2004d). Specific details of the flash flood verification procedures are given in Appendix D.
The NWS uses a number of different measures for verification purposes, from simple, empirical analyses (i.e., number of warnings issued, number of flash flood events) to statistical measures of success (see Table D.2). The latter include the probability of detection (POD2) of an event and the false alarm ratio (FAR3); a higher POD and a lower FAR indicate better performance.
State of the Art
To conduct a thorough assessment of the performance of the LOX WFO and the efficacy of the Sulphur Mountain radar, it is important first to establish the “state of the art” by examining the performance of all 116 WFOs in the continental United States. Because installation of the NEXRAD network was completed by the end of 1995, the analysis period used here begins in 1996 and it runs through 2003 to provide a consistent examination of WFO performance using NEXRAD.
The total number of flash flood events that occurred for each WFO during this 8-year period is shown in Figure 7.10. The mode, comprised by 15 WFOs, including LOX, experienced between 25 and 50 flash flood events, for an average of about 3 to 6 events per year. Next most common was to have at least 1 but less than 25 flash flood events, which is the case for 14 WFOs. Of these 14 WFOs, 4 are on the West Coast in orographic regions: Eureka, California (1 flash flood event); Pendleton and Medford, Oregon (20 events each); and Sacramento, California (24 events). On the extreme ends of the spectrum, 3 WFOs recorded zero flash floods—including Seattle, Washington, and Portland, Oregon—and 13 WFOs experienced more than 500 flash flood events within their jurisdictions, including the Austin, Texas, WFO, which experienced 1020 flash floods for an average of more than 125 per year.
The average flash flood warning lead times, which are calculated as the time between the issuance of a flash flood warning and the first occurrence of the event in the warned county, are shown in Figure 7.11 for all WFOs. Once again, LOX, with an average flash flood lead time of 35 minutes, falls in the modal category, which has lead times between 30 and 40 minutes. Of the 116 WFOs, only 22 met the 2004 NWS goal of a 50-minute lead time for flash floods warnings.
During 1996–2003, the mean POD of flash flood events for all stations was 75.5 percent, and the POD for the modal category was between 90 and 95 percent (Figure 7.12). The LOX station is the same as the median value for this statistic, with a POD of 83 percent. Of the four WFOs with a zero probability of detection, three experienced no flash floods during this time and the other experienced only one event.
In comparison with the highly skewed POD distribution, the FAR is more normally distributed (Figure 7.13). Here, the LOX office falls below the median, indicating that it has a better record of not issuing flash flood warnings for events that fail to occur. Of the five WFOs with a FAR greater than 95 percent, four are the cases highlighted in the POD discussion
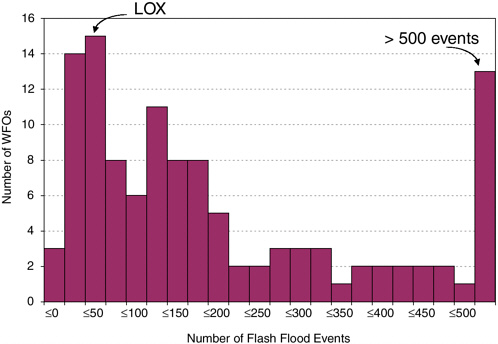
FIGURE 7.10 Histogram of the number of flash flood events occurring for all 116 NWS WFOs in the Continental United States for 1996–2003, after installation of all NEXRADs nationwide. During this time, 47 events occurred within the jurisdiction of the LOX office. The final bar represents the number of WFOs for which between 500 and 1020 flash flood events occurred within their jurisdiction. SOURCE: Compiled by Julie Demuth from NOAA data.
above, three of which had no flash floods and one of which had only one event. In the fifth case, the WFO issued 151 flash flood warnings, only 2 of which were verified. On the other hand, for the six WFOs with a FAR of less than 20 percent, the number of flash floods within their jurisdiction ranged from 91 to more than 500, indicating that their low FAR scores are due to skill and not to a small sample size.
LOX Warning Statistics
The Sulphur Mountain radar, along with the other Southern California radars and other aspects of the NWS modernization of the 1990s, has helped to significantly improve the flash flood warning performance of the
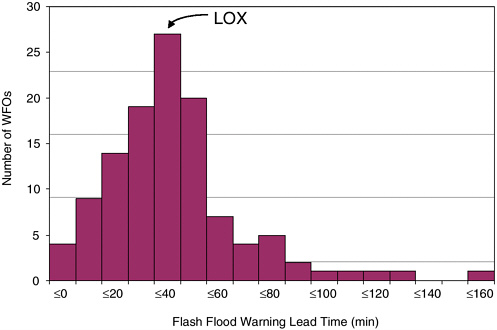
FIGURE 7.11 Histogram of the lead time—the time between the issuance of a flash flood warning and the occurrence of the flash flood—in minutes for all 116 NWS WFOs in the Continental United States averaged over 1996–2003, after installation of all NEXRADs nationwide. The average lead time of the LOX office is 35.0 minutes. SOURCE: Compiled by Julie Demuth from NOAA data.
LOX WFO. Figure 7.14 compares the key flash flood warning statistics for LOX from the pre-NEXRAD period 1986–1994 with those for the 1995–2003 period when NEXRAD was available. All of the statistical measures show improvement, with the POD, the proportion of events with warning lead times greater than zero, and the average lead time more than doubling. Much of this improvement can be attributed to the improved radar coverage available in the NEXRAD era.
The NWS database for 1995–2003 indicates that 15 of the 57 flash flood events that occurred were unwarned. The LOX WFO supplied information indicating that four of the “missed” events were not actually flash floods; one (occurring on January 20, 1997) was not a weather-caused flood, but rather a controlled release into the Los Angeles River channel from upstream reservoirs. Two, listed as occurring on March 5, 2001,
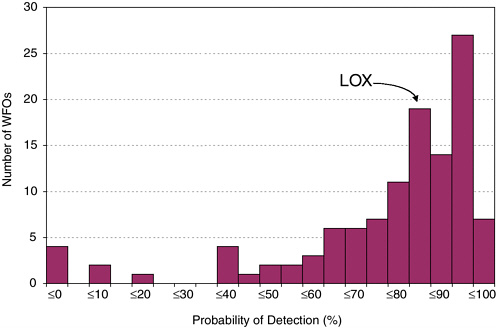
FIGURE 7.12 Histogram of the probability of detection (percentage) of flash floods for all 116 NWS WFOs in the Continental United States averaged over the period 1996–2003, after installation of all NEXRADs nationwide. The POD of the LOX office is 83 percent. SOURCE: Compiled by Julie Demuth from NOAA data.
actually occurred on March 6, 2001, and are being reclassified as floods (i.e., not flash floods) that were covered by flood warnings. Two additional events were covered by warnings not reflected in the NWS database because the early January warnings were issued with the wrong year in the date line. Thus the statistics represented in Figure 7.14 (and Figure 7.15) underrepresent the actual warning performance of the Oxnard office.
Figure 7.15 portrays the key flash flood warning statistics for the LOX WFO, along with national statistics for comparison purposes, for the period 1996 through 2003. The POD and FAR for LOX are similar to the national averages and exceed the 2004 goals for the NWS Western Region which are also shown in the figure. The fraction of events with warning lead times greater than zero is higher than the national average, but the average lead time is shorter. The latter difference may be a consequence of the steeper
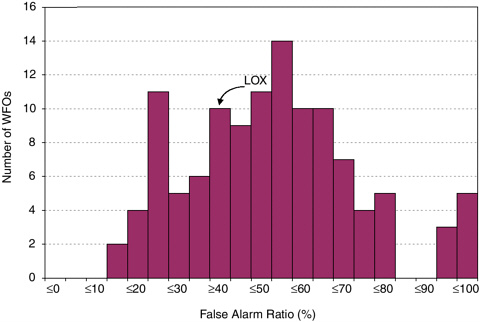
FIGURE 7.13 Histogram of the false alarm ratio (percentage) of flash floods for all 116 NWS WFOs in the Continental United States averaged over 1996–2003, after installation of all NEXRADs nationwide. The FAR of the LOX office is 39 percent. SOURCE: Compiled by Julie Demuth from NOAA data.
terrain and “flashier” streambeds in the county warning areas of concern here, compared to the overall national situation. This is reflected in the relatively short lead-time goal for the Western Region, where steep orography is a major factor.
The NWS database for the LOX WFO for the 1996–2003 shows 47 flash flood events and 136 flash flood warnings, for an average of about 6 events (as noted in the previous section, see Figure 7.10) and 17 warnings per year. This includes events and warnings for all four county warning areas served by the Oxnard office. The WFOs neighboring LOX to the north (San Francisco Bay, MTR) and south (San Diego, SGX) reported 62 and 66 events, respectively, during that period. In comparison to those neighboring California stations, the LOX WFO shows generally better flash flood warning statistics. The San Diego station does have a slightly higher POD, while the San
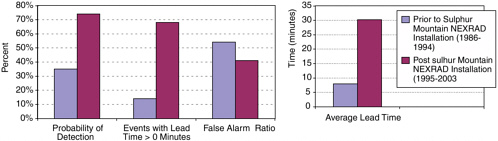
FIGURE 7.14 Comparison of the LOX WFO’s statistical performance measures for flash flood warnings from the period prior to installation of the Sulphur Mountain NEXRAD (1986–1994) versus the period after its installation (1995–2003) SOURCE: Compiled by Paul Smith from NOAA data.
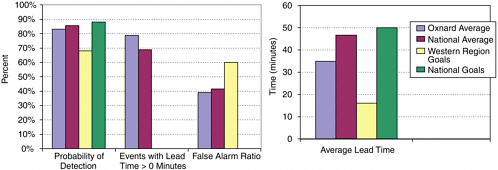
FIGURE 7.15 Flash flood warning statistics for the LOX WFO compared with national statistics from 1996 (i.e., after installation of all NEXRADs nationwide) through 2003. Also shown for comparison sake are the 2004 national and Western Region goals. SOURCE: Compiled by Paul Smith from NOAA data.
Francisco Bay station data indicate an average lead time of nearly 1.5 hours. However, less than half the events in the latter area had warning lead times greater than zero, so the average must reflect numerous cases with lead times of several hours.
The GAO Report
Appendix I of the GAO report (1998) listed flash flood events and warnings for Los Angeles and Ventura Counties for the period 1992 through early 1998. In reviewing that appendix, the committee was unable to reconcile all of the events and warnings listed with the databases maintained by the NWS. Table 7.1 presents a composite chronological listing of events and warnings for those two counties since the Sulphur Mountain NEXRAD was commissioned, as contained in the two NWS databases (i.e., one kept at the LOX WFO and the other used by NWS Headquarters in evaluating the national warning program) and the GAO report. Numerous discrepancies are indicated in the table, with respect to both the numbers and the timing of indicated events and warnings. For example, for the relatively busy period of early 1998 the GAO tabulation indicated 12 flash flood events.4 These would correspond to 14 events by NWS reckoning, because concurrent events (and warnings) in different county warning areas are tabulated as separate occurrences. Of those 14 events, four have no counterpart in the LOX database and only half are included in the national warning statistics. The main explanation for the latter discrepancy lies in the fact that the NWS generally includes only the first storm event occurring within a given warning period (including overlapping extensions) in its warning statistics. (To include later events would tend to bias the lead-time statistics, because the lead times for the later events would be longer and longer.) The GAO report also omitted one warning-event pair, on February 3, 1998, which appears in the other databases. The time differences present in all but three of the cases result mostly from corrections to the data made after later review of storm reports—sometimes as much as 2 years after the event. For only one of the 1998 events in the table do the entries in all three databases match exactly.
The GAO report not only listed events that do not appear in the NWS databases, but apparently did not take into account the facts that (1) each warning issued by the NWS carries an expiration time; (2) it is common practice to issue updates, modifications, or extensions to the warnings; and (3) consequently, overlapping warning statements were in effect on some of the days. (The warning statements often contain more specific information, intended to be helpful to responders, about threatened areas within the
|
4 |
These are the 12 events in the El Niño year of 1998 mentioned in the attachment to Senator Boxer’s letter in Appendix A. |
TABLE 7.1 Chronology of Flash Flood Warnings and Events for Los Angeles and Ventura Counties (January 1995–February 1998)
|
Date |
Time (Pacific Standard Time) |
LOX Database |
NWS Database |
|
4 Jan 1995 |
0850 (1300) |
Warn LA |
— |
|
|
0930 |
FF Ventura |
|
|
|
1000 |
FF LA (LT 1:10) |
FF LA |
|
|
1125 (1500) |
Warn LA |
— |
|
|
1250 (1500) |
Warn LA |
— |
|
|
1440 (1800) |
Warn LA |
— |
|
|
1700 (2100) |
Warn LA |
— |
|
|
2000 (0000/5th) |
Warn LA |
— |
|
7 Jan 1995 |
1700 |
— |
— |
|
|
1735 (2100) |
Warn LA |
Warn LA |
|
9 Jan 1995 |
0300 |
— |
— |
|
|
2330 (0600/10th) |
Warn Ventura |
Warn Ventura |
|
10 Jan 1995 |
0000 |
— |
FF Ventura (LT 0:30) |
|
|
0300 |
FF Ventura (LT 3:30) |
— |
|
|
0300 (1000) |
Warn LA |
— |
|
|
0400 |
— |
FF LA |
|
|
0415 (1000) |
Warn Ventura |
— |
|
|
0600 |
FF LA (LT 3:00) |
— |
|
|
0600 (1200) |
Warn LA |
— |
|
|
0717 |
FF Ventura (LT 3:02) |
— |
|
|
0800 |
FF LA (LT 2:00) |
— |
|
|
0834 (1800) |
Warn LA |
— |
|
|
0834 (1800) |
Warn Ventura |
— |
|
|
0834 |
— |
— |
|
|
1305 et seq. (1200/11th) |
Warn LA |
— |
|
|
1305 et seq. (1200/11th) |
Warn Ventura |
— |
|
24 Jan 1995 |
2105 (0900/25th) |
Warn LA |
Warn LA |
|
|
2105 (0900/25th) |
Warn LA |
Warn Ventura |
|
25 Jan 1995 |
0300 (0900) |
Warn Ventura |
Warn Ventura |
|
|
10 Mar 1995 |
1850 (0000/11th) |
Warn Ventura |
|
|
1940 (0400/11th) |
Warn LA |
— |
|
|
2000 |
— |
FF Ventura |
|
|
2145 |
FF Ventura (LT 2:55) |
— |
|
|
2150 |
— |
— |
|
|
2330 |
FF LA (LT 3:50) |
— |
|
20 Jan 1997 |
1352 |
FF LA |
|
|
2 Sept 1997 |
1505 (1600) |
Warn LA |
Warn LA |
|
6 Dec. 1997 |
0230 (0330) |
Warn Ventura |
Warn Ventura |
|
|
0340 (0445) |
Warn LA |
Warn LA |
|
|
2100 (2300) |
Warn LA |
Warn LA |
|
3 Feb 1998 |
0411 (0800) |
Warn LA |
Warn LA |
|
|
0448 (0845) |
Warn Ventura |
Warn Ventura |
|
|
0500 |
— |
FF LA (LT 0:49) |
|
|
0500 |
— |
FF Ventura (LT 0:12) |
|
|
0600 |
FF Ventura (LT 1:12) |
— |
|
GAO Report |
Remarks |
|
Warn LA |
Carried erroneous 1994 date |
|
FF Ventura |
|
|
FF LA |
|
|
— |
Extension of 0850 warning |
|
— |
Further extension of 0850 warning |
|
— |
Extension of 1250 warning |
|
— |
Extension of 1440 warning |
|
— |
Extension of 1700 warning |
|
FF LA |
Not classed as FF in other databases |
|
Warn LA |
|
|
FF Ventura |
Event actually occurred on 10 Jan |
|
Warn Ventura |
|
|
— |
May correspond to 0300 event |
|
Listed on 9 Jan |
|
|
Warn LA |
Carried erroneous 1994 date |
|
— |
|
|
Warn Ventura |
Extension of 2330/9th warning |
|
FF LA |
May correspond to 0400 event above |
|
Warn LA Extension of 0300 warning |
|
|
FF Ventura |
|
|
— |
|
|
— |
Extension of 0600 warning |
|
— |
Extension of 0415 warning |
|
FF LA |
Corresponds to 0800 event |
|
— |
Extensions of 0834 warning |
|
— |
Extensions of 0834 warning |
|
— |
False alarm |
|
— |
False alarm |
|
— |
Update of 2105 warning |
|
— |
Warn Ventura |
|
Warn LA |
|
|
— |
Corresponds to 2145 FF event? |
|
— |
|
|
FF Ventura |
Corresponds to 2145 FF event |
|
FF LA |
|
|
FF LA |
|
|
Warn LA |
False alarm |
|
Warn Ventura |
False alarm |
|
Warn LA |
False alarm |
|
Warn LA |
False alarm |
|
— |
|
|
Warn Ventura |
|
|
— |
May correspond to 0745 event |
|
— |
May correspond to 0600 event |
|
FF Ventura |
|
|
Date |
Time (Pacific Standard Time) |
LOX Database |
NWS Database |
|
|
0745 |
FF LA (LT 3:34) |
— |
|
|
0905 (1200) |
Warn LA |
Warn LA |
|
|
0905 (1200) |
Warn Ventura |
Warn Ventura |
|
|
1150 (1500) |
Warn LA |
Warn LA |
|
|
1150 (1500) |
Warn Ventura |
Warn Ventura |
|
6 Feb 1998 |
0835 (0945) |
Warn LA |
Warn LA |
|
|
0835 (0945) |
Warn Ventura |
Warn Ventura |
|
|
0910 |
— |
FF Ventura (LT 0:35) |
|
|
0910 (1045) |
Warn Ventura |
Warn Ventura |
|
|
0925 (1030) |
Warn LA |
Warn LA |
|
|
0925 (1030) |
Warn Ventura |
Warn Ventura |
|
|
0930 |
— |
— |
|
|
0930 |
— |
— |
|
|
0955 (1145) |
Warn LA |
Warn LA |
|
|
1000 |
FF Ventura (LT 1:25) |
— |
|
|
1010 |
— |
FF LA (LT 0:45?) |
|
|
1030 |
FF Ventura (LT 1:20) |
— |
|
|
1030 (1200) |
Warn LA |
Warn LA |
|
|
1030 (1200) |
Warn Ventura |
Warn Ventura |
|
|
1038 |
— |
— |
|
|
1038 |
FF Ventura (LT 0:08) |
— |
|
|
1135 |
FF LA (LT 3:00) |
— |
|
7 Feb 1998 |
1705 (2300) |
Warn Ventura |
Warn Ventura |
|
|
1800 |
— |
FF Ventura (LT 0:55) |
|
|
1950 (0000/6th) |
Warn LA |
Warn LA |
|
|
2040 |
FF Ventura |
(LT 3:35)— |
|
|
2205 |
FF LA (LT 2:15) |
FF LA (LT 2:15) |
|
23 Feb 1998 |
0935 (1800) |
Warn Ventura |
Warn Ventura |
|
|
1115 |
FF Ventura (LT 1:40) |
— |
|
|
1130 |
— |
FF Ventura (LT 1:55) |
|
|
1240 (1800) |
Warn LA |
Warn LA |
|
|
1240 (1800) |
Warn Ventura |
Warn Ventura |
|
|
1400 |
FF LA (LT 1:20) |
FF LA (LT 1:20) |
|
|
1400 |
FF Ventura (LT 1:20) |
— |
|
|
1500 |
— |
— |
|
|
1500 |
— |
— |
|
|
1600 (2000) |
Warn LA |
Warn LA |
|
|
1630 |
FF LA (LT 0:30) |
— |
|
|
1800 (2100) |
— |
Warn LA |
|
|
1800 (2100) |
— |
Warn Ventura |
|
|
2050 (2300) |
Warn LA |
Warn LA |
|
|
2255 (0300/24th) |
Warn LA |
Warn LA |
|
|
2255 |
— |
— |
|
24 Feb 1998 |
0100 (0300) |
Warn LA |
— |
|
|
0300 |
— |
— |
|
|
0300 (0600) |
Warn LA |
Warn LA |
|
GAO Report |
Remarks |
|
— |
|
|
? |
|
|
? |
|
|
? |
Extension of 0905 warning |
|
? |
Extension of 0905 warning |
|
Warn LA |
|
|
Warn Ventura |
|
|
— |
Corresponds to 1000 event? |
|
Warn Ventura Extension of 0835 warning |
|
|
— |
Extension of 0835 warning |
|
— |
Update of 0910 extension |
|
FF LA |
Corresponds to 1010 event? |
|
(Two) FF Ventura |
Corresponds to 0910, 1000, 1030 events? |
|
Warn LA |
Extension of 0925 extension |
|
— |
|
|
— |
CWA under warning since 0835 |
|
— |
|
|
Warn LA |
Update of 0955 extension |
|
Warn Ventura |
Extension of 0925 extension |
|
FF LA |
GAO listed wrong county |
|
FF Ventura |
CWA under warning since 0910 |
|
FF LA |
|
|
Warn Ventura |
|
|
— |
Corresponds to 2040 event? |
|
Warn LA |
|
|
FF Ventura |
|
|
FF LA |
|
|
Warn Ventura |
|
|
FF Ventura |
|
|
— |
Corresponds to 1115 event |
|
Warn LA |
|
|
Warn Ventura |
Update of 0935 warning |
|
— |
|
|
— |
|
|
FF LA |
Corresponds to 1400 event |
|
FF Ventura |
Corresponds to 1400 event |
|
Warn LA |
Extension of 1240 warning |
|
FF LA |
CWA under warning since 1240 |
|
— |
Extension of 1600 extension? |
|
— |
Extension of 0935 warning? |
|
— |
Extension of 1600 extension |
|
Warn LA |
Extension of 2050 extension |
|
FF LA |
No corresponding event in other databases |
|
— |
Extension of 2255/23rd extension |
|
FF LA |
No corresponding event in other databases |
|
Warn LA |
Extension of 0100 extension |
designated county warning areas.) For instance, both Los Angeles and Ventura Counties were under continuous flash flood warnings for more than 11 hours on February 23–24, 1998. Nevertheless, the GAO report listed two flash flood events that purportedly occurred at least 10 hours after the first warnings as events having zero lead-time warnings; neither of those events appears in the NWS databases, and the extended warnings were still in effect in any case. The LOX database shows no unwarned events during early 1998 and only two events with warning lead times shorter than an hour. The committee had no means to reconcile all of these discrepancies, but concludes that the table in the GAO report is not a useful indication of the flash flood warning performance of the LOX WFO.
Contributions of Sulphur Mountain and Adjoining Radars
Few flash flooding events in Los Angeles and Ventura Counties have remained unwarned since the Sulphur Mountain NEXRAD was commissioned (see previous section). This radar has been instrumental in the identification of precipitation patterns offshore and tracking them in space and time as they approach and pass over the local coastal mountainous areas. The Sulphur Mountain radar is assisted by two adjacent NEXRADs located at Vandenberg AFB (KVBX) and Santa Ana Mountain (KSOX), respectively. Combined, these three radars provide essential real-time precipitation coverage in support of the work of the LOX WFO.
The primary role of radar is to provide spatial information about precipitation patterns and their intensity and how these change as a function of time. This task may be adversely affected if the radar does not see some precipitation echoes either because of blocking or due to the radar beam overshooting the relevant echoes. Blocking by intervening terrain is almost impossible to avoid completely in complex terrain and may amount to a serious problem. Clever radar siting can go a long way in minimizing terrain blocking effects (see Chapter 4), especially in the directions of primary coverage responsibility. In addition, coverage from multiple radars scanning parts of the same area may further reduce the overall area that is not visible to at least one of them. The area presently covered by the KVBX and KSOX radars—the radars on either side of the Sulphur Mountain (KVTX) radar—is shown in Figure 7.7. By not including coverage provided by the KVTX radar, this figure highlights that each of these three radars covers a unique area and that parts of the domain are illuminated by more than one radar. It is important to recognize that no one of these three radars, on its own, would be able to adequately cover Los Angeles and Ventura Counties.
Low-level coverage is particularly important for quantitative precipitation estimation (see Chapter 5). The current scanning strategy of NEXRAD radars, as noted earlier, limits the lowest scan to 0.5° elevation, which poses a low-level coverage problem for radars mounted at higher altitudes (e.g., on mountaintops). This certainly is an issue for the Sulphur Mountain radar, especially during the winter season when precipitation systems often are shallow (see Chapters 2 and 6). Because the resulting low echo tops only partially fill the lowest-elevation radar beam (i.e., inhomogeneous beam filling), the intensity of such precipitation systems is typically underestimated by the radar. However, forecasters at the LOX WFO are well aware of this and, based on their extensive localized training and experience, are able to compensate for this when assessing the precipitation potential. Moreover, knowing the presence and movement of precipitation systems can be just as important in the flash flood forecasting and warning process as actual estimates of rainfall intensity. The accuracy of radar-based precipitation estimates is also substantially enhanced over land by virtue of the available dense rain gauge network.
Lowering the base scan elevation angle for the Sulphur Mountain radar might yield benefits that go beyond improvements in precipitation pattern identification and tracking (e.g., better observations farther offshore) and quantitative rainfall estimation (e.g., reduced negative effects of partial beam filling and the vertical reflectivity profile). For example, better coverage of low-level winds would result that may reveal local mesoscale flow features
(e.g., the barrier jet, which significantly affects the spatial rainfall distribution and amount) and possibly also assist in tornado recognition and associated warnings.
|
Recommendation: Evaluation of flash flood warnings should be based on their contributions to improved decision making and should employ metrics that take account of the magnitude and scale of the events and the increasing specificity of the warnings. The NWS should improve the database of flash flood events and warnings to include more complete and accurate listings of both warnings and events. The traditional national measures for evaluating flash flood warnings should be augmented to better take into account the myriad needs of the local population at risk. For example, the value attributed to the lead time of a warning should take into account factors such as the response time of a basin. In addition, warnings indicating the magnitude of the threat and designating specific regions within county warning areas are more useful to both the intended responders and others within the same county who are not affected by the warning. Evaluation statistics such as the probability of detection (POD) and the false alarm ratio (FAR) could be stratified by the scale of the events. The warning and event databases should be adapted to capture the increased specificity of the warning capability, in contrast to the current practice of recording warnings and events at the county level, with little indication of magnitude and impact. Establishing a reliable database of events for verification purposes involves well-recognized difficulties, but recording the warnings issued is (or should be) a straightforward process. Nevertheless, situations involving a series of overlapping warnings, or extensions of warnings, and possibly multiple flash flood events within a county appear not to be well represented in the national database. This results, at least partly, from the rules employed in establishing that database; such rules may be required to ensure uniformity that permits comparisons across the nation. However, a more comprehensive listing would be useful for detailed analyses. |


