
2
Trends Relevant to the Deterioration of Drinking Water in Distribution Systems
In the past two decades, a number of changes have occurred that may affect the quality of drinking water in distribution systems, consumer exposure to tap water, and the consequent risks of exposure. This section discusses trends in pipe age in water distribution systems and pipe replacement rates, waterborne disease outbreaks, host susceptibility in the U.S. population, consumer use of bottled water, and installation of home water treatment devices. This is not a comprehensive list of all the factors that may affect water quality and health risks from distributions systems. Furthermore, for many of these factors, there are limited data on recent trends such that additional research is needed to better understand current practices.
DISTRIBUTION PIPE AGE AND REPLACEMENT RATES
There is a large range in the type and age of the pipes that make up American water distribution systems, depending on the population and economic booms of the previous century. For many cities, the periods of greatest population growth and urban expansion were during the late 1800s, around World War I, during the 1920s, and post-World War II. The water pipes installed during these growth periods differ in their manufacture, materials, and life span. The oldest cast iron pipes from the late 19th century are typically described as having an average useful lifespan of about 120 years because of the pipe wall thickness (AWWA, 2001; AWWSC, 2002). In the 1920s the manufacture of iron pipes changed to improve pipe strength, but the changes also produced a thinner wall. These pipes have an average life of about 100 years. Pipe manufacturing continued to evolve in the 1950s and 1960s with the introduction of ductile iron pipe that is stronger than cast iron and more resistant to corrosion. Polyvinyl chloride (PVC) pipes were introduced in the 1970s and high-density polyethylene in the 1990s. Both of these are very resistant to corrosion but they do not have the strength of ductile iron. Post-World War II pipes tend to have an average life of 75 years (AWWA, 2001; AWWSC, 2002). Approximately 20 percent of the pipe in place in North America is lined with asbestos or cement. Furthermore, the overwhelming majority of ductile iron pipe is mortar-lined and about 40 percent of cast iron pipe in place is mortar-lined. These facts may be of great importance where the life of pipe is concerned, as linings are meant to prevent corrosion and increase pipe longevity.
In the 20th century, most of the water systems and distribution pipes were relatively new and well within their expected lifespan. However, a recent report by the American Water Works Association (AWWA, 2001) and a white paper by the American Water Works Service Company, Inc. (AWWSC, 2002) point out that these different types of pipes, installed during different time periods, will all be reaching the end of their expected life spans in the next 30 years. Analysis of main breaks at one large Midwestern water utility that kept careful records of distribution system management documented a sharp increase in the annual number of main breaks from 1970 (approximately 250 breaks per year) to 1989 (approximately 2,200 breaks per year) (AWWSC, 2002). Thus, the water industry is entering an era where it must make substantial investments in pipe repair and pipe replacement. An EPA report on water infrastructure needs (EPA, 2002c) predicted that transmission and distribution replacement rates will need to be around 0.3 percent per year in 2005 and will rise to 2.0 percent per year by 2040 in order to adequately maintain the water infrastructure (see Figure 1). Cost estimates for drinking water infrastructure range from $4.2 to $6.3 billion per year (AWWSC, 2002). The trends of aging pipe and increasing numbers of main breaks are of concern because of the potential relationship between waterborne disease outbreaks and main breaks (see the subsequent section on New and Repaired Water Mains).
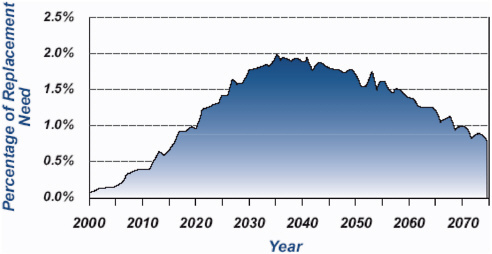
FIGURE 1 Projected annual replacement needs for transmission lines and distribution mains, 2000–2075. SOURCE: EPA (2002c).
WATERBORNE DISEASE OUTBREAKS
A voluntary, passive surveillance system for waterborne disease outbreaks in the U.S. has been maintained by the Centers for Disease Control and Prevention (CDC) in collaboration with EPA since 1971. Summary reports from this surveillance system are published every two years and describe the number of outbreaks, where they occurred, the etiologic agents, type of water systems involved, and factors that contributed to the outbreak. While the current waterborne disease surveillance summary states that the data are useful “for identifying major deficiencies in providing safe drinking water” (Blackburn et al., 2004), caution in the interpretation of these data is important, in that the proportion of outbreaks reported may vary with time, location, and the size of the water supply. With this caveat in mind, analyses of the data from this surveillance system indicate that the total number of reported waterborne disease outbreaks has decreased since 1980. However, the proportion of waterborne disease outbreaks associated with problems in the distribution system is increasing (see Figure 2). Craun and Calderon (2001) examined causes of reported waterborne outbreaks from 19711998 and noted that in community water systems, 30 percent of 294 outbreaks were associated with distribution system deficiencies. From 1999 to 2002, there have been 18 reported outbreaks in community water systems, and nine (50 percent) of these were related to problems in the water distribution system (Lee et al., 2002, Blackburn et al., 2004). The decrease in numbers of waterborne disease outbreaks per year is important and probably attributable
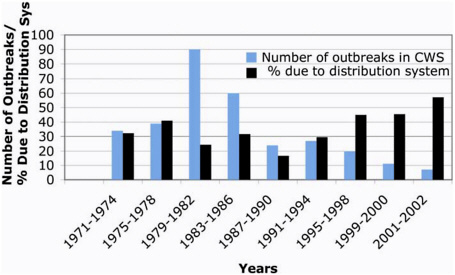
FIGURE 2 Waterborne disease outbreaks in community water systems (CWS) associated with distribution system deficiencies. Note that the majority of the reported outbreaks have been in small community systems and that the absolute numbers of outbreaks have decreased since 1982. SOURCE: Data extracted from Craun and Calderon (2001) and MMWR summary reports on waterborne disease surveillance (Lee et al., 2002 and Blackburn et al., 2004).
to improved water treatment practices and SWTR compliance that reduced the risk from waterborne protozoa (Pierson et al., 2001; Blackburn et al., 2004). The increase in the percentage of outbreaks attributable to the distribution system is probably also due to this factor (i.e., the SWTR); regulations for distribution systems have not been as extensive (other than the Lead and Copper Rule).
Most reported outbreaks associated with distribution systems occur in community water systems because of their greater size and complexity, but there have been a number of outbreaks associated with noncommunity water systems that have been attributed to deficiencies in the distribution system. Craun and Calderon (2001) reported that most distribution system-related outbreaks were linked to cross-connections and backsiphonage and the rest were attributed to main breaks or repair and contamination of municipal water storage tanks. The magnitude and severity of outbreaks associated with distribution systems vary, with an average of about 200 illnesses per outbreak (Craun and Calderon, 2001) and a total of 13 deaths. These outbreaks have been associated with chemical (copper, chlordane, ethylene glycol and others) and microbial contaminants, including enteric protozoa (Giardia, Cyclospora), enteric bacteria (Salmonella, Shigella, Campylobacter, and E. coli O157:H7) and enteric viruses (noroviruses and Hepatitis A virus).
It should be noted that endemic waterborne infection and illness may be associated with contaminants entering the distribution system. If low levels of contaminants enter the system and affect small numbers of persons, it might not be recognized and investigated as an outbreak. Indeed, it has been acknowledged that a fairly sizable number of cases of cryptosporidiosis could be occurring in a large city such as New York City without detection of a possible outbreak (NRC, 1999, page 249). Thus, not only are all waterborne disease outbreaks not detected, even those that are detected and reported will not address possible endemic illness risks. A number of sources show that endemic risks can be greater than epidemics, for example, Frost et al., (1996) and Payment and Hunter (2001). The CDC and EPA have recently completed a series of epidemiologic studies designed to assess the magnitude of endemic waterborne illness associated with consumption of municipal drinking water; a joint report on the results of these studies is forthcoming (Blackburn et al., 2004).
CHANGES IN THE UNITED STATES POPULATION
Another cause for concern regarding the risks of waterborne disease transmission is increasing host susceptibility to infection and disease in the U.S. population. Due to weaker immune systems, older Americans are at increased risk for morbidity and mortality from a number of infectious diseases, including influenza, pneumonia, and enteric diseases (Gerba et al., 1996). Decreased gastric acid secretion in the elderly may also result in increased susceptibility to infection from acid-sensitive enteric organisms (Morris and Potter, 1997). The U.S. population older than 74 years of age has increased from 13.1 million in 1990 to 16.6 million in 2000. The most rapid growth during this decade occurred in the size of the oldest age groups with a 38 percent increase in the
population greater than 85 years of age. In 2003, more than 12 percent of the total U.S. population was 65 and older, and this proportion will increase dramatically between 2010 and 2030 as the “baby boomers” start turning 65 in 2011. By 2030, nearly 20 percent of the total U.S. population will be over 65 years of age, and the population over 85 years of age will have grown rapidly (Older Americans, 2004).
The numbers of immunocompromised persons in the U.S. due to disease and immunosuppressive therapy is also increasing. Of particular note are growing numbers of AIDS patients, cancer survivers, and organ transplant patients. The number of new AIDS cases reported in the U.S. has increased more than five-fold from 8,131 in 1985 to 44,232 in 2003. Because of more effective treatments, AIDS patients are living longer but are still at increased risk of enteric infections. Cancer patients and transplant patients often require immunosuppressive therapy that puts them at greater risk of infection during the course of their treatment. The CDC estimates that the number of persons living with cancer more than tripled from 3.0 million in 1971 (1.5 percent of the U.S. population) to 9.8 million in 2001 (3.5 percent of the population) (CDC, 2004). The number of organ transplants performed each year in the U.S. has almost doubled from 12,619 in 1988 to more than 22,554 in 2004 (Organ Procurement and Transplantation Network. Available on-line at http://www.optn.org/latestData/rptData.asp. Accessed February 6, 2005).
USE OF BOTTLED WATER AND HOUSEHOLD WATER TREATMENT DEVICES
There has been a dramatic increase in the proportion of the U.S. population that drinks bottled water or uses some type of water treatment device in their homes. The Natural Resources Defense Council (NRDC) reported in 1999 that more than half of all Americans drink bottled water and about one third of the population regularly drink bottled water. The sales of bottled water tripled between 1986 and 1997 and reached about $4 billion per year (NRDC, 1999). The International Bottled Water Association reported a 10.1 percent growth in sales between 1997 and 1998 (Available on-line at http://www.bottledwater.org/public/pressrel.htm. Accessed March 16, 2005). The cost of bottled water ranges from 240 to over 10,000 times more per gallon than tap water, and yet bottled water use is not limited to high-income households. One study reported that “Black, Asian, and Hispanic households are more likely than whites to use bottled water” despite lower household incomes (Mogelonsky, quoted in NRDC, 1999). The use of home water treatment devices has also risen steadily from 32 percent in 1997 to 38 percent in 1999 to 41 percent in 2001 (WQA, 2001). As discussed in a subsequent section, these devices can support the regrowth of microbes, such that there use is not necessarily correlated with a decrease in contaminant exposure.
Several consumer surveys and studies have attempted to determine the driving forces behind these trends and have reported that perceived safety and health, taste of tap water, and concern about some contaminants are the most frequently reported reasons people drink bottled water instead of tap water (NRDC, 1999; Anadu and Harding, 2000;
WQA, 2001; Mackey et al., 2003). Although these trends are occurring, the health implications of these trends are unknown.
***
Taken together, the trends data suggest that water distribution system infrastructure in the U.S. is deteriorating and that health risks associated with distribution system water quality may be increasing. Although the proportion of the U.S. population that may be more susceptible to waterborne disease is growing, fewer Americans are drinking tap water. These trends need to be investigated to determine if they are important factors that should be taken into account when developing a distribution system rule.


