
4
Progress Toward Education for All: Trends and Current Challenges for sub-Saharan Africa
Paul C. Hewett and Cynthia B. Lloyd
At the turn of the twenty-first century, significant challenges remain for sub-Saharan African countries attempting to provide universal schooling for their children and youth. We estimate for the region that 20.8 million or 25 percent of young adolescents ages 10 to 14 have never enrolled in school (11.5 million girls and 9.3 million boys). Fully 28.4 million (15.1 million girls and 13.3 million boys) have not completed four grades of schooling. Furthermore, 37.2 million or 45 percent will never complete primary school. This latter number is nearly twice the entire population of children ages 10 to 14 in the United States, virtually all of whom will complete a primary education.1 Indeed, the level of educational participation and attainment in sub-Saharan Africa falls significantly below all other regions in the developing world (Chapter 3). Furthermore, in many countries, rates of growth in primary completion have flattened out or even declined since the mid- to late 1980s.
Despite the enormous challenges of overcoming such widespread lack of educational opportunities, the international community remains committed to the goals of providing universal access to, and assuring completion of, a basic level of schooling of good quality. Originally set forth in the “World Declaration on Education for All,” signed by more than 150 countries and international organizations in Jomtien, Thailand, in 1990, a target date for achieving universal access to primary schooling was set for 2000. Although this target date was ultimately not met, the international community reaffirmed the Education for All (EFA) framework at the World Education Forum in Dakar, Senegal, in 2000. Specifying six EFA goals, the Dakar conference set a new target date of 2015 for “all children, particularly girls, children in difficult circumstances, and those belonging to ethnic minorities, to have access to and complete free and compulsory primary education of good quality” (Dakar Framework for Action, 2000). Currently, however, only 13 of the 24 sub-Saharan African countries evaluated in this chapter have constitutional guarantees of compulsory schooling and, of these, only 10 guarantee free schooling. The key features of educational systems for 24 sub-Saharan African countries are presented in Table 4-1.
Specific targets for education are also embedded within the Millennium Declaration adopted by the United Nations General Assembly in 2001. The Millennium Declaration set forth eight Millennium Development Goals (MDG) relating to poverty, health, the environment, economic development, and education. The two targets directly related to education state: “by the year 2015, children everywhere, boys and girls alike, will be able to complete a full course of primary schooling and that by 2005 gender disparities in primary and secondary education will be eliminated” (United Nations General Assembly, 2001). The EFA and MDG efforts reflect the fact that investments in basic schooling have received a heightened level of attention from donors, governments, and the media because they are seen as a means of alleviating poverty and jump starting development in many parts of the developing world.
The purposes of the chapter are three-fold: (1) to highlight the value of consistent and comparable population-based data on educational participation and attainment levels for program planning and target setting, (2) to deepen our knowledge of trends in educational participation and achievement among youth in sub-Saharan Africa, and (3) to identify current priorities based on a more in-depth exploration of schooling differentials by gender and household wealth. In the first part of the chapter we review two often-used indicators for monitoring educational progress, the net primary enrollment ratio (NPER) and the survival rate to grade five, and compare them with similar measures from the nationally representative household data generated from the Demographic and Health Surveys (DHS). In the
TABLE 4-1 Key Features of Educational Systems in sub-Saharan Africa, 2000
second part of the chapter, we use DHS education data to explore longer term trends in schooling performance. In the final part of the chapter, we evaluate what is likely the biggest challenge for the next 10 years in achieving education for all in sub-Saharan Africa.
MONITORING PROGRESS IN SCHOOLING
International efforts to improve educational participation and attainment have put a premium on the development of indicators to monitor progress and to assess whether countries will meet the targets set by the EFA framework and the MDG. Two principal indicators that have been used by UNESCO and UNICEF to monitor progress toward universal education have been the NPER and the survival rate to grade 5 (UNESCO,
2002, 2003; UNICEF, 2003c).2 The logic behind the use of these measures is that the attainment of both would imply that the completion of primary school, which typically runs 1 to 3 years beyond grade 4, would shortly follow. In addition, such indicators represent the basic levels of schooling needed for the long-term acquisition of basic literacy and numeracy skills.
The NPER captures, at a moment in time, the percentage of children of primary school age who are currently enrolled in primary school. The NPER is derived from two different statistical sources. The numerator is obtained from beginning of the year registrations as officially reported by schools throughout the country to national ministries of education. These enrollment numbers are then divided by United Nations estimates of the population for the year and ages in question to derive the NPER. An NPER of 100 percent would indicate that all children within the eligible ages of primary school are currently enrolled.
Although often used to monitor progress and trends over time, a variety of limitations are associated with the NPER measure. In a context in which many children start and finish primary school late, it is possible for a country to have achieved universal primary completion while having an NPER below 100. This situation would occur if a significant percentage of students in a particular age cohort completed primary school beyond the standard age of completion.
The NPERs are also not strictly comparable across countries due to variations in the duration of the primary school cycle as defined by UNESCO. Table 4-1 shows that two countries have a primary cycle of 5 years, sixteen have 6 years, and six have 7 years. Countries are free to design their own school systems and international standards have not been established for the length of a primary school cycle. Using the MDG for primary schooling, countries with a longer primary cycle are currently judged by a tougher standard than countries with a shorter primary cycle.
This is because the denominator of the ratio is customized to the actual number of years in the primary cycle in each country. The NPER is also set according to the recommended starting ages in each country even if these ages are poorly promoted or enforced. Fifteen of the 24 countries have recommended starting ages of 6, while the other nine have recommended starting ages of 7. Countries with earlier recommended starting ages may have more difficulty achieving a particular NPER than countries with later recommended starting ages.
Furthermore, assessments of UNESCO data have raised questions about their comparability and quality (Behrman and Rosenzweig, 1994; Lloyd, Kaufman, and Hewett, 2000). The enrollment data obtained from the ministries of education vary in quality according to the management information system (MIS) capacity within each country. The development of a good MIS is a continuing challenge in many parts of Africa (Moulton et al., 2001). Where financial flows to schools are a function of the level of enrollment, there is substantial motivation on the part of local education offices to inflate these numbers. Changes in systems of reporting that make current data more accurate, often introduced as part of school reform measures, may compromise comparability over time.
Alternative indicators to monitor progress toward EFA and the MDGs can be developed using data on schooling collected in nationally representative surveys. Data collected since 1995 for 24 sub-Saharan African countries are currently available from the DHS. Based on United Nations population estimates, these surveys represent 81 percent of the population of young people (ages 10 to 24) living in the region.3 As indicated in Table 4-2, sample sizes in the DHS for the 10- to 24-year age group range from approximately 4,600 to more than 22,000. The median date for these surveys is 1999. In each of these nationally representative surveys, educational participation and attainment information is collected for all household members, while current schooling status is obtained for those ages 5 to 24.4
Arguably, the DHS estimate of attendance is likely to be more accurate in assessing actual school participation than the UNESCO NPER estimate, given that the NPER captures those that may have enrolled, but never actually attended school (UNESCO, 2002). Additional benefits of the DHS
TABLE 4-2 Sub-Saharan African Countries Participating in the Demographic and Health Surveys (DHS) Since 1995
|
Country |
Year of Most Recent DHS |
DHS Sample Size of Population Ages 10-24 |
U.N. Estimated Population Ages 10-24 in 2000 (in thousands) |
|
Benin |
2001 |
9,257 |
2,115 |
|
Burkina Faso |
1998-1999 |
10,243 |
3,976 |
|
Cameroon |
1998 |
8,833 |
4,996 |
|
Central African Republic |
1994-1995 |
8,529 |
1,199 |
|
Chad |
1996-1997 |
11,149 |
2,491 |
|
Comoros |
1996 |
4,852 |
240 |
|
Côte d’Ivoire |
1998-1999 |
4,654 |
5,595 |
|
Ethiopia |
1999 |
22,769 |
19,988 |
|
Ghana |
1998-1999 |
6,991 |
6,581 |
|
Guinea |
1999 |
10,097 |
2,637 |
|
Kenya |
1998 |
13,021 |
11,306 |
|
Madagascar |
1997 |
11,080 |
5,025 |
|
Malawi |
2000 |
20,884 |
3,722 |
|
Mali |
2001 |
19,329 |
3,652 |
|
Mozambique |
1997 |
14,730 |
5,848 |
|
Niger |
1998 |
11,052 |
3,505 |
|
Nigeria |
1999 |
11,589 |
37,637 |
|
Rwanda |
2000 |
16,679 |
2,689 |
|
South Africa |
1998-2000 |
17,276 |
13,715 |
|
Tanzania |
1999 |
6,115 |
11,845 |
|
Togo |
1998 |
14,041 |
1,496 |
|
Uganda |
2000-2001 |
12,742 |
7,757 |
|
Zambia |
2001-2002 |
12,788 |
3,521 |
|
Zimbabwe |
1999 |
10,374 |
4,489 |
|
SOURCES: DHS household data, United Nations Population Division estimates, 2000 (United Nations, 2001). |
|||
indicator are that the numerator and denominator are derived from the same population base and can be presented for separate sample subpopulations of interest. Furthermore, while UNESCO presents annual data on trends in NPER for those countries reporting enrollment data by age, such data are not available for all countries. In the case of sub-Saharan Africa, only 15 of the 24 countries covered in this chapter have recent net enrollment data as reported by UNESCO. By contrast, attendance rates can be derived for all 24 countries with DHS data.
The DHS does have disadvantages. Because a survey can extend over several months, it may capture some households at different phases of the annual school cycle. Thus, surveys that take place when schools are not in
session may lead to an underestimation of current attendance, because some respondents may not report students on vacation as currently attending. Certainly the DHS question wording was intended to capture all who are still enrolled in school, even if they were not currently attending due to illness, school vacation, or other mitigating circumstances. However, to address this concern, the DHS has specifically added a question to their most recent surveys that asks if—during the current school year—the household member attended school at any time.5
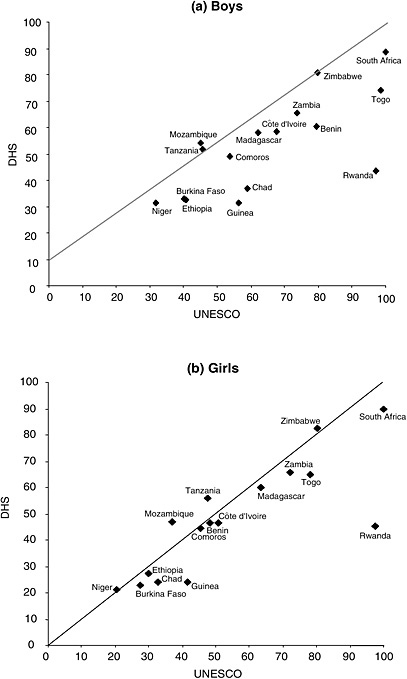
Table 4-3 presents the most recent UNESCO NPER and attendance rates from the DHS for boys and girls using the same primary school age ranges for each country.6 Figures 4-1a and 4-1b combine these two indicators in scatter plots, pairing estimates with a 45-degree line representing complete equality between the measures. Although a majority of points are reasonably close to the diagonal line, there is a tendency for the UNESCO estimates to be higher than those of the DHS.7 This is highlighted in Figures 4-1a and 4-1b by the larger number of cases falling, and sometimes significantly so, below the 45-degree line. These comparisons reinforce suspicions about the inflation of ministry reporting of enrollment and the likelihood that many children are enrolled in, but never actually attend, school (UNESCO, 2002).
Table 4-3 also provides two alternative estimates of the gender parity ratio. By comparing the gender ratios, it is clear that UNESCO estimates are systematically lower than those of the DHS. These results can be explained by the higher reported enrollments for boys in the UNESCO data
|
5 |
This question was added to measure enrollment in cases where surveys encompassed more than one school year or encompassed a school year and a vacation period. Note that current attendance rates generated from this question may improperly capture those who have dropped out during the current school year. These changes were initiated so DHS data could become more directly comparable to UNESCO data. The additional question is available for only 9 of the 24 countries. To maintain our comparisons across all 24 countries, we have used the original question wording for attendance: “Is ‘name’ still in school?” For six of the nine countries, the difference between estimates of attendance generated from the different measures is less than 3 percent. Attendance is 27 percent lower in Rwanda and 12 percent lower in Guinea using only the original question. In Tanzania, attendance is 5 percent higher using only the original question. |
|
6 |
Sahn and Stifel (2003) recently assessed progress toward the Millennium Development Goals in Africa during the 1990s using attendance rates among 6- to 14-year-olds. This is problematic because the measure ranges over 9 years of age, whereas the net enrollment rate ranges over 4 to 7 years, depending on the country. Thus, the Sahn and Stifel indicator is, in fact, a much higher standard to meet than is implied by the MDG target. |
|
7 |
Similar findings were highlighted in comparisons between UNESCO’s NPER and National Attendance Ratios using a smaller selection of the DHS and UNICEF’s Multiple Indicator Cluster Surveys (Huebler and Loaizia, 2002, as cited in UNESCO, 2002, p. 49; UNESCO, 2003, Table 2.6). These differences persist if the alternative measure of attendance is used; see footnote 5. |
TABLE 4-3 Comparison of NPER (UNESCO) and Primary Attendance Rates (DHS)
|
Country |
Age Ranges |
Year of Data |
Boys |
Girls |
Gender Parity Ratioa |
||||
|
UNESCO |
DHS |
UNESCO |
DHS |
UNESCO |
DHS |
UNESCO |
DHS |
||
|
Benin |
6-11 |
— |
2001 |
79.5 |
60.5 |
48.3 |
46.6 |
.61 |
.77 |
|
Burkina Faso |
7-12 |
1998 |
1998-1999 |
40.2 |
33.0 |
27.5 |
22.8 |
.68 |
.69 |
|
Cameroon |
6-11 |
— |
1998 |
— |
74.7 |
— |
72.8 |
— |
.97 |
|
C.A.R. |
6-11 |
— |
1994-1995 |
— |
64.0 |
— |
49.5 |
— |
.77 |
|
Chad |
6-11 |
1996 |
1996-1997 |
59.0 |
36.7 |
32.8 |
24.2 |
.56 |
.66 |
|
Comoros |
6-11 |
1998 |
1996 |
53.7 |
49.2 |
45.5 |
44.6 |
.85 |
.91 |
|
Côte d’Ivoire |
6-11 |
1998-1999 |
1998 |
67.5 |
58.4 |
50.8 |
46.4 |
.75 |
.79 |
|
Ethiopia |
7-12 |
1998 |
1999 |
40.8 |
32.4 |
29.8 |
27.2 |
.73 |
.84 |
|
Ghana |
6-11 |
— |
1998-1999 |
— |
76.8 |
— |
76.1 |
— |
.99 |
|
Guinea |
7-12 |
1999-2000 |
1999 |
56.4 |
31.3 |
41.4 |
23.9 |
.73 |
.76 |
|
Kenya |
6-12 |
— |
1998 |
— |
87.2 |
— |
86.9 |
— |
.99 |
|
Madagascar |
6-10 |
1998 |
1997 |
62.1 |
58.2 |
63.5 |
60.2 |
1.02 |
1.03 |
|
Malawi |
6-11 |
— |
2000 |
— |
73.1 |
— |
76.0 |
— |
1.04 |
|
Mali |
7-12 |
— |
2001 |
— |
45.0 |
— |
33.5 |
— |
.74 |
|
Mozambique |
6-10 |
1998 |
1997 |
45.2 |
54.0 |
36.8 |
47.1 |
.81 |
.87 |
|
Niger |
7-12 |
1998 |
1998 |
31.9 |
31.2 |
20.4 |
21.1 |
.64 |
.68 |
|
Nigeria |
6-11 |
— |
1999 |
— |
65.5 |
— |
61.3 |
— |
.94 |
|
Rwanda |
7-12 |
1999-2000 |
2000 |
97.1 |
43.6 |
97.5 |
45.4 |
1.01 |
1.04 |
|
South Africa |
7-13 |
1997 |
1998 |
100.0 |
88.5 |
100.0 |
89.9 |
1.00 |
1.02 |
|
Tanzania |
7-13 |
1999-2000 |
1999 |
45.8 |
51.6 |
47.6 |
56.0 |
1.04 |
1.09 |
|
Togo |
6-11 |
1998 |
1998 |
98.6 |
74.2 |
78.3 |
64.7 |
.79 |
.87 |
|
Uganda |
6-12 |
— |
2000-2001 |
— |
74.2 |
— |
75.8 |
— |
1.02 |
|
Zambia |
7-13 |
2000-2001 |
2001-2002 |
80.0 |
65.6 |
80.0 |
65.7 |
1.00 |
1.00 |
|
Zimbabwe |
6-12 |
1999-2000 |
1999 |
79.9 |
80.9 |
80.4 |
82.3 |
1.01 |
1.02 |
|
aCalculated as females divided by males. SOURCES: UNESCO (2002, Table 6), World Bank (2002), and DHS household data. |
|||||||||
(Figure 4-1a). These findings suggest the potential for a differential inflation of enrollment by gender, with either structural elements built into some management information systems that lead to this type of performance inflation and/or the fact that boys are more likely than girls to be enrolled in, yet never attend, school. It is possible that while norms about the importance of enrolling boys are pervasive, norms about the enrollment of girls are less strongly held. As a result, the registration of girls on the first day of school may reflect a stronger commitment on the part of parents to support their daughters’ regular attendance, whereas, in the case of boys, the act of first day enrollment may be more routine and therefore less indicative of parental commitment. Regardless of how we interpret these discrepancies, UNESCO enrollment data imply much larger gender gaps in schooling in these countries than DHS attendance data.
Given late starting ages and different lengths of the primary cycle, it is also interesting to compare UNESCO’s survival rate to grade 5 and the DHS grade 4 completion rate among those ever enrolled, two alternative indicators of grade progression. UNESCO has developed an indicator of the survival rate to grade 5 using a ratio of the number of children officially enrolled in grade 5 in a given year relative to the number of children who officially enrolled in first grade 4 years earlier. This rate may or may not capture the actual percentage of any cohort that completes grade 4, because it does not allow for any repetition or temporary withdrawal and it does not restrict the measure to children of a common age. In countries with high repetition or withdrawal, this statistic would underestimate the percentage of children who would eventually complete grade 4. An alternative measure to assess progress toward EFA, which can be easily derived from the DHS and does not have these limitations, is the percentage of 15- to 19-year-olds who have completed 4 or more years of schooling among those who have ever attended. This measure accommodates late starters and allows comparisons across age cohorts.
Table 4-4 presents a comparison of estimates of the survival to grade 5 derived from UNESCO and the grade 4 completion rate among those who ever attended from the DHS, separately for boys and girls. In only 14 of the 24 countries are such data available from UNESCO. Figures 4-2a and 4-2b present scatter plots of points derived from data in Table 4-4. As can be seen in the figures, with the exception of Chad and Guinea (for boys) and Chad (for girls), the UNESCO estimates are lower than the comparable DHS data. If the UNESCO enrollment numbers are inflated by students who enroll, but never attend school—as is suggested above—the grade 5 survival rates would be lower than would otherwise be expected. The differences between estimates are also likely a function of the fact that the grade 4 completion rates calculated from the DHS data are not bounded by age and include children who spend more than 4 years to complete grade 4.
TABLE 4-4 Comparison of UNESCO Survival Rates to Grade 5 and DHS Grade 4 Completion Rates Given Enrollment
|
Country |
Year of Data |
Boys |
Girls |
Gender Parity Ratioa |
||||
|
UNESCO |
DHS |
UNESCO |
DHS |
UNESCO |
DHS |
UNESCO |
DHS |
|
|
Benin |
— |
2001 |
— |
83.2 |
— |
75.5 |
— |
.91 |
|
Burkina Faso |
1998-1999 |
1998-1999 |
66.9 |
80.3 |
70.4 |
84.5 |
1.05 |
1.05 |
|
Cameroon |
— |
1998 |
— |
86.8 |
— |
88.0 |
— |
1.01 |
|
C.A.R. |
— |
1994-1995 |
— |
66.7 |
— |
57.1 |
— |
.86 |
|
Chad |
1997 |
1996-1997 |
62.0 |
57.8 |
53.0 |
42.7 |
.85 |
.74 |
|
Comoros |
— |
1996 |
— |
75.2 |
— |
74.9 |
— |
.99 |
|
Côte d’Ivoire |
1997 |
1998 |
77.0 |
87.0 |
71.0 |
81.6 |
.92 |
.94 |
|
Ethiopia |
1997 |
1999 |
51.0 |
54.8 |
50.0 |
54.3 |
.98 |
.99 |
|
Ghana |
— |
1998-1999 |
— |
93.5 |
— |
92.8 |
— |
.99 |
|
Guinea |
1998-1999 |
1999 |
92.5 |
87.8 |
79.1 |
80.7 |
.86 |
.92 |
|
Kenya |
— |
1998 |
— |
93.1 |
— |
93.8 |
— |
1.01 |
|
Madagascar |
1997 |
1997 |
49.0 |
52.0 |
33.0 |
55.1 |
.67 |
1.06 |
|
Malawi |
— |
2000 |
— |
75.9 |
— |
77.8 |
— |
1.03 |
|
Mali |
— |
2001 |
— |
86.4 |
— |
84.7 |
— |
.98 |
|
Mozambique |
1997 |
1997 |
52.0 |
64.2 |
39.0 |
50.3 |
.75 |
.78 |
|
Niger |
1998-1999 |
1998 |
62.1 |
87.2 |
60.2 |
86.0 |
.97 |
.99 |
|
Nigeria |
— |
1999 |
— |
96.5 |
— |
95.2 |
— |
.99 |
|
Rwanda |
1998-1999 |
2000 |
47.9 |
67.0 |
42.8 |
66.5 |
.89 |
.99 |
|
South Africa |
1998-1999 |
1998 |
75.1 |
97.4 |
76.7 |
98.8 |
1.02 |
1.01 |
|
Tanzania |
1998-1999 |
1999 |
78.6 |
83.0 |
83.3 |
88.0 |
1.06 |
1.06 |
|
Togo |
1998-1999 |
1998 |
54.2 |
77.3 |
48.4 |
68.0 |
.89 |
.88 |
|
Uganda |
1998-1999 |
2000-2001 |
43.9 |
85.5 |
45.5 |
82.3 |
1.04 |
.96 |
|
Zambia |
— |
2001-2002 |
— |
84.8 |
— |
84.5 |
— |
1.00 |
|
Zimbabwe |
1997 |
1999 |
78.0 |
96.3 |
79.0 |
97.2 |
1.01 |
1.00 |
|
aCalculated as females divided by males. SOURCES: UNESCO (2002, Table 10), World Bank (2002), and DHS household data. |
||||||||
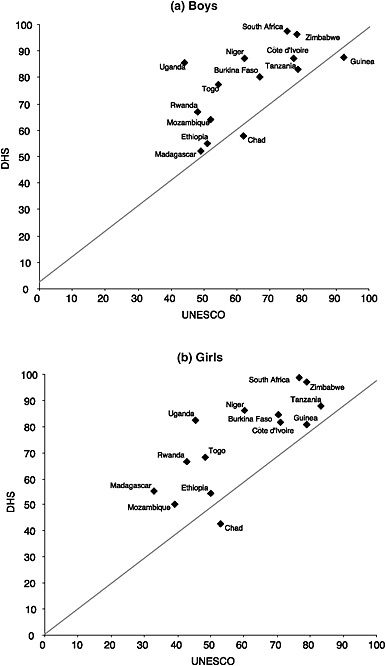
FIGURE 4-2 Comparison of UNESCO survival rate to grade 5 and DHS grade 4 completion rate given enrollment.
SOURCE: Table 4-4, this volume.
In countries with a large percentage of repeaters, the survival to grade 5 statistic would miss those who are ultimately able to complete grade 4, making the achievement of EFA and MDG appear more distant.
The differences between the UNESCO and DHS estimates in Table 4-4 also produce differences in the gender parity ratios. Of the 14 countries where comparisons of alternative indicators of grade progression are possible, nine countries show roughly similar ratios, with four showing an advantage for girls and five an advantage for boys. Although there are substantial differences in five cases, they do not show a consistent pattern; UNESCO gender ratios are substantially higher in two cases and substantially lower in three other cases.
The comparisons between UNESCO and DHS data strongly suggest that monitoring progress toward the EFA and MDGs with the NPERs and survival rates may be problematic and ultimately misleading. By relying on enrollment data from national ministries of education, which are not directly tied to actual attendance, UNESCO appears to overestimate the proportion of children attending school. On the other hand, countries are judged more harshly with regard to grade progression if UNESCO survival ratio estimates are applied. If UNESCO indicators are utilized to monitor progress over time, for example, by comparing estimates at two or more points in time, inaccurate conclusions regarding educational trends and the achievement of EFA goals may be the result.
In the next section of the chapter, we rely entirely on DHS data to derive country-specific, as well as region-wide, trends using alternative indicators that can be obtained from retrospective histories of educational attainment. The results of these analyses give a different, and arguably more accurate, portrayal of past education achievement and current challenges than trend analyses based on UNESCO data.
TRENDS IN SCHOOLING PARTICIPATION AND ATTAINMENT
With so many recent DHS currently available for sub-Saharan Africa, it is now possible to derive estimates of trends over the past 30 years in the school participation and attainment of young people for the region as a whole. These data tell a story of impressive past progress and daunting current challenges. These data also provide a picture of the state of current progress toward the millennium education goal of universal primary completion, a picture that in many ways differs from that portrayed by UNESCO indicators.
Trends in schooling can be derived using the most recent DHS for each country by comparing differences in school participation and attainment across age cohorts. We look at three indicators of progress: (1) the percentage ever attended, (2) the percentage completing four or more grades, and (3) the
percentage completing primary.8 To assure comparability across cohorts, the youngest 5-year age group for each indicator must have reached a sufficient age to be assured of having had the opportunity to achieve the level of schooling captured by that indicator.9 In the case of the percentage ever attending school, 10 to 14 is the youngest cohort for which we present estimates. Given the variable starting ages (Table 4-1) and late ages of entry—a common practice in sub-Saharan Africa—deriving this indicator for younger children would underestimate the percentage who would eventually attend. For grade 4 completion, the youngest cohort that can be captured accurately is 15 to 19. Again, because of late starting ages, not all children can safely be assumed to complete grade 4 until the age of 15. For completed primary, the base cohort for trend comparisons is 20- to 24-year-olds because in countries with longer primary cycles, students have been known to be still enrolled in primary at the age of 18 or 19 (Lloyd, Mensch, and Clark, 2000).
There are several advantages associated with deriving trends from a single DHS. First, one can compare school trends for a greater range of countries, as only 15 of the 24 countries have had more than one DHS since 1990, when the DHS added education to the household roster questionnaire. Second, with a mean interval of no more than 6 years between surveys, trends can be captured for a longer interval of time using a single survey. Third, there is internal comparability within one sample survey that cannot necessarily be assumed when linking surveys.10
On the other hand, there is some loss in comparability when deriving long-term trends from one survey due to the possibility of differential mortality by school attainment. Some of those educated in the past will not be alive at the time of the survey and, therefore, their school attainment will not be reported. Mortality is typically selective of the least educated and is therefore likely to
lead to an overestimate of education attainment in earlier time periods, thus biasing downward estimated rates of progress. Indicators for the current period will not suffer from this bias. In the context of AIDS, there is some indication that educational differentials in AIDS mortality favor the least educated in the early stages of the epidemic; however, recent evidence suggests that these differentials are disappearing or even being reversed (de Walque, 2002; Glynn et al., 2004; Hargreaves and Glynn, 2002). Unfortunately, we are unaware of data on trends in mortality rates by education for sub-Saharan Africa and therefore cannot assess the extent of the bias or how it might be changing.
Another drawback is that the indicators of progress are less contemporaneous than those generated by UNESCO and others (Bruns, Mingata, and Rakotomalala, 2003; UNESCO, 2002, 2003). For example, because completed primary can only be accurately calculated for those 20 years of age or older, using the most recent DHS such respondents would have passed through primary school some time in the mid- to late 1980s. For completion of 4 or more years of schooling, the most recent estimate can be obtained for the early to mid-1990s.
However, given that the trends for all three indicators track closely together across age cohorts, it is possible to bring grade 4 and primary school completion estimates up to date by projecting rates using simple and plausible assumptions about future trends.11 Table 4-5 provides an overview of the trends in education for all indicators for boys and girls separately, including estimates for the most recent period. The trends in Table 4-5 are based on weighted averages, using the United Nations estimate of the population ages 10 to 24 in 2000 as the weight for each country.12 Figures 4-3a, 4-3b, and 4-3c illustrate these trends and place them in a
TABLE 4-5 Trends in Percentage of Education Participation and Attainment for 24 African Countriesa
|
Age Groups |
Ever Attended School |
Completed 4+ Years |
Completed Primary |
||||||
|
Male |
Female |
Gender Parity Ratiob |
Male |
Female |
Gender Parity Ratiob |
Male |
Female |
Gender Parity Ratiob |
|
|
10-14 |
78.3 |
72.9 |
.93 |
68.7c |
63.8c |
.93d |
57.6c |
53.3c |
.93d |
|
15-19 |
81.0 |
71.5 |
.88 |
68.9 |
60.9 |
.88 |
57.8c |
50.5c |
.87d |
|
20-24 |
78.7 |
66.8 |
.85 |
69.4 |
58.5 |
.84 |
57.8 |
47.6 |
.82 |
|
25-29 |
76.9 |
64.2 |
.83 |
68.6 |
55.7 |
.81 |
57.1 |
44.8 |
.78 |
|
30-34 |
74.4 |
58.8 |
.79 |
66.2 |
49.9 |
.75 |
55.9 |
39.8 |
.71 |
|
35-39 |
72.6 |
51.8 |
.71 |
64.3 |
43.1 |
.67 |
53.9 |
33.3 |
.62 |
|
40-44 |
65.8 |
44.9 |
.68 |
56.9 |
35.4 |
.62 |
46.3 |
26.2 |
.57 |
|
aWeighted by population based on United Nations Population Division estimates, 2000 (United Nations, 2001). bCalculated as females divided by males. cEstimates prepared by authors; see footnote 10. dCalculations based on estimates prepared by authors. SOURCE: DHS household data. |
|||||||||
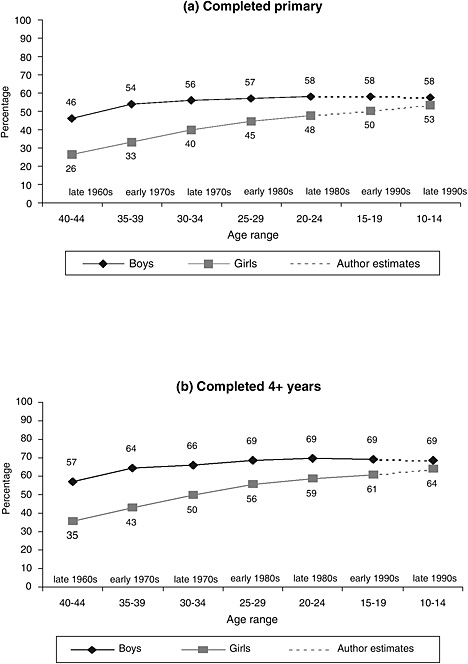
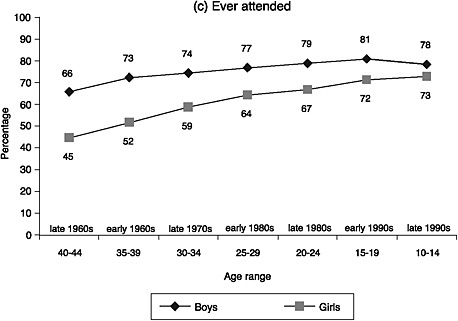
FIGURE 4-3 Trends in completion of primary for 24 African countries (population weighted).
SOURCE: Table 4-5, this volume.
periodic time line when they would have passed through the educational system.
For males, the percentage completing primary is estimated to have risen in sub-Saharan Africa from roughly 46 percent in the late 1960s to roughly 58 percent in the late 1990s. However, primary completion rates have remained at the same level for the past 20 years. Most of the improvement in primary completion for males came a long time ago in the 1960s and 1970s and has stalled since.
In stark contrast, over the same time period, females’ primary completion rates have risen steadily from a much lower base of roughly 26 percent in the late 1960s to 53 percent projected for the late 1990s, roughly doubling the level of achievement over this period. The pace of progress for females, which was rapid, has slowed somewhat in the past 10 years. For females, these trends reflect not only more girls enrolling in schooling, but also some small improvement in the grade progression rate once enrolled. With these very different trajectories for males and females, the gender gap that was very wide in the early days of independence has narrowed considerably, with an estimate for sub-Saharan Africa as a whole to be only 5 percentage points in the late 1990s.
Grade 4 completion rates are slightly higher than primary completion rates for both males and females, implying an attrition rate from grade 4 to primary completion of roughly 10 percentage points. In the current period, it is estimated that 64 percent of girls ages 10 to 14 and 69 percent of boys have completed at least 4 grades. Two worrying developments for boys are the stagnation in grade 4 completion for the past 15 to 20 years at 69 percent and the absolute decline in attendance rates for boys in the most recent period. While 81 percent of 15- to 19-year-old boys had ever been to school (Figure 4-3c), the percentage has fallen to 78 percent for the 10- to 14-year-olds. This suggests the possibility of a future erosion in boys’ schooling attainment. These weighted regional averages hide the current poor performance of a large number of countries, where boys’ attendance rates have shown more dramatic declines.
As with the primary completion rates, grade 4 completion rates for females have increased markedly over time, although it is clear that a large part of the growth was for the older age cohorts. As a result, the estimated gender gap for grade 4 completion has declined to 5 percentage points for the latest time period. With the decline in boys’ attendance coupled with increases in girls’ enrollment and grade 4 completion, it is likely that girls will meet or surpass boys on this indicator in the near future. However, although grade 4 completion and attendance for girls continues to increase, they are doing so at a much slower rate than in the past. It is possible that the trends in girls’ schooling will eventually parallel the flatter trends for boys that have occurred in the past decade or so.
These long-term trends for the region, as a whole, mirror economic and political developments. In the early postcolonial period, the importance accorded to education in national development plans led to a dramatic increase in educational expenditure and a tremendous expansion of the educational infrastructure, irrespective of differing development strategies.13 These investments were facilitated by strong economic growth rates in the late 1960s and 1970s (Kinyanjui, 1993; World Bank, 1988). Total public expenditure on education in constant dollars grew by roughly seven percent a year between 1970 and 1980 on average across sub-Saharan Africa, with similar average rates of growth in the former British and French colonies, well above rates required to keep pace with the growth in school-age populations (Donors to African Education, 1994). Indeed, growth of educational expenditure exceeded growth in gross national product (GNP) over the decade of the 1970s, resulting in a rising percentage of GNP devoted to educational expenditure.
The economic, political, and demographic conditions in the 1980s, however, sharply curtailed and often ended the impressive educational gains of the prior two decades. Population continued to grow rapidly, with rates of growth in most countries even higher in the 1980s than in the 1970s (United Nations, 2001). The majority of non-oil exporting African countries were particularly hard hit by increased world prices for oil, decreased export prices, and higher external debt (Hodd, 1989; World Bank, 1988). Additionally, most countries adopted structural adjustment programs that resulted in cutbacks in social-sector spending, including educational expenditures, often leading to the imposition of school fees (Reimers, 1994).14 The impact of these changes is reflected in declines in the growth rate of educational expenditures in constant dollars, from 6.2 percent on average from 1970 to 1980 to 2.1 percent from 1980 to 1990 (Donors to African Education, 1994).
Since some of the most populous countries in Africa, measured in terms of the absolute size of their youth population in 2000, have achieved higher levels of schooling participation and attainment than their smaller neighbors, weighted averages give a more encouraging picture of the trends in schooling in sub-Saharan Africa than would be the case if we were to give each country the same importance or weight in the analysis.15 Tables 4-6a, 4-6b, and 4-6c present data on the performance of individual countries for each of the three DHS indicators. As is illustrated in the tables, the most populous countries that have participated in the DHS with relatively strong educational performance include Nigeria with 37.6 million 10- to 24-year-olds, South Africa with 13.7 million, Tanzania with 11.8 million, Kenya with 11.3 million, Uganda with 7.8 million, and Ghana with 6.6 million. Of the populous countries, only Ethiopia with 20 million 10- to 24-year-olds has had relatively poor educational performance. Thus, more than half the countries represented in this analysis with smaller populations of children ages 10 to 24 face even greater challenges in achieving education for all than would be implied by the weighted regional data.
CURRENT CHALLENGES AND FUTURE PROGRESS TOWARD EFA
In the 1990s, qualitative evaluations of the educational situation in the region described a thinning of the provision of education and the inability of countries to maintain current levels of achievement given lagging investment and continuing growth in the size of school-age cohorts (Kinyanjui,
TABLE 4-6a Trends in Percentage Ever Attended School, by Age Group: 24 sub-Saharan African Countries
|
Country |
Survey Date |
Ages 10-24 |
Ages 10-14 |
|
|
2000 Population |
Boys |
Girls |
||
|
Benin |
2001 |
2,115 |
.76 |
.55 |
|
Burkina Faso |
1998-1999 |
3,976 |
.41 |
.27 |
|
Cameroon |
1998 |
4,996 |
.89 |
.84 |
|
Central African Republic |
1994-1995 |
1,199 |
.83 |
.63 |
|
Chad |
1996-1997 |
2,491 |
.55 |
.35 |
|
Comoros |
1996 |
240 |
.77 |
.64 |
|
Côte d’Ivoire |
1998-1999 |
5,595 |
.73 |
.57 |
|
Ethiopia |
1999 |
19,988 |
.50 |
.40 |
|
Ghana |
1998-1999 |
6,581 |
.87 |
.86 |
|
Guinea |
1999 |
2,637 |
.58 |
.40 |
|
Kenya |
1998 |
11,306 |
.96 |
.95 |
|
Madagascar |
1997 |
5,025 |
.78 |
.78 |
|
Malawi |
2000 |
3,722 |
.93 |
.93 |
|
Mali |
2001 |
3,652 |
.51 |
.36 |
|
Mozambique |
1997 |
5,848 |
.85 |
.71 |
|
Niger |
1998 |
3,505 |
.41 |
.27 |
|
Nigeria |
1999 |
37,637 |
.83 |
.79 |
|
Rwanda |
2000 |
2,689 |
.88 |
.88 |
|
South Africa |
1998-2000 |
13,715 |
.98 |
.99 |
|
Togo |
1998 |
1,496 |
.89 |
.72 |
|
Uganda |
2000-2001 |
7,757 |
.96 |
.95 |
|
United Republic of Tanzania |
1999 |
11,845 |
.75 |
.74 |
|
Zambia |
2001-2002 |
3,521 |
.86 |
.84 |
|
Zimbabwe |
1999 |
4,489 |
.98 |
.99 |
|
SOURCE: United Nations (2001); DHS household data. |
||||
|
Ages 20-24 |
Ages 30-34 |
Change for Most Recent Decade |
Change for Earlier Decade |
||||
|
Boys |
Girls |
Boys |
Girls |
Boys |
Girls |
Boys |
Girls |
|
.65 |
.36 |
.61 |
.34 |
16.9 |
50.1 |
6.7 |
8.4 |
|
.36 |
.17 |
.23 |
.09 |
12.7 |
62.0 |
58.7 |
81.1 |
|
.91 |
.78 |
.85 |
.67 |
−2.1 |
7.8 |
6.2 |
15.3 |
|
.86 |
.56 |
.81 |
.49 |
−3.7 |
11.9 |
6.6 |
15.1 |
|
.61 |
.27 |
.45 |
.17 |
−10.6 |
28.9 |
35.3 |
63.0 |
|
.78 |
.64 |
.62 |
.35 |
−1.4 |
−0.4 |
26.2 |
82.4 |
|
.63 |
.53 |
.52 |
.38 |
16.1 |
7.2 |
21.6 |
41.1 |
|
.53 |
.30 |
.50 |
.21 |
−6.7 |
31.7 |
6.6 |
47.0 |
|
.87 |
.75 |
.83 |
.65 |
−0.2 |
14.4 |
4.4 |
14.6 |
|
.49 |
.24 |
.43 |
.18 |
18.7 |
66.2 |
12.7 |
36.5 |
|
.97 |
.95 |
.96 |
.91 |
−0.8 |
.2 |
1.5 |
3.7 |
|
.82 |
.81 |
.82 |
.79 |
−4.9 |
−4.6 |
−0.4 |
3.5 |
|
.91 |
.81 |
.83 |
.65 |
2.2 |
14.8 |
8.6 |
24.0 |
|
.34 |
.20 |
.33 |
.19 |
48.3 |
81.5 |
3.7 |
6.6 |
|
.82 |
.59 |
.83 |
.65 |
3.6 |
20.7 |
−1.7 |
−9.2 |
|
.39 |
.20 |
.27 |
.12 |
4.8 |
37.6 |
44.5 |
62.4 |
|
.83 |
.70 |
.76 |
.58 |
−0.4 |
13.7 |
8.8 |
20.3 |
|
.83 |
.82 |
.70 |
.65 |
5.3 |
7.4 |
18.7 |
25.7 |
|
.98 |
.98 |
.95 |
.92 |
.3 |
.9 |
2.5 |
6.0 |
|
.85 |
.59 |
.77 |
.47 |
4.5 |
23.0 |
10.6 |
26.1 |
|
.93 |
.84 |
.91 |
.74 |
4.2 |
13.5 |
2.0 |
13.7 |
|
.89 |
.83 |
.91 |
.79 |
−15.1 |
−10.4 |
−2.2 |
5.6 |
|
.94 |
.88 |
.94 |
.88 |
−8.4 |
−4.3 |
−0.3 |
−0.1 |
|
.99 |
.98 |
.97 |
.94 |
.0 |
.6 |
1.3 |
4.3 |
TABLE 4-6b Trends in Percentage Completed 4+ Years, by Age Group: 24 sub-Saharan African Countries
|
Country |
Survey Date |
Ages 10-24 |
Ages 15-19 |
|
|
2000 Population |
Boys |
Girls |
||
|
Benin |
2001 |
2,115 |
.62 |
.36 |
|
Burkina Faso |
1998-1999 |
3,976 |
.30 |
.18 |
|
Cameroon |
1998 |
4,996 |
.78 |
.72 |
|
Central African Republic |
1994-1995 |
1,199 |
.56 |
.35 |
|
Chad |
1996-1997 |
2,491 |
.36 |
.14 |
|
Comoros |
1996 |
240 |
.64 |
.49 |
|
Côte d’Ivoire |
1998-1999 |
5,595 |
.57 |
.41 |
|
Ethiopia |
1999 |
19,988 |
.31 |
.21 |
|
Ghana |
1998-1999 |
6,581 |
.85 |
.79 |
|
Guinea |
1999 |
2,637 |
.49 |
.25 |
|
Kenya |
1998 |
11,306 |
.91 |
.91 |
|
Madagascar |
1997 |
5,025 |
.41 |
.43 |
|
Malawi |
2000 |
3,722 |
.72 |
.72 |
|
Mali |
2001 |
3,652 |
.35 |
.23 |
|
Mozambique |
1997 |
5,848 |
.56 |
.34 |
|
Niger |
1998 |
3,505 |
.36 |
.18 |
|
Nigeria |
1999 |
37,637 |
.83 |
.73 |
|
Rwanda |
2000 |
2,689 |
.57 |
.57 |
|
South Africa |
1998-2000 |
13,715 |
.96 |
.98 |
|
Togo |
1998 |
1,496 |
.69 |
.47 |
|
Uganda |
2000-2001 |
7,757 |
.83 |
.74 |
|
United Republic of Tanzania |
1999 |
11,845 |
.73 |
.70 |
|
Zambia |
2001-2002 |
3,521 |
.80 |
.77 |
|
Zimbabwe |
1999 |
4,489 |
.95 |
.95 |
|
SOURCE: United Nations (2001); DHS household data. |
||||
|
Ages 25-29 |
Ages 35-39 |
Change for Most Recent Decade |
Change for Earlier Decade |
||||
|
Boys |
Girls |
Boys |
Girls |
Boys |
Girls |
Boys |
Girls |
|
.46 |
.22 |
.47 |
.18 |
34.5 |
66.0 |
−1.7 |
17.5 |
|
.21 |
.10 |
.13 |
.08 |
41.5 |
84.9 |
62.7 |
31.8 |
|
.82 |
.65 |
.73 |
.54 |
−5.2 |
10.3 |
13.1 |
20.9 |
|
.58 |
.32 |
.52 |
.18 |
−3.6 |
7.9 |
10.6 |
82.7 |
|
.34 |
.08 |
.29 |
.07 |
7.4 |
83.1 |
16.2 |
8.9 |
|
.63 |
.44 |
.35 |
.15 |
2.3 |
12.2 |
79.3 |
189.3 |
|
.59 |
.43 |
.50 |
.27 |
−3.2 |
−5.9 |
16.9 |
59.3 |
|
.37 |
.20 |
.29 |
.08 |
−16.1 |
6.7 |
24.9 |
145.9 |
|
.84 |
.62 |
.77 |
.60 |
1.5 |
26.7 |
8.7 |
3.8 |
|
.35 |
.15 |
.31 |
.12 |
38.7 |
65.9 |
13.5 |
25.5 |
|
.93 |
.89 |
.91 |
.72 |
−2.5 |
2.3 |
2.3 |
22.5 |
|
.57 |
.56 |
.55 |
.42 |
−28.1 |
−22.4 |
4.4 |
32.1 |
|
.70 |
.48 |
.66 |
.38 |
3.3 |
49.2 |
4.8 |
25.6 |
|
.25 |
.14 |
.25 |
.15 |
41.1 |
64.3 |
−1.2 |
−5.8 |
|
.50 |
.30 |
.52 |
.18 |
13.0 |
13.9 |
−5.0 |
67.4 |
|
.27 |
.15 |
.16 |
.07 |
33.1 |
21.1 |
69.4 |
108.9 |
|
.79 |
.64 |
.76 |
.48 |
4.9 |
14.5 |
5.0 |
33.5 |
|
.65 |
.62 |
.52 |
.37 |
−12.1 |
−8.2 |
25.2 |
69.0 |
|
.93 |
.91 |
.89 |
.84 |
3.3 |
6.6 |
4.7 |
8.8 |
|
.64 |
.33 |
.61 |
.27 |
7.7 |
44.3 |
4.9 |
22.7 |
|
.78 |
.58 |
.71 |
.46 |
6.1 |
27.1 |
9.7 |
25.6 |
|
.83 |
.78 |
.85 |
.54 |
−10.9 |
−9.2 |
−2.7 |
43.3 |
|
.85 |
.78 |
.87 |
.71 |
−5.5 |
−1.3 |
−2.1 |
10.3 |
|
.97 |
.94 |
.91 |
.72 |
−2.0 |
1.0 |
6.7 |
30.7 |
TABLE 4-6c Trends in Percentage Completed Primary, by Age Group: 24 sub-Saharan African Countries
|
Country |
Survey Date |
Ages 10-24 |
Ages 20-24 |
|
|
2000 Population |
Boys |
Girls |
||
|
Benin |
2001 |
2,115 |
.38 |
.17 |
|
Burkina Faso |
1998-1999 |
3,976 |
.25 |
.12 |
|
Cameroon |
1998 |
4,996 |
.69 |
.60 |
|
Central African Republic |
1994-1995 |
1,199 |
.40 |
.22 |
|
Chad |
1996-1997 |
2,491 |
.29 |
.07 |
|
Comoros |
1996 |
240 |
.51 |
.41 |
|
Côte d’Ivoire |
1998-1999 |
5,595 |
.46 |
.34 |
|
Ethiopia |
1999 |
19,988 |
.23 |
.14 |
|
Ghana |
1998-1999 |
6,581 |
.80 |
.62 |
|
Guinea |
1999 |
2,637 |
.36 |
.15 |
|
Kenya |
1998 |
11,306 |
.70 |
.62 |
|
Madagascar |
1997 |
5,025 |
.31 |
.32 |
|
Malawi |
2000 |
3,722 |
.44 |
.26 |
|
Mali |
2001 |
3,652 |
.24 |
.12 |
|
Mozambique |
1997 |
5,848 |
.18 |
.08 |
|
Niger |
1998 |
3,505 |
.30 |
.14 |
|
Nigeria |
1999 |
37,637 |
.79 |
.65 |
|
Rwanda |
2000 |
2,689 |
.40 |
.36 |
|
South Africa |
1998-2000 |
13,715 |
.86 |
.90 |
|
Togo |
1998 |
1,496 |
.50 |
.22 |
|
Uganda |
2000-2001 |
7,757 |
.47 |
.32 |
|
United Republic of Tanzania |
1999 |
11,845 |
.71 |
.67 |
|
Zambia |
2001-2002 |
3,521 |
.68 |
.54 |
|
Zimbabwe |
1999 |
4,489 |
.88 |
.86 |
|
SOURCE: United Nations (2001); DHS household data. |
||||
|
Ages 30-34 |
Ages 35-44 |
Change for Most Recent Decade |
Change for Earlier Decade |
||||
|
Boys |
Girls |
Boys |
Girls |
Boys |
Girls |
Boys |
Girls |
|
.34 |
.16 |
.26 |
.10 |
13.4 |
5.8 |
29.2 |
64.2 |
|
.15 |
.06 |
.12 |
.04 |
72.4 |
89.2 |
24.2 |
61.4 |
|
.67 |
.43 |
.57 |
.31 |
2.9 |
39.7 |
17.9 |
40.5 |
|
.38 |
.18 |
.26 |
.06 |
5.1 |
24.5 |
45.6 |
210.8 |
|
.21 |
.04 |
.17 |
.02 |
40.8 |
72.2 |
22.8 |
123.1 |
|
.48 |
.26 |
.20 |
.07 |
5.3 |
58.3 |
140.1 |
290.0 |
|
.44 |
.27 |
.37 |
.28 |
6.5 |
27.0 |
16.8 |
−3.7 |
|
.25 |
.08 |
.16 |
.03 |
−7.6 |
75.6 |
51.7 |
209.9 |
|
.74 |
.51 |
.73 |
.49 |
7.0 |
21.8 |
1.6 |
5.1 |
|
.31 |
.11 |
.27 |
.09 |
14.4 |
31.3 |
14.7 |
23.3 |
|
.81 |
.65 |
.73 |
.41 |
−13.1 |
−4.7 |
10.4 |
60.5 |
|
.45 |
.39 |
.30 |
.22 |
−30.8 |
−17.5 |
47.8 |
75.4 |
|
.37 |
.15 |
.33 |
.11 |
18.7 |
69.9 |
12.9 |
34.8 |
|
.19 |
.09 |
.21 |
.07 |
27.3 |
25.6 |
−12.3 |
28.1 |
|
.20 |
.08 |
.13 |
.02 |
−6.9 |
10.8 |
51.0 |
309.8 |
|
.20 |
.09 |
.11 |
.04 |
49.9 |
57.6 |
79.3 |
122.7 |
|
.72 |
.52 |
.60 |
.31 |
9.4 |
24.8 |
19.0 |
69.3 |
|
.41 |
.31 |
.31 |
.19 |
−3.4 |
15.6 |
35.0 |
67.4 |
|
.78 |
.73 |
.65 |
.61 |
10.3 |
22.4 |
19.8 |
20.6 |
|
.53 |
.19 |
.42 |
.14 |
−5.0 |
15.3 |
27.2 |
34.8 |
|
.44 |
.24 |
.44 |
.21 |
7.9 |
34.9 |
.0 |
11.4 |
|
.75 |
.62 |
.51 |
.30 |
−5.6 |
8.7 |
48.6 |
108.2 |
|
.75 |
.53 |
.78 |
.46 |
−8.7 |
1.5 |
−4.1 |
15.2 |
|
.88 |
.74 |
.68 |
.41 |
.6 |
16.4 |
29.6 |
79.1 |
1993; Nieuwenhuis, 1996). The effect of these recent trends are particularly pronounced for the most recent cohort of boys, with a recent drop off in attendance and the projected stagnation in grade 4 and primary completion rates. For girls, these trends are only beginning to be revealed in attendance rates for the youngest cohort.
With continual progress in girls’ schooling in the past 10 years and increasing gender parity ratios in levels of attainment, questions remain as to how the international community can focus its limited resources and attention to maximize the possibility of attaining the EFA goals and MDG. Since the Jomtien Conference in 1990, the international community has placed a great degree of weight on investments in girls’ schooling, given gender gaps that have historically favored boys in most of the developing world (UNESCO, 2003; UNICEF, 2003a, 2003b, 2003c). The trends in education for girls provide some evidence that those investments have had the intended impact. With the potential closing of the gender gap in sub-Saharan Africa in the near future, albeit at levels significantly below universal primary completion, remaining disadvantaged groups need to be identified, and policies developed, for achieving further progress in educational participation and attainment. Household surveys from the DHS provide an opportunity for focusing attention on the critical remaining challenges in achieving education for all.
Although the UNESCO data do not allow us to explore differential educational attainment by household living standards, this is possible with DHS data. The DHS data are particularly advantageous in this way for EFA monitoring, given that many current reform efforts, in the presence of resource constraints, are attempting to target resources where they are most needed. Based on a methodology for generating a household wealth index utilizing Principal Components analysis (Filmer and Pritchett, 1999)16 and the indicator of grade 4 completion, we develop an index of educational
inequality by household wealth.17 The inequality index is calculated as 1 minus the ratio of the grade 4 attainment of the poorest 40 percent of households, relative to the wealthiest 20 percent of households. This measure of educational inequality ranges from 0 to 1, with 0 representing complete parity of attainment between the wealthiest 20 percent and the poorest 40 percent in each country and a value of 1 indicating a complete lack of educational opportunities for the poor. A measure of 0.5 implies that the poor have obtained 50 percent of the levels of attainment of the wealthiest.
Figure 4-4 presents the inequality index for grade 4 completion by wealth status and gender. The countries are ordered from low to high inequality using the index for boys. The index varies across the full range of possible values among the 24 countries. Roughly half the countries have indices for both boys and girls that exceed 50 percent, suggesting wide differentials in educational attainment by household socioeconomic status in sub-Saharan Africa. These include Central African Republic, Mozambique, Niger, Chad, Guinea, Benin, Ethiopia, Madagascar, Burkina Faso, and Mali. In many of these countries, the inequality index takes on extreme values ranging from 70 to 90 percent, indicating almost a complete lack of educational opportunities for the poor. A few additional countries have levels of inequality that exceed 50 percent only for girls, including Comoros, Togo, and Côte d’Ivoire. On the other hand, we see that certain countries have achieved near universal schooling even for the poor. These include Kenya, Zimbabwe, and South Africa. Relatively low inequality, in the 0 to 0.25 range, can be seen for both sexes in Ghana and Rwanda and for boys in Tanzania.
In many countries, the index of inequality is substantially higher for girls than boys, supporting the widely held belief that gender inequalities in educational attainment are compounded among the poor. Differences of 10 percentage points or more in the index between boys and girls can be found in 13 of the 24 countries. Such gender differences tend to be greatest in countries where overall wealth inequalities are greatest. It is interesting to note, however, that this pattern is not universal. In a substantial minority of countries, representing the full range in terms of schooling inequalities by household wealth status, we find similar levels of inequality for both boys and girls. These include Kenya, Zimbabwe, South Africa, Ghana, Rwanda, Malawi, Zambia, Cameroon, Madagascar, Burkina Faso, and Mali. We
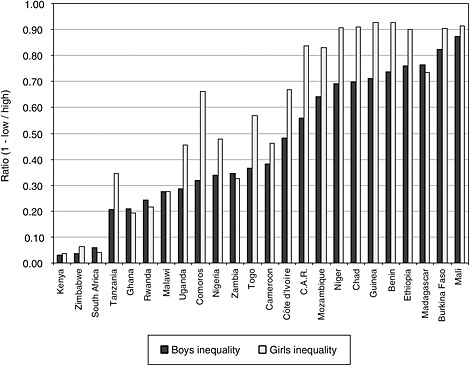
FIGURE 4-4 Index of inequality in grade 4 completion, 15- to 19-year-olds, by household wealth status and gender.
SOURCE: DHS household data.
find a few countries where inequalities for boys are greater than inequalities for girls: South Africa, Ghana, Rwanda, Zambia, and Madagascar.
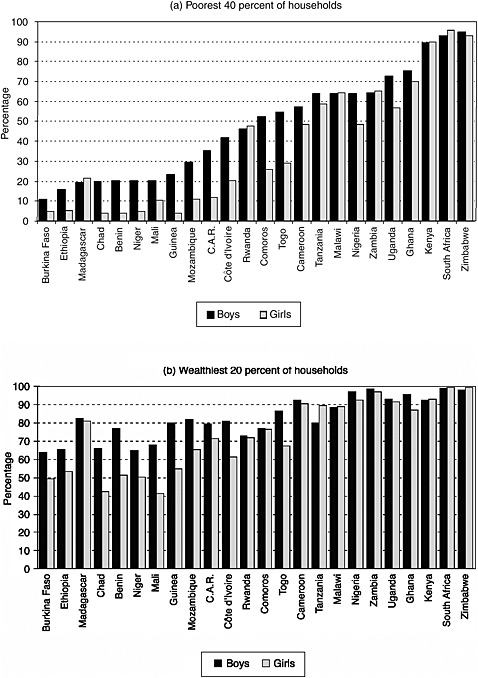
Figure 4-5 shows levels of grade 4 completion currently achieved by the wealthiest 20 percent of 10- to 14-year-olds in each country, graded from low to high according to the achievement of boys. We see that for many countries at the turn of the century, near universal grade 4 completion has already been achieved for the economically better off. For many others, such an achievement is likely within the next 15 years. For a few countries, however, even the wealthiest 20 percent have a long way to go. This group would include some of the poorest countries: Chad, Ethiopia, Niger, Burkina Faso, and Mali. While in the majority of countries, the gender gap among children from the wealthiest households has narrowed or almost disappeared, this is not the case in much of francophone Africa, including Burkina Faso, Niger, Chad, Mali, Benin, Guinea, Côte d’Ivoire, and Togo. Gender gaps among the wealthy remain large in Ethiopia and Mozambique as well.
These results suggest that educational reform measures need to be tailored carefully to each country’s situation based on recent and accurate measures of the performance of different subgroups of the population. At the country level, DHS data permit other breakdowns as well, including provincial and rural-urban breakdowns. Although many of these breakdowns could be developed within a well-designed MIS, this would not be the case for indicators that require data that are collected at the household level, such as living standards. Given the enormous financial and organizational mobilization that will be required to achieve the millennium goals, resources will need to be targeted to the particular population subgroups that are lagging behind. As is illustrated here, a proper monitoring program will require information on the relative progress of the poor.
CONCLUSIONS
At the turn of the twenty-first century, we estimate that 37.2 million young adolescents ages 10 to 14 in sub-Saharan Africa will not complete primary. Reducing the number of uneducated African youth is a primary objective of signatories of the Education for All framework, as well as the United Nations MDG for education (United Nations, 2001). Achieving these goals in the time frame desired will require a level of resources and commitment not previously seen; it will also require more effective tools for monitoring progress.
We conclude from our assessment of UNESCO’s two indicators for monitoring progress toward EFA and the MDG that UNESCO data may provide a potentially misleading picture of current progress. Not only are rates of enrollment significantly higher relative to attendance data from nationally representative DHS surveys, but gender parity ratios suggest a greater remaining gap in attendance than comparable DHS data. Part of the problem arises from UNESCO’s reliance on management information systems to make cross-country comparisons. This results in the publication of data of variable quality, with limited comparability across countries and over time. Reliance on such data to track progress toward the millennium goals should be carefully weighed. At a minimum, UNESCO data should be consistently evaluated vis-à-vis alternative data sources and indicators. Although UNESCO will likely remain committed to the net primary enrollment ratio and survival to grade 5 indicators, strides have already been made in utilizing a wider array of attainment data (UNESCO, 2003, Table 2.13).
Nationally representative household data provide a useful baseline from which to build. UNICEF’s Multiple Indicator Cluster Survey and the DHS, both of which collect information on the educational participation and attainment of household members, are collected in a large enough number
of countries for cross-national and regional comparisons of educational progress. Since 2000, DHS household questionnaires have been expanded to allow the possibility of creating additional schooling indicators, including some which are directly comparable to commonly used UNESCO indicators. This is part of a relatively new project undertaken by the DHS with support from the USAID’s Office of Human Capacity Development, which includes the production of country-level fact sheets of education indicators. Furthermore, as part of the same project, the DHS is beginning to launch a series of in-depth surveys on education in sub-Saharan Africa in conjunction with its regular surveys. The first report was recently published on Uganda; results for Malawi and Zambia will follow shortly. This effort would require substantial expansion if it were to take on EFA monitoring throughout the world.
Even with the limited education data already collected in the traditional DHS, much can be learned about past trends and the current status of schooling in sub-Saharan Africa. The trends in primary schooling completion for sub-Saharan Africa implied by these data raise serious questions about the feasibility of achieving the EFA goals and MDG in the foreseeable future. It is even possible that some earlier gains could be lost, given recent declines in attendance rates among the youngest boys and the tapering off in attendance rates among the youngest cohort of girls in many countries. It would also appear that, for the indicators utilized in this chapter, the gap between boys and girls is closing rapidly for the region as a whole. These trends in gender parity ratios are occurring despite huge variations in overall levels of educational attainment. Consequently, these findings raise doubts about the likelihood that EFA goals can be achieved with a strategy limited to an emphasis on girls’ schooling.
The education gap between girls and boys has declined largely because of the impressive improvement in schooling for girls in sub-Saharan Africa. Although a large portion of this change occurred decades ago, growth continued in girls’ education in the 1980s and 1990s, despite significant economic setbacks. A thorough understanding of the reasons for disparate trends in boys’ and girls’ education over the past 30 years will require more research. Our data do not allow us to tease out the many possibilities, including rising returns to the education of girls (either market or nonmarket), the diffusion of global cultural values relating to the importance of girls’ schooling, and the effects of school reform.
The schooling gap that remains most significant is the gap between the poorest and wealthiest households. Others have also posited the importance of household wealth in relation to schooling. Filmer and Pritchett (1999) provided documentation of the differential in educational attainment by household wealth status using data from many of the DHS available a few years ago. Even earlier, Knodel and Jones (1996), using school-
ing data from Vietnam and Thailand, raised questions about the heavy emphasis on girls’ schooling in the international community given the much wider gaps in schooling by household wealth. This chapter offers a new comparison of the size of gender gaps and wealth gaps across most of the countries of sub-Saharan Africa using several widely accepted schooling indicators. With the gender gap closing in many cases at levels of educational attainment that fall far short of universal primary schooling, new strategies will need to be devised to reach the poorest parents and their children.
REFERENCES
Behrman, J.R., and Rosenzweig, M.R. (1994). Caveat emptor: Cross-country data on education and the labor force. Journal of Development Economics, 44(1), 147-171.
Bruns, B., Mingat, A., and Rakotomalala, R. (2003) Achieving universal primary education by 2015: A chance for every child. Washington, DC: World Bank.
Dakar Framework for Action. (2000). Education for all: Meeting our collective commitments. Text adopted by the World Education Forum, April 26-28, Dakar, Senegal.
de Walque, D. (2002). How does the impact of an HIV/AIDS information campaign vary with educational attainment? Evidence from rural Uganda. (Population Research Center, Discussion Paper Series, No. 2002-16.) Chicago, IL: University of Chicago Press.
Donors to African Education. (1994). A statistical profile of education in sub-Saharan Africa in the 1980s. Paris, France: Author, International Institute for Education Planning.
Filmer, D., and Pritchett, L. (1999). The effect of household wealth on educational attainment: Evidence from 35 countries. Population and Development Review, 25(1), 85-120.
Glynn, J.R., Carael, M., Buve, A., Anagonou, S., Zekeng, L., Kahindo, M., and Musonda, R. (2004). Does increased general schooling protect against HIV infection? A study in four African cities. Tropical Medicine and International Health, 9(1), 4-14.
Hargreaves, J.R., and Glynn, J.R. (2002). Educational attainment and HIV-1 infection in developing countries: A systematic review. Tropical Medicine and International Health, 7(6), 489-498.
Hodd, M. (1989). A survey of the African economies. In S. Moroney (Ed.), Handbooks to the modern world: Africa (pp. 787-809). New York: Oxford University Press.
Kinyanjui, K. (1993). Enhancing women’s participation in the science-based curriculum: The case of Kenya. In J. Ker Conway and S.C. Bourque (Eds.), The politics of women’s education: Perspectives from Asia, Africa, and Latin America (pp. 133-148). Ann Arbor: University of Michigan Press.
Knodel, J., and Jones, G.W. (1996). Post-Cairo population policy: Does promoting girls’ schooling miss the mark? Population and Development Review, 22(4), 683-702.
Lloyd, C.B., Kaufman, C.E., and Hewett, P.C. (1999). The spread of primary schooling in sub-Saharan Africa: Implications for fertility change. (Policy Research Division Working Paper No. 127.) New York: Population Council.
Lloyd, C.B., Kaufman, C.E., and Hewett, P.C. (2000). The spread of primary schooling in sub-Saharan Africa: Implications for fertility change. Population and Development Review, 26(3), 483-515.
Lloyd, C.B., Mensch, B.S., and Clark, W.H. (2000). The effects of primary school quality on school dropout among Kenyan girls and boys. Comparative Education Review, 44(2), 113-147.
Moulton, J., Mundy, K., Welmond, M., and Williams, J. (2001). Paradigm lost? The implementation of basic education reforms in sub-Saharan Africa. In SD Publication Series Office of Sustainable Development, Bureau for Africa. (Technical Paper No. 109.) Washington, DC: U.S. Agency for International Development.
Nieuwenhuis, F.J. (1996). The development of education systems in postcolonial Africa: A study of a selected number of African countries. Pretoria, South Africa: Human Sciences Research Council.
Reimers, F. (1994). Education and structural adjustment in Latin America and Sub-Saharan Africa. International Journal of Educational Development, 14(2), 119-129.
Sahn, D.E., and Stifel, D.C. (2003). Progress toward the Millennium Development Goals in Africa. World Development, 31(1), 23-52.
Tomasevski, K. (2001). Free and compulsory education for all children: The gap between promise and performance. (Right to Education Primers No. 2.) Lund and Stockholm, Sweden: Raoul Wallenberg Institute and Swedish International Development Cooperation Agency.
UNESCO. (2002). Education for all: Is the world on track? EFA global monitoring report 2002. Paris, France: UNESCO.
UNESCO. (2003). Education for all global monitoring report 2003/4: Gender and education for all: The leap to equality. Paris, France: UNESCO.
UNICEF. (2003a). Accelerating progress in girls’ education. New York: UNICEF.
UNICEF. (2003b). Making investments in girls’ education count. New York: UNICEF.
UNICEF. (2003c). The state of the world’s children 2004—Girls education and development. New York: UNICEF.
United Nations. (2001). World population prospects: The 2000 revision: Comprehensive Tables: Vol. 1. New York: Author, Department of Economic and Social Affairs, Population Division.
United Nations General Assembly. (2001). Road map towards the implementation of the United Nations Millennium Declaration. In Report of the Secretary-General. New York: United Nations, Department of Public Information.
World Bank. (1988). Education in sub-Saharan Africa: Policies for adjustment, revitalization, and expansion. Washington, DC: Author.
World Bank. (2002). World Development Indicators 2002. Washington, DC: Author.


