D
Quantifying Self-Interest in Organ Donation
Historically, the donation of solid organs (e.g., the heart, kidney, liver, and lung) has been discussed primarily in terms of charity, compassion, generosity, empathy, and philanthropy. It can also be argued, however, that people have a personal interest in maintaining a community that provides options such as organ donation. This motive is usually discussed in qualitative terms as a philosophic principle.
This motive can also be viewed in terms of traditional (and more narrowly focused) self-interest; that is, how does this apply to me? From this view, the natural questions are “Could this happen to me?” and, if so, “How likely is it to happen to me?” The committee has written this appendix in an attempt to quantify self-interest by roughly estimating the probability that solid-organ donation will touch the life of a given person or someone close to him or her over various periods of time. The derivation and sample computations follow below, including a chart that compares the risk that solid-organ donation will touch the life of a given person or someone close to him or her with other risks.
In the end, the likelihood that over the course of a lifetime a given person or someone that he or she cares about will need a solid-organ transplant is surprisingly high (about 1 in 5). Although this committee’s focus is strictly on solid organs, each year there are many more transplants of other tissues than there are of solid organs. If tissue transplants are also considered, the average risk of the need for a transplant that each person and the individuals in his or her close social network faces over a lifetime rises substantially and certainly rises to more than one person in two.
These computations could be refined to produce more exact figures, but a clear conclusion emerges: even if charitable motives are discounted, people still have a substantial personal interest in maintaining a system in which organ transplants are available.
NOTATION
The notations used in the equations presented in this appendix are defined as follows:
|
N |
= |
total relevant population, |
|
w |
= |
annual number of additions to the waiting list for a solid-organ transplant, |
|
y |
= |
number of years in which a person might be on a waiting list for an organ, |
|
g |
= |
number of people in a person’s “close” social network, and |
|
pg,y |
= |
probability that at least one of g specified people will be placed on a waiting list in a y-year period. |
ASSUMPTIONS
For the simple base model presented here, assume that all people have the same probability of being placed on a waiting list for organ transplantation in any given year and that their fates are independent of each other. Also assume that the proportion of the population that is added to the waiting list in a given year and the age distribution of the population are constant over the years. These assumptions are not crucial to the qualitative results but greatly simplify the initial analysis and exposition and can be relaxed in a more general derivation later.
The probability that the average person will be placed on a waiting list for a solid organ in a given year (g = 1, y = 1) is a simple relative frequency
(1)
The probability that at least one of a specified group of g people will be placed on a waiting list in a given year is
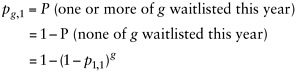
(2)
The general expression for any group of g people and y years is given by
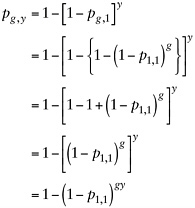
(3)
Next, apply Equation 3 to several relevant situations (i.e., different combinations of y and g). Some of these situations are described in detail below.
1. What is the probability that a randomly selected person will need an organ in a given year? For this estimate, assume the rough current values, where w is equal to 40,000 and the U.S. population (N) is equal to 300,000,000 (g = 1, y = 1).
2. What is the lifetime probability that a randomly selected person will need an organ? A 75-year life span is assumed (g = 1, y = 75).
3. What is the probability that someone whom the person cares about will need an organ? The average number of “close” people in a person’s family and social networks has been variously estimated by sociologists to be anywhere from 10 to 200, depending on how “close” is defined. The calculation here is interested in the number of people that a person knows for whom, if they needed a transplant, it would be of emotional significance to the target person. For this purpose, numbers in the several dozens seem a bit high. Assume for now a more conservative value of 20. Then, together with the person’s own risk, there are 21 chances in a given year that a person will need an organ transplant (g = 21, y = 1):
and the lifetime probability is (g = 21, y = 75):
4. Sensitivity analysis. This base model uses several assumptions. Here, briefly consider the implications of relaxing some of them, as described below. Overall, the assumptions are conservative, in the sense that they probably produce an underestimation of the true number of people who will eventually find themselves on an organ transplant waiting list.
-
All people have the same probability of being placed on an organ transplant waiting list in any given year. The chance of needing an organ differs depending on various individual characteristics. Thus, different subgroups would have different probabilities, but the overall probability is the same as that given above if these subgroups are weighted according to their relative frequency in the population. Over time, however, this could change. For example, age is a characteristic that has a large impact. Up until approximately age 65 years of age the likelihood of being placed on an organ transplant waiting list increases with age. The American population has been aging over time, and this trend is projected to continue into the foreseeable future. Thus, with respect to age, the base model presented above will underestimate the probability in future years, with all other characteristics being equal. The impact of decomposing the analysis according to other characteristics will depend on whether the categories of individuals with greater risk are increasing or decreasing over time.
-
Individual fates are unconnected. This assumption is probably true most of the time for people who are not related. Although some diseases that increase the possibility of needing an organ are hereditary to some degree, if anything, this positive correlation produces an even larger number of additions to the waiting list.
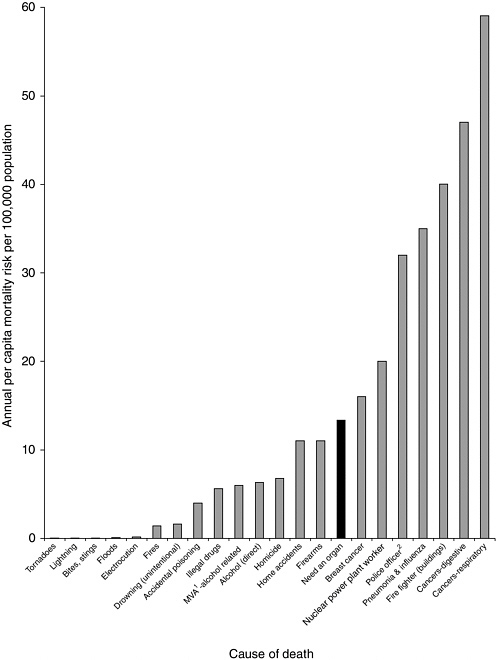
5. How do these probabilities compare with those for other more familiar risks? Figure D-1 shows how these probabilities compare with those for other more familiar risks.
REFERENCE
Wilson R, Crouch EA. 2001. Risk-Benefit Analysis, 2nd ed. Cambridge, MA: Harvard University Press.