
5
Recurring and Nonrecurring Cost Estimations
This chapter details the approach used to estimate the recurring and nonrecurring costs of the re-engining and engine modifications proposed in Chapter 1. The committee employs various methods to estimate the costs and benefits of switching to newer engines with better fuel efficiency and improved reliability. For each of the alternatives, it calculates the net present value (NPV), which lets it see if the Air Force might be able to recoup its investment costs through savings from lower fuel consumption and fewer hours spent in maintenance.
ANALYSIS APPROACH
The life-cycle cost (LCC) section includes an analysis of LCC and a partial NPV analysis for all re-engining and engine modification alternatives. This analysis is not a complete benefit/cost analysis since not all benefits associated with engine modifications, re-engining, and airframe modification to achieve fuel savings or reliability, maintainability, and availability improvements, and/or performance improvements are monetized. It does not attempt to account for the residual value of engines (which, in general, could improve the case for re-engining or engine modification) after re-engined airframe retirement or for any national benefit from reduced dependence on imported foreign oil.
The committee believes that no such analysis was feasible within the time constraints of this study. However, it recommends that such an analysis be undertaken on selected options by the Air Force prior to any final decision. In particular, the Air Force should consider the potential cost-saving or capability-enhancing changes to force structure that would be enabled by re-engining existing platforms.
The NPV analysis does, however, look at the recurring and nonrecurring costs as well as the benefits that result from engines having improved reliability and specific fuel consumption (SFC). The analysis is performed for the aircraft/engine combinations listed in Table 5-1.
TABLE 5-1 Aircraft/Engine Combinations
|
Aircraft Designation |
Current Enginea |
Re-engine Candidate |
Re-engining |
Engine Modification/Upgrade |
|
KC-135R |
F108 (CFM 56-2) |
|
No |
Yes |
|
B-52 |
TF33 (JT3D) |
F117 (4), CFM56 (4), CFM34 (8) |
Yes |
No |
|
C-5 |
TF39 |
CF6-80 |
Ongoing |
No |
|
C-130H |
T56 (T56) |
AE 2100, PW150 |
Yes |
Yes |
|
KC-135D/E |
TF33 (JT3D) |
CFM56-2, JT8D-219 |
Yes |
No |
|
KC-10 |
CF6-50 (CF6-50) |
|
No |
Yesb |
|
B-1 |
F101 |
F101 SLEP, F119, Derivative F119 |
Yesb |
Yesb |
|
E-3 |
TF33 (JT3D) |
CFM56-2 and -7, JT8D-219 |
Yes |
No |
|
E-8 |
TF33 (JT3D) |
JT8D-219, CFM56-2 and -7 |
Ongoing |
No |
|
aMilitary designations shown. Designations in parentheses are commercial engine equivalents where they exist. bEntries corrected after release of the January 31, 2007, prepublication version of the report. An entry for the C-17 was also deleted at that time. |
||||
Nonrecurring Costs
Nonrecurring costs include any costs of the research and development (R&D), testing and evaluation efforts associated with airframe modification, engine modification, nacelle redesign, pylon redesign, other subsystems redesign, flight testing, weapons separation design efforts related to new tooling requirements, and all systems engineering and program management by contractors and the government.
Recurring Costs
The recurring costs would include the unit cost of new engines, of installation kits (engine and airframe modifications), of logistical support, of training, tooling, and test equipment, of spares, data, etc.
Costs and Benefits to Operations and Support
The benefits to operations and support (O&S) would include the impact of fuel savings attributed to more fuel-efficient engines. They also include the impact of improvements in engine reliability and maintainability on cost of mission maintenance personnel, consumables, depot-level reparables (DLRs), and engine overhaul. These elements are defined by the Cost Analysis Improvement Group (CAIG) in the Office of the Secretary of Defense (OSD) as follows:
-
Maintenance personnel cost reflects the pay and allowances of military and civilian personnel who support and perform maintenance on the engine. Depending on the maintenance concept and the organizational structure, this element will include maintenance personnel at the organizational level and, possibly, the intermediate level.
-
Consumables are materials and bits-and-pieces repair parts that are used up or consumed during maintenance.
-
DLRs are the unit-level cost of reimbursing the stock fund for purchases of the DLR spares (also referred to as exchangeables) used to replace initial stocks. DLRs may include repairable
-
individual parts, assemblies, or subassemblies that are required on a recurring basis for the repair of major end items of equipment.
-
And, finally, depot overhaul costs are typically for the most complex work that requires expertise or equipment not available at the organizational or intermediate levels.
Maintenance and Fuel Savings
As shown in Figure 1-1 in Chapter 1, the Air Force uses over half of the fuel consumed by DoD, and a significant share of that fuel is used to power nonfighter aircraft. Further, as reported in the Air Force Total Ownership Cost (AFTOC) database and as displayed in Figure 2-1 in Chapter 2, the cost of engine O&S was about 20 percent of all aircraft O&S costs in FY05. Engine maintenance and fuel costs form a substantial portion of the Air Force’s budget.
Re-engining nonfighter aircraft presents the Air Force with an opportunity to consider more fuel-efficient and reliable engines. Similarly, modification or upgrade of current engines can incorporate design improvements to improve reliability and fuel efficiency. However, the costs of these improvements are not inconsequential. Thus, the benefits of the fuel savings and reduction in maintenance need to be balanced against the cost of the investments.
The next section describes the methodology used in the NPV analysis of the nonrecurring and recurring costs, and fuel and maintenance savings.
METHODOLOGY AND BASIS FOR THE ESTIMATE
There are three standard methods of estimating costs: analogy, parametric, and engineering bottom-up. The analogy method is fairly simple. It draws from actual program costs or historical cost information from a legacy program of similar technology and complexity. Sometimes simple adjustments to the legacy data may be necessary to facilitate estimating the cost of the new system. The second way to estimate cost is parametric modeling, a statistical method that also uses historical data, regressing cost or hours—the dependent variable—against a series of independent variables. These independent variables are often parameters related to the system performance: physical or programmatic characteristics. The resultant relationship is often called a cost-estimating relationship (CER). The third method is the engineering bottom-up method, which is a much more detailed approach. Where the committee was unable to obtain the necessary information needed to use one of the above methodologies, it relied on expert judgment.
The committee’s analysis includes estimates of nonrecurring and recurring costs based on CERs developed by RAND for use in the conceptual design of new aeronautical systems and previously published (Younossi et al., 2002). Table 5-2 summarizes these CERs.1 The RAND CER for the nonrecurring costs estimates the cost of developing a new derivative engine. For the purposes of this analysis, the committee assumes that the re-engining effort amounts to only 10 percent of the costs estimated by
|
1 |
For the prepublication version of this report, the committee estimated the recurring costs for the various aircraft/engine combinations using the RAND CER for recurring unit costs (Table 5-2) or, for those cases for which it was available; the committee used market data to estimate recurring costs. This method meant, however, that some of the aircraft/engine cost estimates based on CERs were being compared with other estimates using both CERs and market data. When the committee’s analysis was redone for this final report, recurring costs were estimated using the RAND CER only. The reason for this change was to provide a consistent source of data. |
TABLE 5-2 Nonrecurring and Recurring Cost Estimating Relationships
|
Cost Element |
Methodology |
|||||||||
|
Nonrecurring costs for derivative engine |
lnrd01m = −339.422 + 5.066 lnritf − 1.299 lnTSFC + 0.582 lnfsth |
|||||||||
|
|
|
|
(4.45) |
|
(−3.89) |
|
(5.32) |
|
|
|
|
R-squared = 0.8332 Adj R-squared = 0.8068 Root MSE = 0.40575 |
||||||||||
|
lnrd01m, natural log of the development cost in million 2001 dollars; lnritf, natural log of the rotor inlet temperature (F°); lnTSFC, natural log of the thrust-specific fuel consumption (lb/hr/lb); and lnfsth, natural log of full-scale test hours. |
||||||||||
|
Recurring unit costs |
lnT1 = −110.4 − 8.55 lnslope + 0.482 ab + 1.162 lnritf + 0.2615 lndryw |
|||||||||
|
|
|
(−13.02) |
|
(4.595) |
(3.626) |
|
(2.416) |
|
||
|
R-squared = 0.9703 Adj R-squared = 0.9641 Root MSE = 0.13703 |
||||||||||
|
lnT1, natural log of the production price for first unit in million 2001 dollars; lnslope, natural log of the cost improvement curve slope; ab, binary variable (1) if afterburning engine, (0) if not; lndrywt, natural log of the dry weight for the engine (lb); and lnritf, natural log of the rotor inlet temperature (F°). |
||||||||||
the RAND CER since the candidate engines are already developed. This amount estimated is thereby intended to account for the integration and additional testing efforts only.2
Fuel Consumption
The usual practice in figuring fuel consumption, particularly in the case of acquiring a new system, is to specify a spectrum of mission profiles and meticulously calculate the fuel burn rate averaged over that spectrum. For new system acquisition, there is little alternative to this procedure since there is no experience base for an aircraft that does not yet exist. For all aircraft under consideration in this study, the committee has a very substantial experience base from which to derive fuel burn rates (pounds or gallons per hour). These fuel burn rates are the average over a mix of mission profiles actually experienced. The committee followed the general principle that these average fuel burn rates represent the best information available absent compelling evidence to the contrary. Assuming that the mix of mission profiles in future will remain the same as the mix already experienced, a very good estimator of fuel
TABLE 5-3 Formulas for Estimating Fuel Consumption and Repair Costs for a Single Aircraft
|
Cost Element |
Parametric Estimating Relationship |
|
Fuel consumption (gal/aircraft-yr) |
Fuel consumption = Fuel consumptionCurrent * TSFCNew/TSFCCurrent |
|
Repair cost ($/aircraft-yr) |
Repair cost = 1188070710 * flying hours ^0.7013 * max power ^0.7975 * removal rate ^0.4421 * e^(MQT date * −0.0103) |
consumption rates for re-engined/modified-engine aircraft is obtained from the ratio of current to the re-engined installed thrust-specific fuel consumption (TSFC) taken at cruise condition.3
Engine Repair Cost
The RAND CER for engine repair is based on cost and usage data from the AFTOC database from FY98 to FY04. The relationship predicts engine-related O&S costs per aircraft MDS fleet per year in the four O&S cost elements described in the preceding section. These costs are measured in FY04 dollars. Inputs, or independent variables, in the relationship are maximum thrust per aircraft, the year of military qualification test (MQT) for the engine, the mean time between removals (or engine time on wing4), and whether the aircraft and engine are flown by Air Force Reserve components or the active Air Force. Thrust and MQT year data were obtained from The Engine Handbook (U.S. Air Force, 2005). Removal information was obtained from the Air Force’s Comprehensive Engine Management System (CEMS) database. The estimates used in the analysis were based on this relationship with the exception of the C-130 and KC-10 estimates which were drawn from contractor briefings. Table 5-3 shows the estimating relationships.5
ASSUMPTIONS, INPUTS, AND DATA
This section presents the assumptions used in the analysis, the technical and fleet information needed in the estimating relationships, and the sources of those data. The ground rules and assumptions used in the NPV analysis are these: (1) all costs are in or are adjusted to millions of FY06 dollars using a 3 percent deflator; (2) a nominal discount rate of 5.2 percent is used based on Office of Management and Budget recommendations; (3) a fuel cost of $2.50 per gallon was assumed, and the committee performed sensitivities using 3, 6, and 9 percent fuel cost escalation rates to demonstrate the influence of potentially rising fuel costs.6 Maintenance costs were assumed to grow at 3 percent per year.
TABLE 5-4 Assumptions for Fuel Savings
|
Candidate Aircraft/Engine Configuration |
|
|
Re-engining |
|
|
B-1/F119/5.0 |
10.0 |
|
E-3/CFM56-2B-1 |
11.8 |
|
E-3/JT8D-219 |
6.2 |
|
E-3/CFM56-7B22 |
19.1 |
|
E-8/CFM56-2B-1c |
– |
|
E-8/JT8D-219c |
– |
|
E-8/CFM56-7B22c |
– |
|
KC-135D/E/CFM56-2B-1 |
15.8 |
|
KC-135D/E/JT8D-219 |
10.4 |
|
KC-135D/E/CFM56-7B22 |
22.7 |
|
B-52/F117-PW-100 [4] |
24.7 |
|
B-52/CF34-10A [8] |
15.9 |
|
B-52/CFM56-5C2 [4] |
26.6 |
|
C-5/CF6-80C2 (F103-GE-102)d |
– |
|
Engine modification |
|
|
KC-135 R/T/CFM56-A2 |
2.1 |
|
B-1/F101 Mod |
10.0 |
|
KC-10/CF6-50 Mod |
0.3 |
|
aValues corrected after release of the January 31, 2007, prepublication version of the report. bValues listed are based on estimates obtained from contractors. cE-8 re-engining already ongoing. dC-5 re-engining already ongoing. SOURCE: Committee generated. |
|
Improvements in fuel efficiency are accounted for by the change in TSFC, installed where available (see Table 5-4). In the table, the fuel burn improvement is calculated as the TSFC of the current engine configuration less the TSFC of the candidate. A positive improvement figure indicates that the re-engined or modified aircraft/engine configuration candidate is more fuel efficient than the current configuration. A negative improvement figure indicates that the re-engined or modified candidate engine is less fuel efficient.7
Table 5-5 lists the data used as inputs to the estimating relationships for recurring and nonrecurring costs, fuel costs, and repair costs. Table 5-6 shows where the committee obtained the information it used for the NPV analysis.8 While the committee tried hard to draw information from public sources such as
TABLE 5-5 Inputs to CERs
|
Re-engining: Current Configurations and Candidates |
Number of Engines |
SFC at Maximum Power lb/lb-hr |
Ratio Maximum TOW toWE |
After-burning? (1 = yes; 0 = no) |
Maximum Power per Engine (lb thrust) |
Mean Shop Visit Rate (Removals/1,000 Hours) |
Engine Military Qualification Date |
Engine Dry Weight (lb) |
Rotor Inlet Temperature (F°) |
|
B-1/F101-GE-102a |
4 |
2.460 |
2.62 |
1 |
30,000 |
4.410 |
1983 |
4,428 |
2550 |
|
B-1/F119/5.0 |
4 |
2.214 |
2.62 |
1 |
37,000 |
4.410d |
2001 |
4,150 |
3092 |
|
E-3/TF33-PW-100Aa |
4 |
0.560 |
2.04 |
0 |
21,000 |
0.610 |
1974 |
4,790 |
1750 |
|
E-3/CFM56-2B-1 |
4 |
0.363 |
2.04 |
0 |
21.634 |
0.093 |
1982 |
4,610 |
2228 |
|
E-3/JT8D-219 |
4 |
0.454 |
2.04 |
0 |
21,000 |
0.151d |
1985 |
4,612 |
2420 |
|
E-3/CFM56-7 |
4 |
0.360d |
2.04 |
0 |
22,700 |
0.050d |
1996 |
5,234 |
2228 |
|
4 |
0.535 |
1.94 |
0 |
18,000 |
0.970 |
1963 |
4,260 |
1600 |
|
|
E-8/CFM56-2B-1b |
4 |
– |
– |
– |
– |
– |
– |
– |
– |
|
E-8/JT8D-219b |
4 |
– |
– |
– |
– |
– |
– |
– |
– |
|
E-8/CFM56-7b |
4 |
– |
– |
– |
– |
– |
– |
– |
– |
|
KC-135D/E/TF33-PW-102a |
4 |
0.535 |
2.65 |
0 |
18,000 |
0.700 |
1982 |
4,260 |
1600 |
|
KC-135D/E/CFM56-2B-1 |
4 |
0.363 |
2.65 |
0 |
21,634 |
0.093 |
1982 |
4,610 |
2228 |
|
KC-135D/E/JT8D-219 |
4 |
0.454 |
2.65 |
0 |
21,000 |
0.151 |
1985 |
4,612 |
2420 |
|
KC-135D/E/CFM56-7 |
4 |
0.360d |
2.65 |
0 |
22,700 |
0.050d |
1996 |
5,234 |
2228 |
|
B-52/TF33-P-103a |
8 |
0.520 |
2.87 |
0 |
17,000 |
0.970 |
1960 |
3,905 |
1600 |
|
B-52/F117-PW-100 |
4 |
0.347 |
2.87 |
0 |
40,440 |
0.194d |
1987 |
7,122 |
2400 |
|
B-52/CF34-10A |
8 |
0.370 |
2.87 |
0 |
18,500 |
0.080 |
2006 |
3,700 |
2200 |
|
B-52/CFM56-5C2 |
4 |
0.320 |
2.87 |
0 |
31,000 |
0.100 |
1991 |
5,670 |
2400 |
|
C-5/TF39-GE-1Ca |
4 |
0.315 |
2.14 |
0 |
40,805 |
0.700 |
1969 |
7,186 |
2350 |
|
C-5/CF6-80C2c |
4 |
|
|
|
|
|
|
|
|
|
KC-135 R/T/CFM56-2B-1a |
4 |
0.3630 |
2.65 |
0 |
21,634 |
0.092 |
1982 |
4,610 |
2228 |
|
KC-135 R/T/CFM56-2B-1 (Mod) |
4 |
0.3557 |
2.65 |
0 |
21,634 |
0.069 |
1982 |
||
|
B-1/F101 F-101-GE-102a |
4 |
0.5750 |
2.62 |
1 |
30,000 |
2.760 |
1985 |
4,448 |
2550 |
|
B-1/F101 Mod |
4 |
0.5175 |
2.62 |
1 |
30,000 |
1.290 |
2012 |
||
|
KC-10/CF6-50a |
3 |
0.3990 |
2.45 |
0 |
51,711 |
0.750 |
1972 |
8,731 |
2490 |
|
KC-10/CF6-50 Mod |
3 |
0.3977 |
2.45 |
0 |
|
|
|
|
|
|
NOTE: The C-130 information as well as the information in the shaded cells was not needed for the CERs since the fuel and maintenance savings as well as the nonrecurring and the recurring costs were already provided in the discussion in this report. TOW, takeoff weight;WE, weight empty. aCurrent engine configuration. bE-8 re-engining already ongoing. cC-5 re-engining already ongoing. dValues corrected after release of the January 31, 2007, prepublication version of the report. |
|||||||||
TABLE 5-6 Sources of Data
|
|
Maintenance Cost CERs |
Production and Development Cost CERs |
|||
|
Re-engining Candidate |
Total Thrust |
Mean Shop Visit Rate |
Qualification Date |
Dry Engine Weight |
RIT (F°) |
|
B-1/F119/5.0 |
Contractor estimate |
Assumed no change |
Assumption |
Contractor estimate |
Analogy to similar system |
|
E-3/CFM56-2B-1 |
The Engine Handbook |
AFTOC |
CFM engine fact sheet |
Aviation Week |
The Engine Handbook |
|
E-3/JT8D-219 |
Contractor estimate |
Contractor estimate |
Jane’s Online |
Jane’s Online |
Analogy to similar system |
|
E-3/CFM56-7B22 |
Contractor estimate |
Contractor estimate |
CFM engine fact sheet |
Aviation Week |
Assumed same as 2B-1 |
|
E-8/CFM56-2B-1a |
— |
— |
— |
— |
— |
|
E-8/JT8D-219a |
— |
— |
— |
— |
— |
|
E-8/CFM56-7B22a |
— |
— |
— |
— |
— |
|
KC-135D/E/CFM56-2B-1 |
The Engine Handbook |
AFTOC |
CFM engine fact sheet |
Aviation Week |
The Engine Handbook |
|
KC-135D/E/JT8D-219 |
Contractor estimate |
Contractor estimate |
Jane’s Online |
Jane’s Online |
Analogy to similar system |
|
KC-135D/E/CFM56-7B22 |
Contractor estimate |
Contractor estimate |
CFM engine fact sheet |
Aviation Week |
Assumed same as 2B-1 |
|
B-52/F117-PW100 (4) |
The Engine Handbook |
Contractor estimate |
The Engine Handbook |
The Engine Handbook |
The Engine Handbook |
|
B-52/CF34-10A (8) |
Jane’s Online |
AFTOC |
GE engine fact sheet |
Aviation Week |
Analogy to similar system |
|
B-52/CFM56-5C2 (4) |
Aviation Week |
Assumption |
CFM engine fact sheet |
Aviation Week |
Assumed same as F117 |
|
C-5/CF6-80C2 (F103-GE-102)b |
— |
— |
— |
— |
— |
|
KC-135R/T/CFM56-A2 |
Contractor estimate |
Contractor estimate |
Contractor estimate |
||
|
B-1/F101 Mod |
Contractor estimate |
Contractor estimate |
Contractor estimate |
||
|
KC-10/CF6-50 Mod |
Contractor estimate |
||||
|
NOTE: Shaded cells indicate data not used in analysis. RIT, rotor inlet temperature. aE-8 re-engining already in progress. bC-5 re-engining already in progress. |
|||||
Air Force fact sheets,9 CFM fact sheets,10 and GE Engine fact sheets,11 only a few accurate pieces of information could be so obtained. Information had to be acquired from limited secure-access databases:
|
9 |
These public documents, available at http://www.af.mil/factsheets/, contain information on many variables about aircraft currently in the Air Force inventory. Total operating weight and weight empty were taken from these sheets. |
|
10 |
CFM International is the consortium that produces CFM engines. Public data and history can be found on its Web site: http://www.cfm56.com/engines/. |
|
11 |
GE fact sheets are available at http://www.geae.com/engines/. |
AFTOC,12 Jane’s and Jane’s Online, Aviation Week,13 contractor presentations to the committee, and finally, proprietary datasets. When no information was available for a given system, as was often the case for rotor inlet temperature, data for an analogous system were substituted.
NET PRESENT VALUE ANALYSIS
The partial NPV model calculates the costs and benefits of modifying or replacing an engine for an entire fleet of aircraft, with the costs being the nonrecurring and recurring costs for development, installation, and testing of the new engine and the benefits being the savings due to lower fuel consumption and less maintenance. These costs and benefits are calculated annually, permitting the construction of a cumulative discounted cash flow profile. Nonrecurring costs are apportioned over the first few years of the re-engining,14 and recurring costs are allocated to the time when the aircraft is converted. Fuel and maintenance savings are calculated annually and persist until the fleet is retired.15 The model assumes that the current fleet of aircraft will continue to run at the current rate for annual engine hours until estimated retirement dates.16
Figure 5-1 demonstrates the mechanics of the model for a B-1 re-engining with a F101 modification. The three solid lines indicate cumulative discounted cash flows—assuming a different discounting factor for the fuel costs—summing in present value as years progress (from left to right). In the first 7 years, nonrecurring and recurring investments are being made, and the net cash flow is negative. But as aircraft are converted to a new engine, positive savings in fuel costs and maintenance are seen immediately thereafter. The dashed line represents the fleet size. As the figure shows, starting around year 25, the fleet gradually retires from service, and the net benefits no longer accumulate after year 32, by which time the entire fleet has been retired. It should again be noted that the analysis makes no attempt to assess the financial benefits associated with the resale value of low-hour engines following the retirement of re-engined airframes.
Next, the committee collects the summary results of the NPVs for all candidates and displays them in tabular form. The summary tables include two sets of data:
-
The number of years to break even on the investment (for the B-1 engine modification illustrated in Figure 5-1, these are 8.0 years, 7.7 years, and 7.4 years for 3 percent, 6 percent, and 9 percent fuel escalation, respectively, as shown by the points at which the curves cross the horizontal axis.)
-
The cumulative cash flow at the 20-year point, in this case $470* million, $610* million, and $815* million for 3 percent, 6 percent, and 9 percent fuel escalation.17 (To ensure consistency for purposes of interpretation, the results in Tables 5-7 and 5-8 are based on no retirements before breakeven or the 20-year point, whichever is greater, even if earlier retirement is expected.)
|
12 |
AFTOC, the Air Force Total Ownership Cost management information system, contains financial and logistic data on the current fleet of Air Force aircraft. A user account is required for access to the system, which is restricted to cleared personnel only. See more at https://aftoc.hill.af.mil/. Data on flying hours and mean time between services were taken from AFTOC. |
|
13 |
All references to Aviation Week are to the article “Outlook/specifications: Gas turbine engines,” in Aviation Week and Space Technology, January 17, 2005, pp. 122-134. |
|
14 |
The apportionment is 40 percent in the first year, 40 percent in the second year, and 20 percent in the third year. Different spend-out patterns were tried, with insignificant impacts on overall NPV. |
|
15 |
Fuel usage and maintenance requirements are determined from two estimating relationships: the first estimates the number of gallons of fuel burned and the second estimates annual maintenance costs. |
|
16 |
However, the model does not take into account the reconstitution of the fleet with a set of future aircraft after the current fleet retires. |
|
17 |
Asterisks denote values corrected after release of the January 31, 2007, prepublication version of the report. |
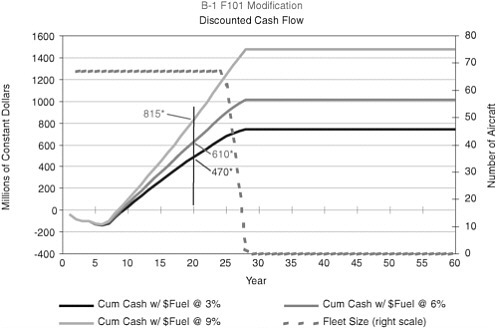
FIGURE 5-1 B-1/F101 modification cash flow analysis. *Values corrected after release of the January 31, 2007, prepublication version of the report.
Table 5-7 displays the result of the NPV calculation for all the re-engining alternatives. It lists the fleet size, the annual flight hours, changes in thrust (if applicable), annual fuel consumption of the original fleet, fuel savings as a percentage and in millions of gallons of fuel saved per year for the re-engined fleet; estimated savings on maintenance cost as a percentage and in millions of dollars per year; the production costs for each engine replaced; and the total development cost. The next three columns list the number of years to recoup the investment if fuel costs increase uniformly at 3 percent, 6 percent, and 9 percent per year. The last three columns show the cash flows estimated at the 20-year point for the same set of fuel cost increases. The cells of the table that recoup investment costs in less than 20 years and therefore have positive cash flow at the 20-year point are all shaded. If the criterion for a good business case is to recoup the investment in 20 years18 or less and if fuel costs are expected to rise at 3 percent per year and the discount and inflation rates are expected to be as discussed previously, then the C-130H/AE2100, C-130H/PW150, E-3/CFM56-7B22, and B-52/CFM56-5C2[4] options meet the criterion. If, on the other hand, fuel costs are expected to rise faster, then more re-engining candidates will meet the criterion, as indicated by the shaded cells of the table for the higher rates (6 percent and
9 percent) of fuel cost increases. Finally, if the criterion is to recoup investment in some number of years different from 20, the appropriate columns of the table can be used to determine whether the criterion will be met. (All the above assume of course, that the aircraft will not be retired before the criterion is met.) Table 5-8 displays the results for all the potential engine modification alternatives in the same format and is interpreted the same way. It is generally easier to make a business case for engine modifications than for complete re-engining when such modifications improve efficiency or reliability, because the costs are generally comparatively low. At a fuel cost increase of 3 percent per year, the C-130H/T56-A427, B-1/F101, and KC-10/CF6-50 modifications meet the 20-year-payback criterion. With higher rates for fuel cost increases, the C-130H/T56-S3.5 modification comes into play, as can be seen from the shaded cells. The KC-10 savings are due almost exclusively to lower maintenance costs and to the absence of development costs.
In addition, for those who believe that a burdened fuel cost should be used, Table 5-9 shows the results of a sensitivity analysis run assuming various burdened rates of fuel. The figure shown is the number of years until payback for each candidate, under the specified total burdened cost of fuel—$2.50, $5, $10, $20, or $40 (see Appendix G for a sensitivity analysis). The total cost is assumed to have two components: (1) a raw fuel cost that starts at $2.50 a gallon and increases at 6 percent annually and (2) the remainder, an overhead component increasing at 3 percent per year.19 Care must be taken in interpreting these results since to realize the savings implied by the estimates generally implies a significant change to the infrastructure or to some other element of the burdened cost, and it is often difficult to imagine how this might come about absent significant changes in force structure, basing, and/or operating practices. As can be seen from the shading on the chart, if one believes strongly enough in high burdened fuel costs, a strong business case can be made for almost any proposal.
Finally, it should be remembered that the analysis does not consider the resale value or the recovery value of the engines following retirement of the re-engined airframes.
SUMMARY
The committee considers the analysis results presented in this chapter to be indicative of trends and directions rather than definitive answers and the results cannot and should not be used to differentiate between specific engines on an airframe. Despite the presentation of the committee’s analysis results (“years required to recoup investment” and “cash flow at 20-year point”) in the tables as precise numbers resulting from the committee’s calculations, it is imperative they be viewed and used as approximate estimates, each surrounded by some amount of uncertainty. Before making actual re-engining decisions, the Air Force would have to do much more thorough and detailed analysis than that done by the committee. The Air Force analysis would require higher confidence estimates of input values—for example, for fuel burn improvement and recurring costs—and it would include considerations not dealt with by the committee’s analysis—for example, mission impacts.
The committee used its analysis to identify the aircraft for which there was a potential life cycle cost benefit to re-engining or engine modification. That is as far as the results presented in this chapter can be taken.
TABLE 5-7 NPV Analysis Results for Re-engininga
|
|
|
|
|
|
Fuel Savings |
|
|
Re-engining Candidate (Aircraft/Engine) |
Fleet Size |
Annual Flight Hours |
Change in Thrust (%) |
Annual Fuel Used (million gal) |
(%) |
(million gal/yr) |
|
C-130H/AE 2100c |
272 |
117,776 |
N/A |
169 |
28.0 |
47.3 |
|
C-130H/PW150c |
272 |
117,776 |
N/A |
169 |
25.0 |
42.3 |
|
B-1/F119/5.0 |
67 |
17,745 |
23 |
82 |
10.0 |
8.2 |
|
E-3/CFM56-2B-1 |
32 |
17,184 |
3 |
34 |
11.8 |
4.0 |
|
E-3/JT8D-219 |
32 |
17,184 |
0 |
34 |
6.2 |
2.1 |
|
E-3/CFM56-7B22 |
32 |
17,184 |
8 |
34 |
19.1 |
6.5 |
|
E-8/CFM56-2B-1d |
19 |
8,704 |
– |
– |
– |
– |
|
E-8/JT8D-219d |
19 |
8,704 |
– |
– |
– |
– |
|
E-8/CFM56-7B22d |
19 |
8,704 |
– |
– |
– |
– |
|
KC-135D/E/CFM56-2B-1 |
115 |
35,190 |
20 |
45 |
15.8 |
7.1 |
|
KC-135D/E/JT8D-219 |
115 |
35,190 |
17 |
45 |
10.4 |
4.7 |
|
KC-135D/E/CFM56-7B22 |
115 |
35,190 |
26 |
45 |
22.7 |
10.2 |
|
B-52/F117-PW-100 [4] |
76 |
24,016 |
19 |
71 |
24.7 |
17.5 |
|
B-52/CF34-10A [8] |
76 |
24,016 |
9 |
71 |
15.9 |
11.3 |
|
B-52/CFM56-5C2 [4] |
76 |
24,016 |
−9 |
71 |
26.6 |
18.9 |
|
C-5/CF6-80C2 (F103-GE-102)e |
111 |
40,737 |
– |
– |
– |
– |
|
NOTE: The engine cost estimates presented are derived from correlations developed for historical military engines and may not reflect the current fair market prices of commercial engines considered in this study. Engine cost estimates vary widely, and the estimates presented may vary by as much as 100 percent from estimates developed by other independent sources such as the Avitas BlueBook of Jet Engine Values 2007 or the IBA Engine Value Book 2005. aValues corrected after release of the January 31, 2007, prepublication version of the report. bShading indicates a recouping of investment costs in less than 20 years and thus a positive cash flow at the 20-year point. |
||||||
TABLE 5-8 NPV Analysis Results for Engine Modificationa
|
|
|
|
|
|
Fuel Savings |
|
|
Engine Modification Candidate |
Fleet Size |
Annual Flight Hours |
Change in Thrust (%) |
Annual Fuel Used (million gal) |
(%) |
(million gal/yr) |
|
KC-135 R/T/CFM56-2B-1 (Mod) |
420 |
147,495 |
0 |
359 |
2.1 |
7.6 |
|
C-130H/T56-A427 Modc |
272 |
132,262 |
N/A |
189 |
13.0 |
24.6 |
|
C-130H/T56-S3.5 Modc |
272 |
132,262 |
N/A |
189 |
8.0 |
15.1 |
|
B-1/F101 Mod |
67 |
23,356 |
0 |
109 |
10.0 |
10.9 |
|
KC-10/CF6-50 Mod |
59 |
51,237 |
0 |
177 |
0.3 |
0.5 |
|
NOTE: The engine cost estimates presented are derived from correlations developed for historical military engines and may not reflect the current fair market prices of commercial engines considered in this study. Engine cost estimates vary widely, and the estimates presented may vary by as much as 100 percent from estimates developed by other independent sources such as the Avitas BlueBook of Jet Engine Values 2007 or the IBA Engine Value Book 2005. aValues corrected after release of the January 31, 2007, prepublication version of the report. |
||||||
|
Estimated Savings on Fleet Maintenance Cost |
Cost (million 2006 $) |
Years to Recoupb with Fuel Cost Annual Increase of |
Cash Flow at 20-yr Point (million $)b with Annual Fuel Cost Increase of |
||||||
|
(%) |
(million $/yr) |
Production of One Engine |
Total Development |
3% |
6% |
9% |
3% |
6% |
9% |
|
50 |
14.1 |
1.3 |
45 |
17.7 |
14.4 |
12.4 |
203 |
817 |
1,715 |
|
50 |
14.1 |
1.2 |
95 |
19.5 |
15.5 |
13.2 |
37 |
585 |
1,387 |
|
11 |
7.5 |
5.2 |
26 |
>60 |
51.1 |
33.5 |
−1,029 |
−992 |
−776 |
|
59 |
13.9 |
2.3 |
52 |
22.2 |
19.0 |
16.6 |
−34 |
20 |
98 |
|
52 |
12.2 |
2.6 |
59 |
36.3 |
29.4 |
24.5 |
−157 |
−128 |
−87 |
|
72 |
17.0 |
2.4 |
53 |
16.5 |
14.5 |
13.0 |
78 |
165 |
291 |
|
– |
– |
– |
– |
– |
– |
– |
– |
– |
– |
|
– |
– |
– |
– |
– |
– |
– |
– |
– |
– |
|
– |
– |
– |
– |
– |
– |
– |
– |
– |
– |
|
53 |
24.4 |
2.2 |
52 |
45.1 |
32.3 |
25.4 |
−532 |
−438 |
−301 |
|
44 |
20.5 |
2.4 |
59 |
>60 |
47.9 |
34.3 |
−769 |
−707 |
−616 |
|
68 |
31.3 |
2.3 |
53 |
31.6 |
24.9 |
20.6 |
−378 |
−243 |
−46 |
|
45 |
25.6 |
2.8 |
81 |
20.6 |
17.0 |
14.6 |
−27 |
206 |
545 |
|
78 |
43.8 |
2.0 |
48 |
28.4 |
23.5 |
19.9 |
−361 |
−211 |
7 |
|
68 |
38.5 |
2.6 |
90 |
16.1 |
14.1 |
12.6 |
224 |
475 |
841 |
|
– |
– |
– |
– |
– |
– |
– |
– |
– |
– |
|
cThe fuel savings noted for the C-130 with new or modified engines are based on the aircraft being flown at the optimal altitude and airspeed for the selected engines and propellers. The flexibility exists in most C-130 missions for the aircraft to be operated at the best range or fuel consumption conditions. The other aircraft and engines considered in the study are operated at their prescribed mission conditions. dE-8 re-engining already in progress. eC-5 re-engining already in progress |
|||||||||
|
Estimated Savings on Fleet Maintenance Cost |
Cost (million 2006 $) |
Years to Recoupb with Fuel Cost Annual Increase of |
Cash Flow at 20-yr Point (million $)b with Annual Fuel Cost Increase of |
||||||
|
(%) |
(million $/yr) |
Production of One Engine |
Total Development |
3% |
6% |
9% |
3% |
6% |
9% |
|
12 |
14 |
1.0 |
15 |
>60 |
56.6 |
36.6 |
−1,318 |
−1,213 |
−1,060 |
|
40 |
11 |
0.7 |
60 |
17.8 |
14.6 |
12.6 |
107 |
431 |
905 |
|
40 |
11 |
0.7 |
60 |
26.1 |
19.7 |
16.3 |
−184 |
15 |
307 |
|
46 |
26 |
0.5 |
9 |
8.0 |
7.7 |
7.4 |
470 |
610 |
815 |
|
15 |
25 |
0.2 |
0 |
3.8 |
3.8 |
3.8 |
325 |
333 |
343 |
|
bShading indicates a recouping of investment costs in less than 20 years and thus a positive cash flow at the 20-year point. cThe fuel savings noted for the C-130 with new or modified engines are based on the aircraft being flown at the optimal altitude and airspeed for the selected engines and propellers. The flexibility exists in most C-130 missions for the aircraft to be operated at the best range or fuel consumption conditions. The other aircraft and engines considered in the study are operated at their prescribed mission conditions. |
|||||||||
TABLE 5-9 Sensitivity of Years to Recoup Investment to Total Burdened Fuel Costa
|
Candidate Aircraft/Engine Configuration |
Years to Recoup Investment with Total Burdened Fuel Cost of |
||||
|
$2.50/Galb |
$5/Galb |
$10/Galb |
$20/Galb |
$40/Galb |
|
|
Re-engining |
|||||
|
C-130H/AE 2100c |
17.7 |
10.9 |
7.3 |
4.2 |
2.5 |
|
C-130H/PW150c |
19.5 |
11.7 |
7.9 |
4.8 |
3.1 |
|
B-1/F119/5.0 |
>60 |
55.7 |
24.4 |
12.9 |
7.8 |
|
E-3/CFM56-2B-1 |
22.2 |
15.7 |
10.5 |
7.2 |
5.2 |
|
E-3/JT8D-219 |
36.3 |
26.2 |
17.5 |
11.3 |
7.5 |
|
E-3/CFM56-7B22 |
16.5 |
11.6 |
8.0 |
5.7 |
4.0 |
|
E-8/CFM56-2B-1d |
– |
– |
– |
– |
– |
|
E-8/JT8D-219d |
– |
– |
– |
– |
– |
|
E-8/CFM56-7B22d |
– |
– |
– |
– |
– |
|
KC-135D/E/CFM56-2B-1 |
45.1 |
28.6 |
17.6 |
11.0 |
7.4 |
|
KC-135D/E/JT8D-219 |
>60 |
48.9 |
27.8 |
16.3 |
10.0 |
|
KC-135D/E/CFM56-7B22 |
31.6 |
20.9 |
13.5 |
8.8 |
6.2 |
|
B-52/F117-PW-100 [4] |
20.6 |
13.2 |
8.7 |
6.1 |
3.9 |
|
B-52/CF34-10A [8] |
28.4 |
20.0 |
13.3 |
8.9 |
6.3 |
|
B-52/CFM56-5C2 [4] |
16.1 |
11.2 |
7.8 |
5.6 |
3.6 |
|
C-5/CF6-80C2 (F103-GE-102)e |
– |
– |
– |
– |
– |
|
Engine modification |
|||||
|
KC-135 R/T/CFM56-2B-1 Mod |
>60 |
>60 |
30.0 |
15.9 |
9.5 |
|
C-130H/T56-A427 Modc |
17.8 |
11.1 |
7.6 |
4.6 |
3.1 |
|
C-130H/T56-S3.5 Modc |
26.1 |
15.3 |
9.9 |
6.6 |
4.1 |
|
B-1/F101 Mod |
8.0 |
6.9 |
5.4 |
4.3 |
4.1 |
|
KC-10/CF6-50 Mod |
3.8 |
3.6 |
3.3 |
3.0 |
3.0 |
|
NOTE: The engine cost estimates presented are derived from correlations developed for historical military engines and may not reflect the current fair market prices of commercial engines considered in this study. Engine cost estimates vary widely, and the estimates presented may vary by as much as 100 percent from estimates developed by other independent sources such as the Avitas BlueBook of Jet Engine Values 2007 or the IBA Engine Value Book 2005. aValues corrected after release of the January 31, 2007, prepublication version of the report. bShading indicates a recouping of investment costs in less than 20 years and thus a positive cash flow at the 20-year point. cThe fuel savings noted for the C-130 with new or modified engines are based on the aircraft being flown at the optimal altitude and airspeed for the selected engines and propellers. The flexibility exists in most C-130 missions for the aircraft to be operated at the best range or fuel consumption conditions. The other aircraft and engines considered in the study are operated at their prescribed mission conditions. dE-8 re-engining already in progress. eC-5 re-engining already in progress |
|||||
REFERENCES
AW&ST (Aviation Week and Space Technology). 2005. “Outlook/specifications: Gas turbine engines.” January 17. 162(3): 122-134.
Fox, Bernard, Michael Boito, John Graser, and Obaid Younossi. 2004. Test and Evaluation Trends and Costs for Aircraft and Guided Weapons. Santa Monica, Calif.: RAND Project Air Force. Available online at http://www.rand.org/pubs/monographs/2004/RAND_MG109.pdf. Last accessed on January 18, 2006.
Jane’s Aero-Engines. Jawa.janes.com. Updated February 20, 2006. Accessed July-September 2006.
U.S. Air Force. 2005. The Engine Handbook. Oklahoma City, Okla.: Air Logistics Center. December.
Younossi, Obaid, Mark Arena, Richard Moore, Mark Lorell, Joanna Mason, and John Graser. 2002. Military Jet Engine Acquisition: Technology Basics and Cost-Estimating Methodology. Santa Monica, Calif.: RAND Project Air Force. Available online at http://www.rand.org/pubs/monograph_reports/2005/MR1596.pdf. Last accessed on January 18, 2006.


