
4
Key Factors Influencing Leadership
In this report, leadership in chemistry has been measured by such factors as the number and quality of journal articles and the composition of virtual congresses that panel members asked distinguished chemists to organize. This leadership is influenced by a multitude of factors, some of which are the result of national policy, economics, and available resources of each country in the world. The panel focused on five key factors that influence U.S. leadership in chemistry research:
-
National imperatives: Policy decisions in response to external challenges that have influenced leadership in chemistry.
-
Innovation: Investment and technology development mechanisms that facilitate the transition from fundamental discovery to technological applications.
-
Scientific culture: Underlying behaviors and ways of conducting research that foster leadership in chemistry.
-
Major facilities, centers, and instrumentation: The physical infrastructure and materiel for conducting chemistry research.
-
Human resources: The national capacity of chemistry graduate students and degree holders.
-
Funding: Financial support for conducting chemistry research.
NATIONAL IMPERATIVES
Challenges from other countries have always been driven by U.S. investment in research. The Soviet Union was viewed as a major challenger
prior to its disintegration. Japan emerged as a potent competitor in the 1970s and continues to increase its prominence. Western Europe has always been a major scientific force, and the recent strengthening of science throughout the European Union has increased competition in the past decade. Most recently, there has been very strong growth of science in China and India. A recent article in Science reported that China is heavily funding a few strategic scientific areas, including proteomics and nanotechnology. The United States has recognized that the scientific world is becoming a flatter playing field and that this country will have to increase its efforts to remain competitive.
Industrial competitiveness relies on leadership in science. Increasingly, start-up companies exploit scientific discoveries made at universities with federal support. Technology transfer from universities to industry has been facilitated by the Bayh-Dole Act. New companies are continually being started to exploit innovations from biotechnology and nanoscience; chemists are often crucial players in these discoveries and new ventures. President Bush’s “American Competitiveness Initiative” proposal, which calls for a large increase in support for research in the physical sciences and for science and math education, could have a major impact on the health of chemistry research in the United States.
National Research Council (NRC) reports on the status of chemistry have been important in setting the direction of chemistry in the United States. The 1965 Westheimer report Chemistry: Opportunities and Needs, the 1985 Pimentel report Opportunities in Chemistry, and the 2003 Breslow-Tirrell report Beyond the Molecular Frontier: Challenges for Chemistry and Chemical Engineering have all highlighted opportunities in chemistry and helped explain the need for research in the chemical sciences. The 2007 NRC report Rising Above the Gathering Storm: Energizing and Employing America for a Brighter Economic Future explains the national imperative for investment in science.
INNOVATION
The process by which research ideas are developed and funded in the United States—our “innovation system,” is another key factor influencing U.S. leadership in chemistry, improving how rapidly and easily ideas can be tested, developed, and extended. The factors that influence the process are discussed below.
A Strong U.S. Industrial Sector
Leadership in chemistry research in the United States over the years has been strongly linked with the development of the U.S. chemical industry.
According to Landau and Arora, “The rise of the research university in science and engineering (S&E) gave a strong boost to the American chemical industry,”1 particularly in the early part of the twentieth century. And this relationship has been a vital part of the success of the United States as a nation. Landau and Arora further point out that the U.S. chemical industry: (1) “was the first science-based, high-technology industry”; (2) “has generated technological innovations for other industries, such as automobiles, rubber, textiles …”; and (3) “is a U.S. success story.”
At the same time, the U.S. chemical manufacturing industry is not what it used to be. Once a major net exporter, the U.S. chemical industry is now essentially a net importer (trade went negative in 2000-2001).2 Some think that today the U.S. chemical industry is, in fact, fundamentally disadvantaged relative to the rest of the world because of its dependence on oil and natural gas for raw materials, which have become less abundant and much more costly. The cost of natural gas in the United States is now 2 to 10 times higher than anywhere else in the world. The high cost of raw materials and labor in the United States. provides an incentive for investments in new plants and even new research centers outside the United States.3
A Variety of Funding Opportunities
The funding of our innovation system is characterized by many options, from industry to government to private foundations. This variety of sources, with different emphases, creates a spectrum of opportunities—and the direction of research is never dictated solely by any one funding source.
Industry
U.S. industry is the largest overall supporter of chemical R&D. Between 1999 and 2003, about $20 billion a year was spent on basic chemicals, resin, synthetic rubber, fibers, and filaments, pharmaceuticals and medicines related R&D.4 Individual companies often operate their own R&D labs, and many provide funds for academic research in targeted areas related to their areas of interest. Industrial funding for research and development in academic science and engineering (S&E) fields reached an all-time high of
$2.3 billion in FY 2005.5 Technology transfer from universities to industry has become increasingly important for the U.S. innovation system. The Bayh-Dole Act has enabled the patenting of government-funded university research and the licensing of the patents to industry. Innovative research by university faculty now increasingly leads to the formation of small start-up companies to exploit discoveries first made with the help of government funding.
Government
U.S. chemists have many options for obtaining government funding, which helps stimulate innovative research. The major sources for government funding of chemistry are the National Institutes of Health (NIH), National Science Foundation (NSF), Department of Energy (DOE), and Department of Defense (DOD). In addition, the National Oceanic and Atmospheric Administration, National Aeronautics and Space Administration (NASA), United States Department of Agriculture (USDA), National Institutes of Standards and Technology (NIST), Environmental Protection Agency, and the new Department of Homeland Security are important sources of funding for chemists. Actual research funding levels are discussed later in this chapter.
The wide variety of sources, with different emphases, creates a spectrum of opportunities. The NSF CAREER program and the NIH Beginning Investigator programs are designed to help assistant professors at the start of their independent research careers. The peer review process that underlies research funding and the extensive networking associated with advisory boards contribute to the high quality of federally funded research.
State Initiatives
There have been a growing number of state initiatives to foster innovation and stimulate economic growth. One successful example is the Ben Franklin Technology Partners (http://www.benfranklin.org/), which is a statewide network in Pennsylvania that operates four regional centers located throughout the state.
Universities
Many universities are now increasing research support through centers that provide community outreach. In some cases this support comes from
multiple universities and sometimes involves partnerships with industry. One example is the University of California Discovery Grants in biotechnology to promote industry-university research partnerships. Biotechnology is one of five fields supported by Discovery Grants (i.e., biotechnology, communications and networking, digital media, electronics manufacturing and new materials, and life sciences information technology). These grants enhance the competitiveness of California businesses and the California economy by advancing innovation, R&D, and manufacturing, and by attracting new investments.
Private Foundations
Private foundation funding of U.S. chemical research also plays an important role, particularly for initiation of new projects and for helping beginning investigators achieve a rapid start in their careers. The American Chemical Society’s Petroleum Research Fund has been an important source of funds both for beginning investigators and established investigators who want to expand to a new area. Private foundations, including Camille and Henry Dreyfus, John D. and Catherine T. MacArthur, David and Lucile Packard, Research Corporation, and Alfred P. Sloan, have set up special programs to help assistant professors establish innovative research programs. For those working at the interface of chemistry, biology, and medicine, support from private sources such as the American Cancer Society is important.
SCIENTIFIC CULTURE
The way in which chemistry research is carried out in the United States is influenced by underlying practices and procedures that have changed over time. Several key characteristics of the U.S. scientific culture underlie leadership in chemistry research.
Cross-Sector and International Collaborations
The movement of people and ideas among academic, industrial, government, and other laboratories is vital in the transfer of new concepts and technology. Some faculty members have industrial or government experience. They may serve as consultants to industry or participate in the formation of small start-up companies. These relationships provide researchers across sectors with a greater understanding of problems beyond their limits. Cross-sector collaborations provide a channel for the transfer of knowledge and new approaches such as those developed in academia with funding from the federal government.
Scientific collaboration across institutional boundaries in the United States is extensive and continues to grow. According to the Science and Engineering (S&E) Indicators 2004, the share of articles from multiple U.S. institutions increased from 48 percent in 1988 to 62 percent in 2001. Cross-sector collaboration on papers in chemistry also grew significantly from 30 percent in 1988 to 50 percent in 2001. The overall level of collaboration is lower than for other disciplines such as, biomedical research, earth and space sciences, and physics (see Figure 4-1).
The number of internationally coauthored S&E articles has also been growing. According to Science and Engineering Indicators 2004, 23 percent of all U.S. articles had at least one non-U.S. coauthor in 2001, compared with 10 percent in 1988 (see Figure 4-2). The percentage of U.S. chemistry articles with international coauthorship increased from 10 percent in 1988 to 22 percent in 2001. The level of international collaborations on articles in chemistry is lower than in physics and the earth and space sciences, which often require large international facilities.
Strong Professional Societies
With a membership of over 159,000, the American Chemical Society is by far the most important organization for U.S. chemists. The strength of the ACS publications gives U.S. chemists a competitive advantage over their foreign colleagues. The ACS facilitates communication between members through its national, regional, and local section meetings; through publication of over 35 world-class chemistry journals; and through its 33 technical specialty divisions, which provide an intellectual home for chemists with similar interests. Symposia at national ACS meetings focus attention on emerging areas of chemistry and bring chemists together to discuss current research and important developments. There is also a plethora of regional and national societies centered on specific scientific questions or specific scientific technologies that sometimes coordinate and cofund with local ACS sections. Regional examples include the Washington Carbohydrate Discussion Group and the Delaware Valley Chromatography Discussion Group. Other professional societies that are important for promoting communication and cooperation between U.S. chemists and other scientists and engineers include the Materials Research Society, the American Institute of Chemical Engineers, the NRC Chemical Sciences Roundtable, and the Council on Chemical Research.
The Gordon Research Conferences, started as a uniquely American enterprise 75 years ago, have been important in the development of U.S. chemistry. These small conferences (100 to150 participants) now take place outside the U.S., even in China, and provide an international forum for the presentation and discussion of frontier research in specialty areas
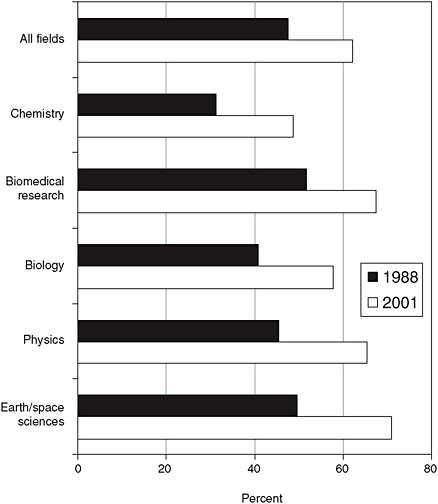
FIGURE 4-1 Extent of collaboration on U.S. S&E articles, by field, 1988 and 2001.
NOTE: Number of S&E articles with multiple institutional authors, including foreign institutions, as share of total S&E articles. Field volume is in terms of whole counts, where each collaborating institutional author is assigned an entire count.
SOURCE: National Science Foundation, NSF Science and Engineering Indicators 2004, Figure 5-37 (based on Appendix Tables 5-39 and 5-40).
of chemistry. The spirit of the conferences encourages open, critical, and sometimes contentious discussion of cutting edge and unpublished research. Prominent researchers and young investigators alike are challenged to support their ideas. In the process, many friendships, collegial relationships, and collaborations develop.
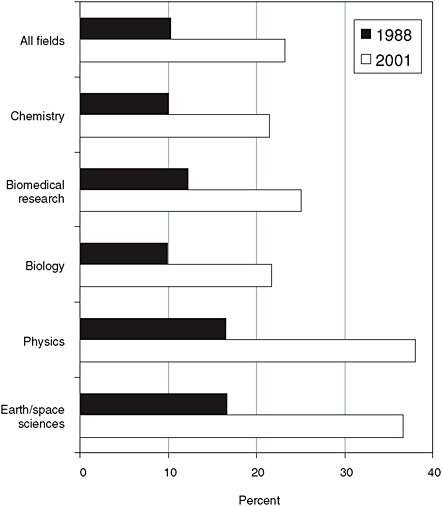
FIGURE 4-2 Extent of international collaboration on U.S. S&E articles, by field, 1988 and 2001.
NOTE: International collaboration is the number of U.S. articles with at least one non-U.S. coauthor as a share of the total number of U.S. articles. Field volume is in whole counts, where each institutional coauthor is assigned an entire count.
SOURCES: Institute for Scientific Information, Science Citation Index and Social Sciences Citation Index; CHI Research, Inc.; and National Science Foundation, Division of Science Resources Statistics, special tabulations. See Appendix Tables 5-39 and 5-40.
Fully Independent Investigators
Compared to most countries, U.S. academic chemists have longer fully independent academic careers; they start earlier and end later than chemists in Europe and Japan. U.S. academic chemists typically begin their fully
independent careers as assistant professors in their late 20s or early 30s. This is often a highly creative period of a scientist’s career, and this early independence is a strength of U.S. chemistry. At the other end of their careers, U.S. academic chemists do not face a mandatory retirement age, as their counterparts in Japan and Europe do. Consequently, senior U.S. chemists, sometimes at the height of their careers, can continue to be productive into their late 60s and beyond, while their counterparts must retire.
Mobility Across Academic Institutions
U.S. chemistry is characterized by a great deal of mobility. The typical U.S. academic chemist receives undergraduate, graduate, and postdoctoral training at three different institutions and then begins an independent career as an assistant professor at a fourth university. This movement of students and new faculty around the country rapidly spreads new ideas and modes of operation. There is less mobility in Japan and most large European countries and much less in smaller nations, where the number of research universities is limited.
CENTERS AND MAJOR FACILITIES
Excellent physical laboratory space is an important factor facilitating chemistry research, and in the U.S., laboratory space provided to chemical researchers is generally of good quality. In addition, chemistry research typically requires instrumentation, and at times, major instruments or facilities, that can only be economically provided by national facilities. In addition, because chemistry operates at the interface with many other disciplines, chemists require specialized facilities (hardware, software) used by these disciplines. Therefore, the health and competitiveness of chemistry research depend on the health and availability of cutting-edge facilities at U.S. universities and national labs. Government- and university-sponsored centers and facilities provide significant support for research activities in the United States. The Office of Basic Energy Sciences at DOE funds and operates many major facilities of relevance to chemists. Several of these are highlighted below: synchrotron radiation light sources, high-flux neutron sources, and nanoscale science research centers. There are also many NSF-funded centers and facilities, but these tend to be used more heavily at the local university level or with nearby universities. However, some of these centers do span multiple universities and provide an invaluable resource at the national level (some examples are included below). Important international facilities are included in the lists when information is available.
Some areas of chemistry often have great need for specialized facilities. For example, in macromolecular chemistry the physical characterization
of macromolecules requires access to specialized equipment for surface analysis, rheological analysis of flow properties, thermomechanical testing, tensile strength testing, electron microscopy, and scattering techniques. National centers of excellence including national laboratories (Sandia, Los Alamos, NIST) are essential to foster this interdisciplinary research field by providing access to specialized equipment for advanced studies. Modern analytical chemistry involves both the development of new instrumentation and the clever use of commercial instrumentation. Due to high costs, state-of-the-art commercial instrumentation has become less available in training labs and research universities. Some complex instrumental systems also require teams of professional scientists for optimal operation. Access to such equipment is often best made available by establishing centers, which then require special funding mechanisms for continued operation. The types of facilities of interest to chemistry research fall into the following broad categories:
-
Light sources
-
Scanning probe techniques
-
Nuclear magnetic resonance
-
Mass spectrometry
-
Cyber-enabled chemistry
-
Chemical biology
-
Reactors and accelerators
Light Sources
Exploring basic and applied chemistry research often requires high-energy light sources—such as synchrotron and neutron sources. These are typically available only at national facilities, both in the United States and abroad. Examples of important synchrotron sources include the Advanced Light Source (ALS), Advanced Photon Source (APS), National Synchrotron Light Source (NSLS), and Stanford Synchrotron Radiation Laboratory (SSRL) in the United States; the Berliner Elektronenspeicherring-Gesellschaft für Synchrotronstrahlung (BESSY) in Germany and the European Synchrotron Radiation Facility (ESRF) in France; and INDUS 1/INDUS 2 in India and the National Synchrotron Radiation Research Center (NSRRC) in Taiwan.6 Examples of important neutron sources include the Spallation Neutron Source, Oak Ridge National Laboratory, and the University of Missouri Research Reactor Center in the United States; ISIS-Rutherford-
|
6 |
For a full list of worldwide synchrotron light sources, see http://www.lightsources.org/cms/?pid=1000098. |
Appleton Laboratories in the United Kingdom; and the Hi-Flux Advanced Neutron Application Reactor in Korea.7
Scanning Probe Techniques
Most research-intensive universities are well equipped with characterization techniques such as electron microscopy, electron and x-ray diffraction, and probe microscopy, which are used routinely to characterize small structures, small volumes, and thin films. However, the ability to characterize extremely small nanostructures or to tailor materials at an atomic level requires much more specialized equipment.
The DOE is now in the process of opening five nanotechnology centers that will provide just such capabilities. Four are described here, and a fifth will be described in connection with its biological capabilities:
The Center for Nanoscale Materials at Argonne National Laboratory (http://nano.anl.gov/index.html) will take advantage of the unique capabilities of Argonne’s Advanced Photon Source. APS’s hard x-rays, harnessed in a nanoprobe beamline, will provide unprecedented capabilities to characterize extremely small structures.
The Center for Functional Nanomaterials at Brookhaven National Laboratory (http://www.bnl.gov/cfn/) will provides state-of-the-art capabilities for the fabrication and study of nanoscale materials, with an emphasis on atomic-level tailoring to achieve desired properties and functions.
The Center for Integrated Nanotechnologies at Sandia and Los Alamos national laboratories (http://cint.lanl.gov) will feature low vibration for sensitive characterization, chemical/biological synthesis labs, and clean rooms for device integration. Sandia will focus on nanomaterials and microfabrication from the existing Integrated Materials Research Laboratory, while Los Alamos will focus on biosciences and nanomaterials.
The Center for Nanophase Materials Sciences at Oak Ridge National Laboratory (http://www.cnms.ornl.gov/) will concentrate on synthesis, characterization, theory/ modeling/simulation, and design of nanoscale materials. The NSF also funds several related facilities, such as the Cornell Uni-
|
7 |
For a full list of worldwide neutron sources, see the NIST Center for Neutron Research at http://www.ncnr.nist.gov/nsources.html. |
versity Nanofabrication Facility,8 which are available to external users and are part of a larger National Nanotechnology Infrastructure Network.
Nuclear Magnetic Resonance
U.S. chemistry departments typically have several moderately high field NMR spectrometers. National centers such as the NIH-funded National Magnetic Resonance Facility at the University of Wisconsin-Madison provide state of the art, very high field (800- and 900-MHz) NMR instruments not available at most institutions. The National High Magnetic Field Laboratory NMR program at Florida State University supports users pursuing research in solution and solid state NMR and in vivo magnetic resonance spectroscopy. The NMR Resource at University of California San Diego concentrates on structure determination of proteins in biological supramolecular assemblies, such as membrane proteins. The High Field Magnetic Resonance Facility at DOE’s Pacific Northwest National Laboratory (PNNL)has multiple spectrometers for solid state and solution studies, including a 900-MHz NMR, a combined optical and magnetic resonance microscope, and facilities for studies of radioactive waste; about 50 non-PNNL scientists use the facility each year and access its equipment remotely by a secure Internet connection. High-field NMR is widely available to chemists around the world through local and national facilities.
Mass Spectrometry
Because use of mass spectrometry by chemists has increased greatly, most U.S. chemists have access to mass spectrometry facilities at their own institutions to confirm synthesis and support structure elucidations. Heavily used national centers provide more expensive instrumentation and more complex experiments. Most notably, a section of the National High Magnetic Field Laboratory at Florida State University provides state-of-the-art Fourier transform ion cyclotron resonance mass spectrometry. The NSF Arizona Accelerator Mass Spectrometry Laboratory is used primarily to provide radiocarbon measurements. NIH funds a number of national mass spectrometry centers to support biomedical research, including those at Boston University and the Pacific Northwest National Laboratory.
Cyber-Enabled Chemistry
NSF defines cyber-infrastructure as the distributed computer, information, and communication technologies combined with the personnel and
integrating components that provide a long-term platform to empower the modern scientific research endeavor. Examples of cyber-enabled chemistry capabilities include the Pittsburgh Supercomputing Center, the Cornell Theory Center, the National Center for Supercomputing Applications in Urbana-Champaign, and the San Diego Supercomputing Center. Examples of non-U.S. supercomputing facilities used by chemists include the Barcelona Supercomputing Centers, the National Supercomputer Center in Sweden; and the high-performance computing centers in Zürich, Lausanne, and Manno Switzerland.9 Two recently funded NSF centers are highlighted below:
Tools for Ab Initio Molecular Dynamics and Simulation Analysis This is a joint effort of researchers at the University of Illinois and Iowa State University. Their goal is to combine state-of-the-art molecular simulation techniques in a publicly available computer code, for use both by experts and nonexperts. Outcomes of this project include publicly available software tools, along with a workshop for dissemination.
Environmental Molecular Sciences Participants in this project include researchers from Pennsylvania State University. They plan to take a multidisciplinary approach to integrating information about environmental chemistry across many different scales of space and time. A database will be developed at the Center for Environmental Kinetics Analysis, an NSF-supported Environmental Molecular Science Institute, to improve communication among scientists working in various disciplines and at vastly different scales.
Chemical Biology
Chemical biology capabilities are increasingly important to chemists. A few examples of new centers providing state-of-the-art facilities and approaches are given below:
The Molecular Foundry, Lawrence Berkeley National Laboratory, (http://foundry.lbl.gov/) This facility provides instruments and techniques for users pursuing integration of biological components into functional nanoscale materials. It provides biological techniques in a nanotechnology environment, including molecular cloning, protein expression and purification, microbial, plant and mammalian cell culture, and preparation and characterization of cellular components and products for construction of
bio/inorganic assemblies. The facility offers recombinant overexpression of proteins and nucleic acids, genetic engineering of cell lines for materials integration, and protein engineering.
Institute for Systems Biology (http://www.systemsbiology.org/) Building a new kind of research institute—one that can tackle the multidisciplinary challenges of systems biology requires a strategy that itself integrates many sciences, including biology, chemistry, physics, computation, mathematics, and medicine. Because the field of systems biology requires the seamless integration of these disciplines, the Institute for Systems Biology has developed a philosophy, an environment, and an administrative structure that transcend traditional organizational and disciplinary barriers. Scientists collaborate across their specialties to leverage knowledge and expertise with others at the institute and in academia and industry.
Cyberinfrastructure for Next-Generation Biomolecular Modeling The participants in this project include Teresa Head-Gordon and Martin Head-Gordon of the University of California at Berkeley, Vijay Pande of Stanford University, and Jay Ponder of Washington University. They will seek to develop and validate new ways of simulating biological molecules. They will publicly distribute the resulting software, and they will offer workshops to teach these tools to the research community at large.
Reactors and Accelerators
Nuclear reactors and particle accelerators are a critical source of radioisotopes for nuclear medicine research and practice. The need for a domestic source of radioisotopes has been documented in many reports, including most recently a Nuclear Energy Research Advisory Committee Report in 2000. Currently, there is no U.S. facility dedicated to year-round production of radioisotopes, severely compromising nuclear medicine practice and radioisotope R&D needed to advance targeted molecular therapy and other radioisotope needs for the future. Although there are large accelerators in the United States, which produce isotopes for medicine (e.g., the Brookhaven Linear Isotope Production Facility and the Isotope Production Facility at Los Alamos National Laboratory), these are part of high-energy physics accelerators, forcing medical isotope production to run only when large physics experiments are not running. Furthermore, this arrangement is subject to interruption when high-energy physics funding is interrupted. In addition, the high-flux isotope reactor at Oak Ridge, which is equipped to produce radioisotopes, now has neutron scattering experiments as a primary mission, decreasing its availability for radioisotope production
in recent years. In contrast, France has a dedicated 70-MeV cyclotron for radioisotope production that also serves R&D and training needs.
HUMAN RESOURCES
Human resources are an essential component for leadership in chemistry. To conduct leading research, it is necessary to attract and retain the “best and brightest” S&E students from the United States and abroad as they move from undergraduate to graduate school, from graduate school to postdoctoral work, and from postdoctoral positions to faculty and research positions in academe, industry, government, and the nonprofit sector. To provide a broad context, this section first examines trends and key characteristics of S&E human resources. Then, salient features of the U.S. supply of chemists particularly at the graduate level are explored.
Strong Competition for International S&E Human Resources
In terms of sheer numbers of physical and biological sciences undergraduate degrees granted, the United States is outpaced only by India, China, and Russia (Table 4-1). However, the United States ranks lower than most industrialized nations in the percentage of its 24-year-olds who hold natural sciences and engineering degrees (see Figure 4-3). Our competitors in Europe and Asia are producing a higher percentage of S&E degree holders.
TABLE 4-1 Countries with the Largest Numbers of First University Degrees in Physical/Biological Sciences
|
Top 10 Countries |
Number of First University Degrees (Physical/biological sciences) |
|
India (1990) |
147,036 |
|
China (2003) |
103,409 |
|
Russia (1999) |
101,320 |
|
United States (2002) |
79,768 |
|
France (2002) |
27,750 |
|
United Kingdom (2003) |
27,300 |
|
Japan (2004) |
19,727 |
|
Bangladesh (2002) |
18,905 |
|
South Korea (2002) |
12,864 |
|
Brazil (2001) |
12,077 |
|
SOURCE: National Science Foundation, Science and Engineering Indicators 2006, Appendix Table 2-37. |
|
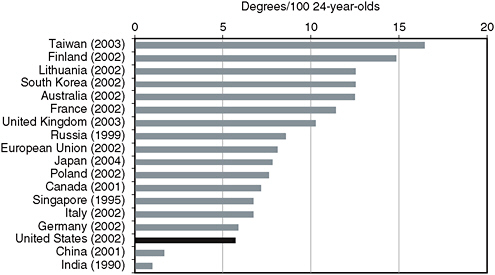
FIGURE 4-3 Natural science and engineering degrees (NS&E) per 100 24-year-olds by country/economy.
NOTE: The most recent data for India and China have likely changed significantly in recent years.
SOURCE: National Science Foundation, Science and Engineering Indicators 2006, based on data from Organization for Economic Cooperation and Development, Center for Education Research and Innovation, Education database, www1.oecd.org/scripts/cde/members/edu_uoeauthenticate.asp; United Nations Educational, Scientific, and Cultural Organization, Institute for Statistics database, http://www.unesco.org/statistics, and national sources.
The United States is the single largest producer of natural science and engineering doctoral degrees (see Figure 4-4). However, the number of U.S. doctorates has been declining gradually since the late 1990s, while the numbers in some countries, particularly China, are growing rapidly.
The United States increasingly relies on foreign-born scientists and engineers. In 2000, 38 percent of U.S. Ph.D. scientists and engineers were foreign-born, whereas in 1990 only 22 percent were foreign-born. Over the years the United States has been successful at attracting foreign-born scientists and engineers (see Figure 4-5), and a large portion of those who come to the United States to earn a Ph.D. in science or engineering stay here. A 2005 study found that 71 percent of foreign citizens who received S&E doctorates from U.S. universities in 2001 lived in the United States in 2003.10 The study also found that among S&E discipline, the highest stay
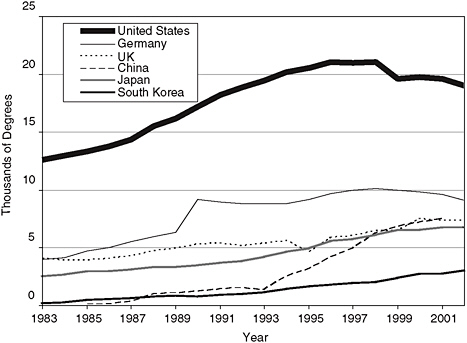
FIGURE 4-4 Natural science and engineering doctoral degrees.
SOURCE: National Science Foundation, Science and Engineering Indicators 2006, Figure 2-34.
rates were for computer/electrical and electronic engineering and the physical sciences. Most foreign doctorate recipients come from four countries. The stay rates for two of these countries, China (90 percent) and India (86 percent), are very high, while those for the other two, Taiwan (47 percent) and Korea (34 percent), are well below the average for all countries.
Steady Supply of Chemists in the United States
A good measure of the near-term supply of new chemists is to look at the recent trend in the numbers of graduate students in the United States, which will be discussed in more detail below. A measure of the midterm availability of U.S. research chemists is provided by the number of B.S. chemistry degrees granted in the U. S., which has drifted down by about 10 percent over the past decade. On a still longer time scale, the supply of chemists, and scientists and engineers overall, depends on the current state of the U.S. K-12 educational system. Here, there have been ongoing concerns about K-12 math and science education in the United States compared with other countries, largely based on the results of the internationally ad-
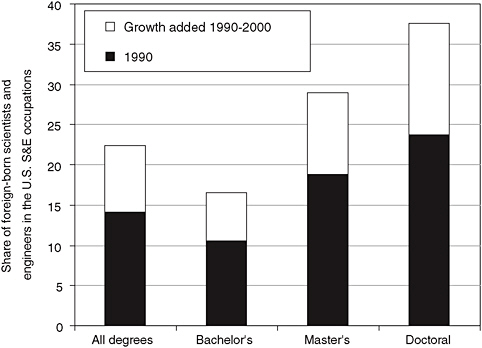
FIGURE 4-5 Share of foreign-born scientists and engineers in U.S. S&E occupations, by degree level, 1990 and 2000. NOTE: Data exclude postsecondary teachers because of U.S. Census Bureau occupation coding.
SOURCE: Science and Engineering Indicators 2006 based on data from U.S. Census Bureau, 5-Percent Public-Use Microdata Sample, www.census.gov/main/www/pums.html.
ministered tests. In 2004, the NSF summarized the situation: “U.S. students are performing at or below the levels attained by students in other countries in the developed world,” and “In international comparisons, U.S. student performances become increasingly weaker at higher grade levels.”11 More recent results reported by the NSF showed a more mixed picture—where U.S. fourth and eighth grade students scored above average on the international tests, but U.S. 15-year-olds scored below average.12
Because of difficulties in locating quantitative data on chemistry human resources at the international level, the panel has concentrated on the trends in the numbers of U.S. chemistry graduate students and chemistry Ph.D. degrees. The following figures demonstrate that the number of U.S. chemistry graduate students and the number of Ph.D.s granted have remained fairly steady over the past 10 to 20 years. However, the demographics show an increasing percentage of foreign-born chemistry graduate students and new Ph.D.s.
Figure 4-6 shows that total U.S. graduate enrollment in chemistry was relatively flat between 1983 and 2004. However, examination of the residence status of graduate students shows a steady decline in the number of U.S. citizens/permanent residents enrolled in chemistry graduate programs.
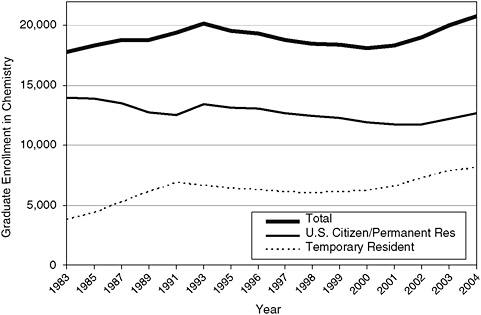
FIGURE 4-6 Total graduate enrollment in chemistry and enrollments based on residency status: U.S. citizen/permanent resident versus temporary residents, 1983-2004.
SOURCE: Science and Engineering Indicators 2006, Appendix Table 2-15, and National Science Foundation, Division of Science Resources Statistics, Graduate Students and Postdoctorates in Science and Engineering: Fall 2004, NSF 06-325, Arlington, VA.
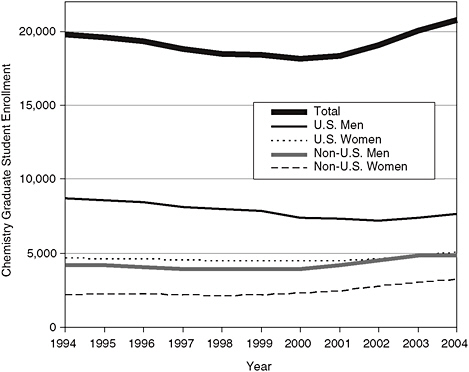
FIGURE 4-7 Total graduate enrollment in chemistry and enrollments based on residency status: U.S. citizen/permanent resident (U.S.) men and women versus temporary (non-U.S.) residents, 1994-2004.
SOURCE: National Science Foundation, National Science Foundation-National Institutes of Health Survey of Graduate Students and Postdoctorates, Resources Data System (WebCASPAR), http://webcaspar.nsf.gov (accessed September 25, 2006).
This decline has been largely made up by an increase in the enrollment of temporary residents.
The most recent data (2000-2004) show some growth in the number of chemistry graduate students, mainly due to an increase in non-U.S. students (see Figure 4-7).
While the numbers of black and Hispanic graduate students have grown slowly, these groups remain drastically underrepresented (see Figure 4-8).
The number of U.S. chemistry Ph.D.s granted each year reflects the health of U.S. academic chemistry and determines the availability of new researchers for the U.S. chemical industry. The number of chemistry Ph.D.s earned in the United States grew steadily between the late 1970s and early 1990s, largely due to increased numbers of doctorates awarded to tempo-
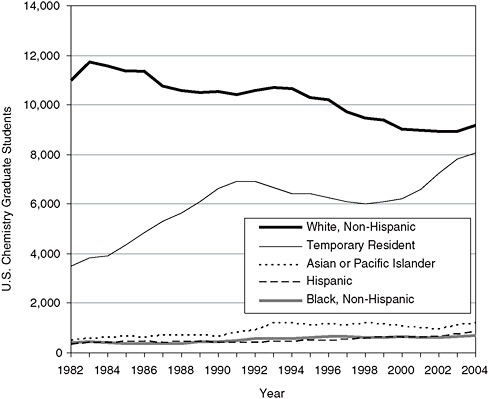
FIGURE 4-8 U.S. chemistry graduate students by race/ethnicity.
SOURCE: WebCASPAR.
rary residents and U.S. women (see Figure 4-9). Between 1994 and 2004, the number of chemistry doctorates declined slightly, especially due to declining numbers of Ph.D.s awarded to U.S. men. Over the past 15 years, the number of U.S. chemistry Ph.D.s has remained in the neighborhood of 2,000 per year, with an increasing composition earned by temporary residents.
Over the past 20 years the number of chemistry graduate students receiving support has remained largely unchanged (see Figure 4-10). Most graduate students are supported by either research or teaching assistantships.
A survey conducted by the NSF and the NIH shows that these agencies support similar numbers of graduate research assistants (RAs) and account for over 75 percent of support from federal agencies (see Figure 4-11).
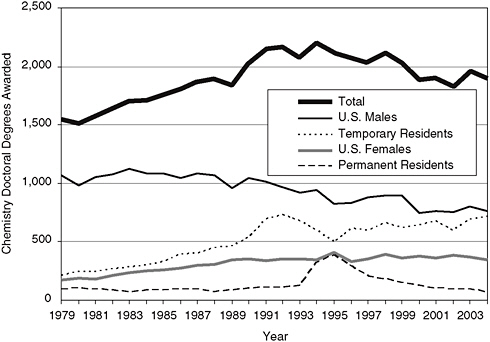
FIGURE 4-9 Earned doctoral degrees in chemistry from U.S. institutions as a function of residency status, 1979-2004.
SOURCE: National Science Foundation/Science Resource Statistics, Survey of Earned Doctorates, Integrated Science and Engineering Resources Data System (WebCASPAR), http://webcaspar.nsf.gov (accessed September 5, 2006).
Nonfederal sources also fund a large number of chemistry RAs and have contributed significantly to the overall growth in the number of RAs.
The number of chemistry postdoctorates has grown steadily over the years (see Figure 4-12). Three factors contributing to this increase are the rising proportion of new Ph.D.s pursuing postdoctoral work, the increasing time spent in postdoctoral positions, and the increasing number of postdoctorates recruited from Ph.D. programs abroad. The proportion of foreign-born postdoctoral researchers increased from 56 percent in 1979 to 67 percent in 2004.
Moderate Job Prospects and Salaries for U.S. Chemistry Workforce
Employment of chemistry degree holders has steadily increased over the years (see Figure 4-13). The percent change from 1999 to 2003 was
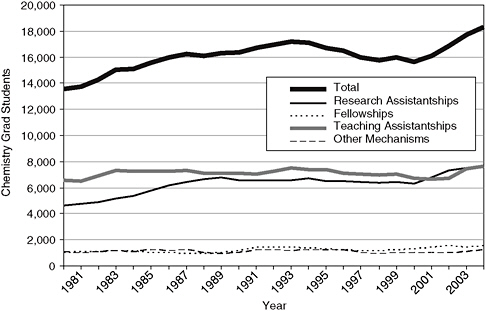
FIGURE 4-10 Full-time chemistry graduate students by mechanism of support, 1980-2004.
SOURCE: NSF/SRS, Survey of Earned Doctorates, Integrated Science and Engineering Resources Data System (WebCASPAR), http://webcaspar.nsf.gov (accessed September 5, 2006).
15 percent overall, 16 percent for bachelor degree holders, 19 percent for master degree holders, and 11 percent for Ph.D.s.
Chemistry employment has increased across all employment sectors (see Figure 4-14). The employment distribution has remained steady with 71 percent employed in business, 21 percent in education, and 9 percent in government.
Since a significant number of chemistry degree holders enter other occupations, the employment of chemists, as opposed to chemistry degree holders, is a slightly different story. According to the 2006 ACS annual employment survey, 3.0 percent of the survey respondents were unemployed and seeking employment (see Figure 4-15).
NSF surveys of recent chemistry Ph.D. recipients indicate some deterioration in the job market.13 One to three years after receiving their doctorates, Ph.D. chemists reported an increase in unemployment from 0.8
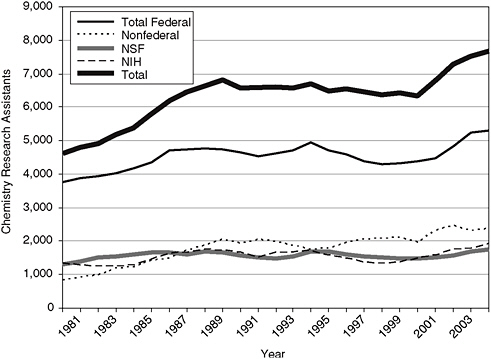
FIGURE 4-11 Full-time graduate students in chemistry on research assistantships, by funding source. (The total federal funding includes funds from the NSF, the NIH, and other federal funding sources.)
SOURCE: National Science Foundation/Science Resources Statistics, National Science Foundation-National Institutes of Health Survey of Graduate Students and Postdoctorates in S andE, Integrated Science and Engineering Resources Data System (WebCASPAR), http://webcaspar.nsf.gov (accessed September 5, 2006).
percent in 2001 to 2.0 percent in 2003 and an increase in involuntary out-of-field employment from 3.2 percent in 2001 to 5.6 percent in 2003.
The Bureau of Labor Statistics has commented on the job prospects for chemists over the next 5 to 10 years:
Employment of chemists is expected to grow more slowly than the average rate (0-8 percent) for all occupations through 2014. Job growth will be concentrated in pharmaceutical and medicine manufacturing and in professional, scientific, and technical services firms. Employment in the non-pharmaceutical segments of the chemical industry, a major employer of chemists, is expected to decline over the projection period. Consequently, new chemists at all levels may experience competition for jobs in these segments, including basic chemical manufacturing and synthetic materi-
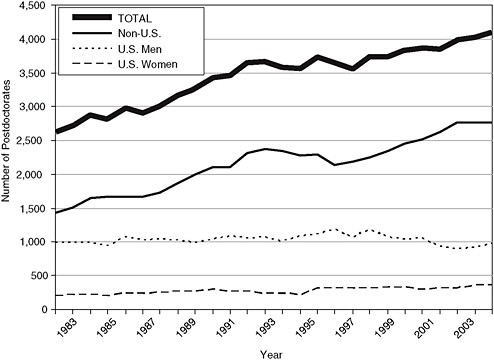
FIGURE 4-12 Numbers of chemistry postdoctorates by citizenship status and gender.
SOURCE: National Science Foundation/Science Resources Statistics, Survey of Graduate Students and Postdoctorates, Integrated Science and Engineering Resources Data System (WebCASPAR), http://webcaspar.nsf.gov (accessed September 25, 2006).
als. Graduates with a master’s degree, and particularly those with a Ph.D., will enjoy better opportunities at larger pharmaceutical and biotechnology firms. Furthermore, those with an advanced degree will continue to fill most senior research and upper management positions, although applicants are likely to experience competition for these jobs.14
Data from the American Chemical Society15 show that starting salaries for inexperienced chemists have steadily increased since 1994 (see Figure 4-16). The 3.08 percent average annual increase between 1994
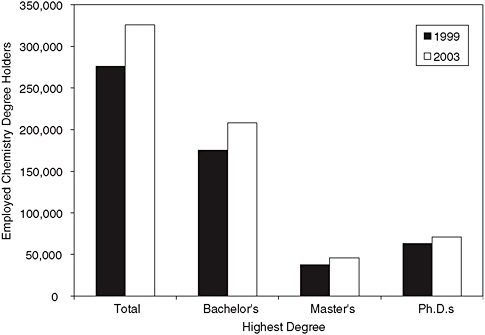
FIGURE 4-13 Comparison of employed chemistry degree holders, for 1999 and 2003.
SOURCE: Science and Engineering 2004, 2006.
and 2004 was slightly better than inflation (2.42 percent average annual increase).16
Earnings for more experienced chemists with Ph.D.s (see Figure 4-17) grew at an average annual rate of 3.7 percent between 1993 and 2003. This rate is 0.6 percent faster than the annual increase in starting salaries and 1.3 percent faster than inflation.17
|
16 |
The Consumer Price Index average annual increase for 1975 to 2004 was 4.42 percent (Bureau of Labor Statistics Inflation Calculator, $1 in 1975 was equivalent to $3.51 in 2004), data.bles.gov/cgi-bin/cpicalc.pl accessed September 8, 2006. |
|
17 |
The Consumer Price Index, average annual increase for 1993-2003 was 2.42 percent. According to the Bureau of Labor Statistics Inflation Calculator, $1 in 1993 was equivalent to $1.27 in 2003. |
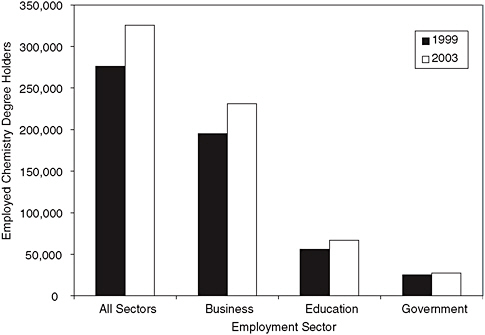
FIGURE 4-14 Comparison of employed chemistry degree holders across different sectors, 1999 and 2003.
SOURCE: Science and Engineering 2004, 2006.
R&D FUNDING
This section looks first at trends in international levels of S&E funding and then at trends in funding for chemistry in the United States.
Steady Funding for S&E in the United States
The United States spent more on science and engineering R&D between 1981 and 2002 than any other OECD country (see Figures 4-18 and 4-19). In 2003, the United States spent over $250 billion (constant 2000 U.S.$.) on total R&D; this is 43 percent of the world total. Between 1981 and 2001, the U.S. percentage of world R&D expenditures declined from 45 to 43 percent, and the G-7 percentage declined from 91 to 84 percent. The U.S. defense-related R&D expenditures were about $50 billion—an amount equivalent to Germany’s total S&E expenditures.
The intensity of a nation’s investment in S&E is better measured as a percentage of its gross domestic product spent on R&D. In 2003 the United
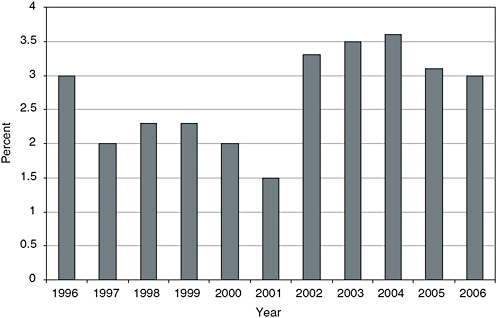
FIGURE 4-15 Unemployment rate for chemists, 1996-2006.
NOTE: As of March 1 each year. Based on population that excluded those fully retired or otherwise unemployed and not seeking employment.
SOURCE: ACS salary survey 2006, C&E News, 84(38), September 18, 2006.
States spent a smaller percentage of its GDP (2.2 percent) on nondefense R&D than either Japan (3.1 percent) or Germany (2.5 percent; see Figure 4-20). The European Union has a stated goal of spending 3.0 percent of GDP on research. In December 2006 the European Parliament approved the Seventh Framework Program, a 55 billion Euro, seven-year package to increase the research budget by 40 percent.18
Steady U.S. Funding for Chemistry R&D
In 2004 nearly $1.3 billion was spent on chemistry R&D by U.S. academic institutions (see Figure 4-21). The federal government provided 70 percent of this funding.
In terms of constant 2000 dollars, the U.S. federal obligations for total research in chemistry declined from a high of just over $1 billion in 1992
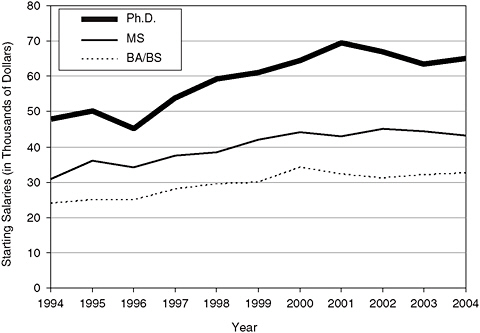
FIGURE 4-16 Median starting salaries for inexperienced chemists by degree held, 1994-2004.
SOURCE: American Chemical Society 2004 Survey on Starting Salaries of Chemists and Chemical Engineers.
to about $800 million in 1999 (see Figure 4-22). However, more recently, federal support has increased to a little more than $1 billion. Federal obligations for chemistry ranged from 3 to 4 percent of the total U.S. R&D budget between 1984 and 1998 and then dropped to 2 to 3 percent since 1999. The spike in 2000 was due to both the start of the doubling of the NIH budget and a change in the NIH accounting, which classified all of its development activities as research. The significance of the changes in the NIH budget will be discussed in the next section.
A comparison of federal funding for chemistry research with that in related areas of physical sciences and engineering is shown in Figure 4-23.
The Changing Landscape for Chemistry R&D Funding
The different federal agency contributions to the total funding for both nonacademic and academic chemistry research are shown in Figure 4-24.
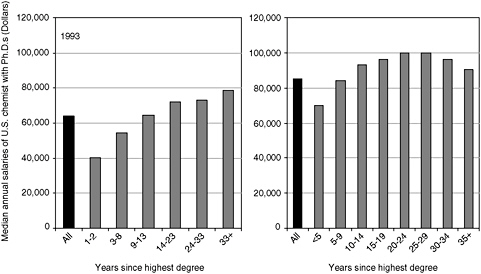
FIGURE 4-17 Median annual salaries for chemists with Ph.D.s by years since highest degree received, 1993 and 2003.
SOURCE: National Science Foundation/Science Resources Statistics, 1993 and 2003 Survey of Doctorate Recipients. Median annual salaries of U.S. che
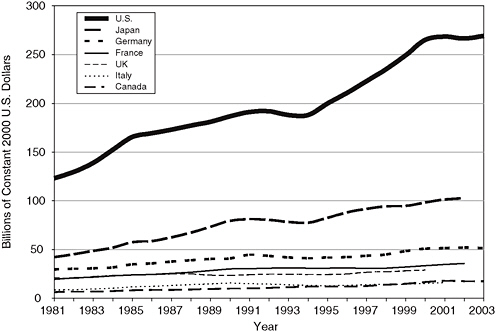
FIGURE 4-18 International R&D expenditures for select countries, 1981-2003, in billions of constant 2000 U.S. dollars.
SOURCE: Science and Engineering Indicators 2006, Appendix Table 4-42.
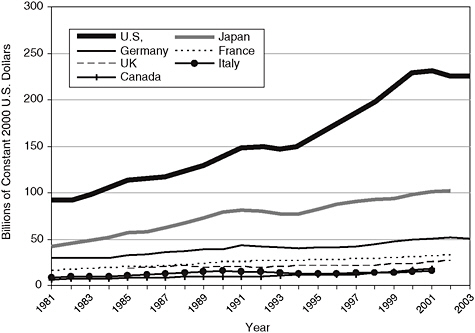
FIGURE 4-19 International nondefense R&D expenditures for select countries, 1981-2003.
SOURCE: Science and Engineering Indicators 2006, Appendix Table 4-43.
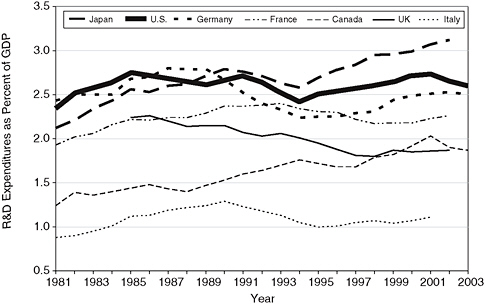
FIGURE 4-20 International nondefense R&D as percentage of GDP, by selected country, 1981-2003.
SOURCE: Science and Engineering Indicators 2006, Appendix Table 4-43.
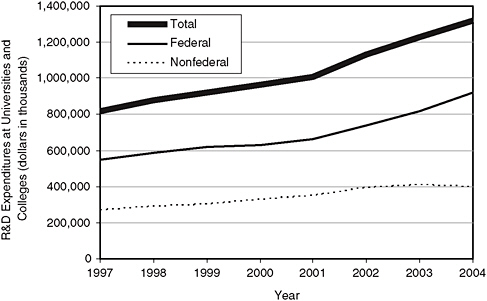
FIGURE 4-21 Federal and nonfederal R&D expenditures for chemistry at academic institutions.
SOURCE: NSF, Division of Science Resources Statistics, Survey of Research and Development Expenditures at Universities and Colleges, FY 2004.
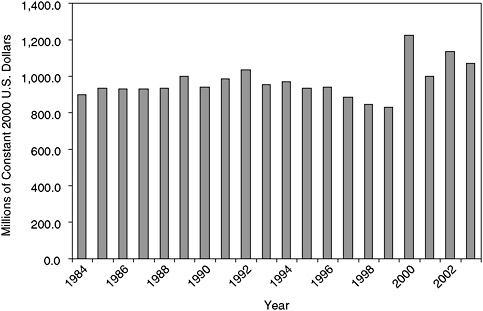
FIGURE 4-22 Federal obligations for total research in chemistry.
SOURCE: Science and Engineering Indicators 2006, Appendix Table 4-32.
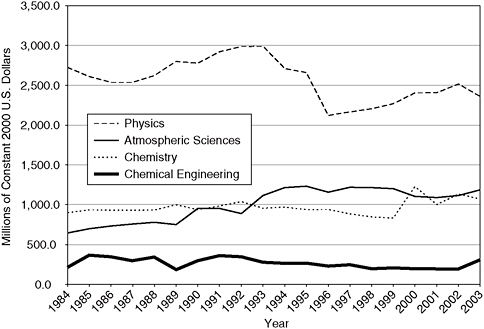
FIGURE 4-23 Federal obligations for total research, by related fields; FY 1984-2003.
SOURCE: Science and Engineering 2006, Appendix Table 4-32.
Over the years the principal sources of funding have been NSF, DOE, DOD, NIH, and, to a lesser extent, USDA. During the 1990s DOE became the largest contributor, reaching a maximum of $267 million in 1996. Starting in 2000, NIH has been the largest contributor as a result of the doubling of its budget.
DOE remains a strong contributor to chemistry research. A comparison of DOE Basic Energy Sciences funding for core research areas in chemistry, geosciences, and biosciences is shown in Figure 4-25 and that for materials is shown in Figure 4-26. Between FY 2001 and FY 2005, there were large increases for catalysis and chemical transformations ($10 million) and materials chemistry ($16 million).
As seen for total chemistry research support in Figure 4-24, support of academic chemistry research has shifted toward more reliance on NIH support (see Figure 4-27). Between 1993 and 2003, the NIH contribution to federal academic research obligations for chemistry increased from 27 to over 40 percent. The proportion of R&D funding for academic chemistry
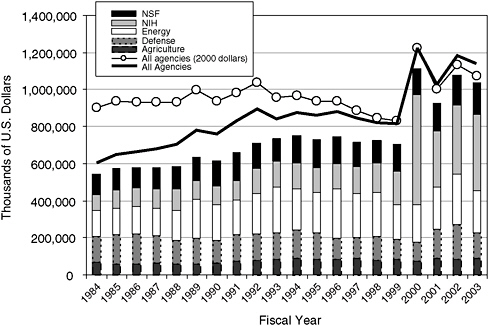
FIGURE 4-24 Federal obligations for total chemistry research, by select agency FY 1970-2003.
SOURCE: National Science Foundation, Federal Funds for R&D.
research coming from NSF, DOD, and USDA decreased significantly over this period.
What did the five year doubling of the NIH budget between 1998 and 2003 do for chemistry research supported by NIH? Examination of what happened at the National Institute of General Medical Sciences (NIGMS), which is a major source of chemistry support (see Figure 4-28), provides some answers. The average size of an R01 grant increased from $150,000 to $190,000 in annual direct costs. Smaller, but significant, increases also occurred in the number of NIGMS investigators with more than one NIH grant (from 33 to 42 percent) and in the total number of grants (from 820 to 991) and investigators supported (from 3,599 to 4,111). In addition, the increased funds allowed NIGMS to make some substantial investments in high-field NMR spectrometers and synchrotron radiation facilities that serve a large number of investigators. The budget increases also allowed NIGMS to initiate several larger program, including the Protein Structure Initiative.
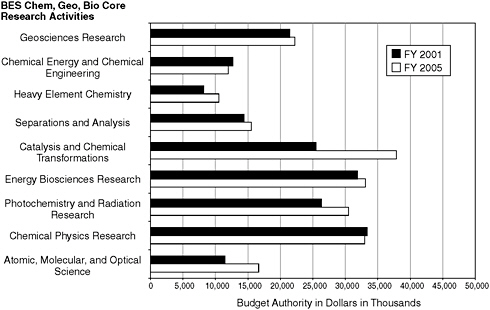
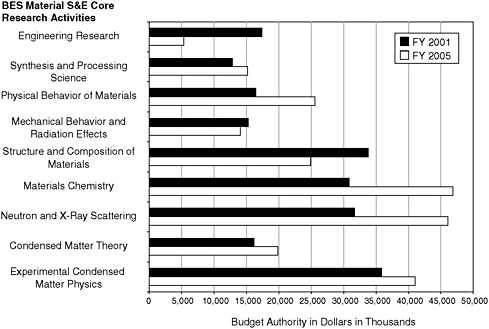
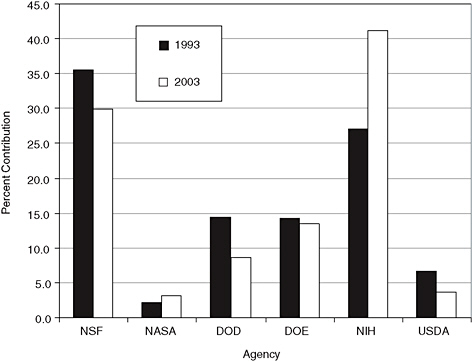
FIGURE 4-27 Federal academic research obligations for chemistry provided by major agencies.
SOURCE: Science and Engineering Indicators 2006, Appendix Table 5.09, and Science and Engineering Indicators 1996, Appendix Table 5.11.
Because NIH is the largest supporter of chemistry research, the success rate of funding for new and continuing NIH grants and the annual variability of funding rates have both a financial and a psychological impact on U.S. chemistry. The likelihood of investigator-initiated unsolicited R01 research grant applications being funded for all of NIH since 1999 is shown in Table 4-2. The success rates presented are for the original type-1 (new) and type-2 (renewal) R01 applications and do not consider resubmissions. Revision and resubmission of initially rejected type-1 application improve the likelihood of eventual funding by a factor of approximately 2, with smaller increases for rejected type-2 grants. The likelihood of funding type-1 and type-2 applications reached a low point in fiscal year 1994: approximately 12 percent for type-1 applications and 37 percent for type-2 applications. Success rates then improved and peaked between FY 1999 and 2001. Despite the doubling of the entire NIH budget between FY 1999 and FY 2003, success rates, total number of grants awarded, and total dollars committed have dropped steadily since FY 2002. In FY 2005, the decline
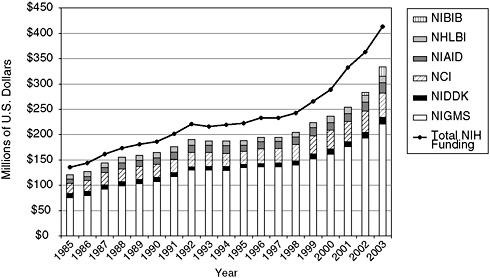
FIGURE 4-28 NIH support for chemistry department programs by institute, 1985-2003.
NOTES: NIBIB; National Institute of Biomedical Imaging and Bioengineering, NHLBI; National Heart, Lung, Blood Institute; NIAID, National Institute of Allergy and Infectious Diseases; NCI, National Cancer Institute; NIDDKD, National Institute of Diabetes and Digestive and Kidney Diseases; NIGMS, National Institute of General Medical Sciences. Chemistry department data include departments with titles such as pharmaceutical chemistry, medicinal chemistry, chemistry and chemical biology, and chemistry and biochemistry as well as departments of chemistry.
SOURCE: National Institute of General Medical Sciences Office of Program Analysis and Evaluation compilation of chemistry department support based on data from the NIH IMPAC system.
was precipitous to a success rate of 9 percent for type-1 applications and 32 percent for type-2 applications. Because the total NIH allocation for FY 2006 is less than the biomedical inflation index, a trend toward further diminished support of R01 applications is likely.
While inclusion of the success of revised applications provides a somewhat less bleak picture, each revision of a type-1 application delays the initiation of innovative research by nearly a year; the slow, uncertain revision process causes anxiety and discouragement that often lead beginning investigators to reevaluate their career choice. For an ongoing type-2 research activity, rejection casts major doubt on eventual continuation and frequently results in the breakup of teams of highly trained personnel.
The breakdown of funding for the divisions of the NSF Mathematical and Physical Sciences Directorate (MPS) is shown in Figure 4-29. The
TABLE 4-2 Fate of Unamended (Unsolicited) NIH R01 Research Grant Applications
|
Fiscal Year |
Number Submitted |
Number Awarded |
Total $ Awarded (millions) |
Success Rate (%) |
|
Type-1 grants: new submissions |
||||
|
1999 |
8957 |
1761 |
456 |
19.7 |
|
2000 |
8626 |
1736 |
503 |
20.1 |
|
2001 |
8284 |
1590 |
501 |
19.2 |
|
2002 |
8560 |
1556 |
510 |
18.2 |
|
2003 |
9605 |
1477 |
493 |
15.4 |
|
2004 |
10624 |
1288 |
438 |
12.1 |
|
2005 |
10605 |
970 |
351 |
9.1 |
|
Type-2 grants: continuation (renewal) submissions |
||||
|
1999 |
3214 |
1772 |
554 |
55.1 |
|
2000 |
3233 |
1708 |
563 |
52.8 |
|
2001 |
3100 |
1637 |
583 |
52.8 |
|
2002 |
3153 |
1555 |
559 |
49.3 |
|
2003 |
3767 |
1697 |
627 |
45.0 |
|
2004 |
3773 |
1530 |
580 |
40.6 |
|
2005 |
3896 |
1262 |
496 |
32.4 |
|
Declines in Funding of NIH R01 Research Grants SOURCE: Mandel, H. G., and E. S. Vesell, 2006, Science 313(8):1387. |
||||
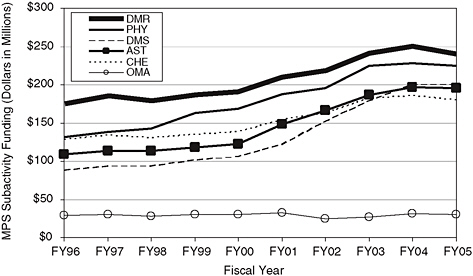
FIGURE 4-29 NSF Math and Physical Sciences Directorate funding for divisions in millions of U.S. dollars: Materials Research (DMR), Physics (PHY), Chemistry (CHE), Mathematical Sciences (DMS), Astronomical Sciences (AST), and Multidisciplinary Activities (OMA).
SOURCE: National Science Foundaton FY 2006 Budget Request, available at http://www.nsf.gov/about/budget/ (accessed October 5, 2006).
Chemistry Division mainly supports chemistry research at academic institutions. Changes in funding for divisions at NSF are often related to special initiatives, such as the National Nanotechnology Initiative. Funding for mathematical sciences and astronomical sciences has overtaken funding for chemistry since 2000. The large increase in funding for mathematical sciences reflects a congressionally supported initiative to make mathematical sciences a priority area over a five-year period. The increase for astronomical sciences was related in part to an MPS initiative, “Physics of the Universe,” linked to an NRC report, Connecting Quarks with the Cosmos. The MPS budget request for 2007 (not shown in Figure 4-30) proposes an increase for the Chemistry Division related to an initiative on the molecular basis of life processes.
The research proposal funding rate for NSF’s Chemistry Division is shown in Table 4-3. The funding or success rate for proposals is the total number of grant applications funded in a given fiscal year divided by the number of different grant applications that were peer reviewed. While the number of awards has remained fairly stable and the median annual size of awards increased between 1997 and 2005, the funding rate for awards has steadily decreased from 34 to 26 percent. (For similar data for CHE funding areas, see the appendix of this chapter.)
SUMMARY
U.S. research leadership in chemistry is the result of a combination of key factors, including a national instinct to respond to external challenges and to compete for leadership.
TABLE 4-3 Research Proposal Funding Rate for NSF Chemistry Division, FY 1997-2005
|
FY |
No. of Proposals |
No. of Awards |
Funding Rate (%) |
Median Annual Size |
|
2005 |
1,635 |
419 |
26 |
$126,333 |
|
2004 |
1,708 |
457 |
27 |
$114,083 |
|
2003 |
1,520 |
480 |
32 |
$115,000 |
|
2002 |
1,407 |
438 |
31 |
$107,000 |
|
2001 |
1,343 |
435 |
32 |
$108,000 |
|
2000 |
1,241 |
407 |
33 |
$109,950 |
|
1999 |
1,124 |
390 |
35 |
$101,453 |
|
1998 |
1,267 |
398 |
31 |
$105,000 |
|
1997 |
1,378 |
467 |
34 |
$92,887 |
|
SOURCE: NSF Budget Internet Information System, available at http://dellweb.bfa.nsf.gov/ (assessed October 6, 2006). |
||||
-
Over the years the United States has been a leader in innovation as a result of interactions with and support from a strong U.S. chemical industry.
-
The wide range of funding sources for support of academic chemical research (including industry, multiple federal agencies, state initiatives, universities, and private foundations) facilitates innovative research.
-
Key characteristics of the U.S. scientific culture that underlie current and future leadership in chemistry research include cross-sector collaborations and international partnerships, strong professional societies, early full independence of investigators, and mobility across academic institutions.
-
Major centers and facilities provide key infrastructure and capabilities for conducting research and have provided the foundation for U.S. leadership. Key capabilities for chemistry research include advanced light sources, scanning probe instruments, supercomputers, very high field nuclear magnetic resonance spectrometers, advanced mass spectrometers, nuclear reactors and accelerators, and specialized facilities for chemical biology.
-
There is increasingly strong competition for international S&E human resources. The United States has maintained a steady supply of Ph.D. chemistry graduates by increasingly relying on foreign-born students. Over time the number of U.S. students (particularly males) pursuing chemistry Ph.D. degrees has declined.
-
Research funding for S&E overall and chemistry in particular has been steady, but an increasing percentage of support for U.S. chemical research is coming from NIH.
APPENDIX
Research Proposal Funding Rate for NSF Chemistry Division Research Areas, FY 1997 to 2005
|
CHE Funding Areas |
FY |
Proposals |
Awards |
Funding Rate (%) |
Median Annual Size |
|
Analytical Separations and Measurements |
2005 |
109 |
19 |
17 |
$124,333 |
|
2004 |
94 |
23 |
24 |
$120,000 |
|
|
2003 |
86 |
31 |
36 |
$100,000 |
|
|
2002 |
74 |
18 |
24 |
$102,382 |
|
|
2001 |
75 |
16 |
21 |
$124,880 |
|
|
2000 |
98 |
24 |
24 |
$115,978 |
|
|
1999 |
71 |
13 |
18 |
$122,800 |
|
|
1998 |
103 |
14 |
14 |
$78,125 |
|
|
1997 |
98 |
25 |
26 |
$74,750 |
|
|
Bimolecular Processes |
2005 |
72 |
17 |
24 |
$150,000 |
|
2004 |
85 |
21 |
25 |
$112,540 |
|
|
2003 |
94 |
26 |
28 |
$132,885 |
|
|
2002 |
86 |
28 |
33 |
$100,516 |
|
|
2001 |
64 |
20 |
31 |
$121,260 |
|
|
2000 |
86 |
26 |
30 |
$110,150 |
|
|
1999 |
45 |
21 |
47 |
$117,550 |
|
|
1998 |
44 |
17 |
39 |
$102,000 |
|
|
1997 |
47 |
16 |
34 |
$97,414 |
|
|
Chemical Instrumentation |
2005 |
134 |
37 |
28 |
$70,380 |
|
2004 |
141 |
33 |
23 |
$62,041 |
|
|
2003 |
99 |
28 |
28 |
$54,213 |
|
|
2002 |
107 |
28 |
26 |
$60,628 |
|
|
2001 |
93 |
30 |
32 |
$53,681 |
|
|
2000 |
131 |
41 |
31 |
$42,375 |
|
|
1999 |
129 |
44 |
34 |
$64,423 |
|
|
1998 |
112 |
43 |
38 |
$121,985 |
|
|
1997 |
255 |
80 |
31 |
$100,000 |
|
|
Chemistry Education |
2005 |
93 |
4 |
4 |
$307,672 |
|
2004 |
145 |
27 |
19 |
$38,535 |
|
|
2003 |
8 |
5 |
63 |
$78,568 |
|
|
2002 |
8 |
4 |
50 |
$49,938 |
|
|
2001 |
5 |
4 |
80 |
$71,857 |
|
|
2000 |
4 |
2 |
50 |
$66,621 |
|
|
1999 |
3 |
3 |
100 |
$367,167 |
|
|
1997 |
1 |
1 |
100 |
$29,954 |
|
CHE Funding Areas |
FY |
Proposals |
Awards |
Funding Rate (%) |
Median Annual Size |
|
Electrochemistry and Surface Chemistry |
2005 |
135 |
35 |
26 |
$126,667 |
|
2004 |
107 |
29 |
27 |
$142,333 |
|
|
2003 |
100 |
34 |
34 |
$122,000 |
|
|
2002 |
117 |
42 |
36 |
$119,637 |
|
|
2001 |
96 |
37 |
39 |
$121,333 |
|
|
2000 |
100 |
27 |
27 |
$127,113 |
|
|
1999 |
113 |
39 |
35 |
$108,571 |
|
|
1998 |
94 |
26 |
28 |
$128,078 |
|
|
1997 |
77 |
44 |
57 |
$96,724 |
|
|
Major Research Instrumentation |
2005 |
121 |
39 |
32 |
$98,279 |
|
2004 |
106 |
41 |
39 |
$82,581 |
|
|
2003 |
124 |
46 |
37 |
$83,507 |
|
|
2002 |
125 |
42 |
34 |
$84,919 |
|
|
2001 |
138 |
54 |
39 |
$65,268 |
|
|
2000 |
57 |
17 |
30 |
$100,000 |
|
|
1999 |
46 |
18 |
39 |
$97,875 |
|
|
1998 |
54 |
12 |
22 |
$88,835 |
|
|
Materials Synthesis and Processing |
2002 |
78 |
22 |
28 |
$120,000 |
|
2001 |
103 |
18 |
17 |
$126,385 |
|
|
2000 |
53 |
15 |
28 |
$120,000 |
|
|
1999 |
38 |
12 |
32 |
$103,140 |
|
|
1998 |
39 |
14 |
36 |
$110,300 |
|
|
1997 |
39 |
9 |
23 |
$96,250 |
|
|
Methodology |
2005 |
118 |
27 |
23 |
$135,000 |
|
2004 |
110 |
34 |
31 |
$124,767 |
|
|
2003 |
111 |
38 |
34 |
$131,285 |
|
|
2002 |
82 |
30 |
37 |
$122,217 |
|
|
2001 |
71 |
29 |
41 |
$126,667 |
|
|
2000 |
65 |
24 |
37 |
$117,882 |
|
|
1999 |
41 |
18 |
44 |
$115,470 |
|
|
1998 |
92 |
34 |
37 |
$102,980 |
|
|
1997 |
94 |
35 |
37 |
$86,375 |
|
|
Nanoscale: Exploratory Research |
2003 |
30 |
2 |
7 |
$100,000 |
|
2002 |
26 |
4 |
15 |
$69,500 |
|
|
2001 |
3 |
3 |
100 |
$95,000 |
|
|
Nanoscale: Intrdisciplinary Research |
2005 |
21 |
1 |
5 |
$325,000 |
|
2004 |
22 |
1 |
5 |
$325,000 |
|
|
2003 |
29 |
1 |
3 |
$262,978 |
|
|
2002 |
28 |
2 |
7 |
$287,779 |
|
|
2001 |
28 |
2 |
7 |
$315,000 |
|
CHE Funding Areas |
FY |
Proposals |
Awards |
Funding Rate (%) |
Median Annual Size |
|
Nanoscale: Science and Engineering Center |
2001 |
1 |
1 |
100 |
$3,295,000 |
|
Physical and Inorganic |
2005 |
143 |
34 |
24 |
$136,500 |
|
2004 |
138 |
42 |
30 |
$124,833 |
|
|
2003 |
98 |
35 |
36 |
$113,000 |
|
|
2002 |
77 |
31 |
40 |
$120,000 |
|
|
2001 |
50 |
23 |
46 |
$148,233 |
|
|
2000 |
49 |
18 |
37 |
$125,000 |
|
|
1999 |
53 |
20 |
38 |
$126,933 |
|
|
1998 |
54 |
27 |
50 |
$130,000 |
|
|
1997 |
57 |
19 |
33 |
$112,667 |
|
|
SOURCE: NSF Budget Internet Information System available at http://dellweb.bfa.nsf.gov/ (assessed October 6, 2006). |
|||||


