
Appendix C
The Relationship Between Impairments and Earnings Losses in Multicondition Studies
John F. Burton, Jr., Seth Seabury, Michael McGeary, and Robert T. Reville
The purpose of this study is to provide assistance to the Institute of Medicine (IOM) Committee on Medical Evaluation of Veterans for Disability Compensation, and, in particular, to help address portions of the committee’s first task:
How well do the medical criteria in the VA Rating Schedule and VA rating regulations enable assessment and adjudication of the proper levels of disability to compensate both for the impact on quality of life and impairment in earnings capacity? Provide an analysis of the descriptions associated with each condition’s rating level that considers progression of severity of condition as it relates to quality-of-life impairment and impairment in average earnings capacity.
This study focuses on the aspect of task 1 concerned with the relationship between the medical criteria used to determine the level of disability and the impairment (or limitation) in earning capacity associated with that level of disability. More specifically, this study examines the relationship between impairments (the medical consequences of injuries or diseases) and the actual loss of earnings (the economic consequences of the impairments). We also discuss the intermediate consequences between impairments and actual earnings losses, such as the loss of earning capacity. The relationships will be examined with evidence from multicondition studies (that is, studies involving two or more medical conditions). The study will not examine the relationship between impairments (the medical consequences of injuries and diseases) and quality-of-life impairment (sometimes referred to as “noneconomic losses” or “nonwork disability”). The study will rely
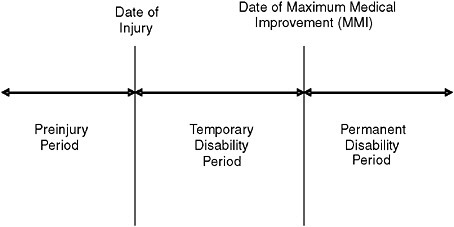
FIGURE C-1 Three time periods in a workers’ compensation case where the injury has permanent consequences.
on selected previous studies from workers’ compensation, on new data from the Californian workers’ compensation program, and on the 1971 Economic Validation of the [Veterans Administration] Rating Schedule (ECVARS) study.
CONCEPTUAL FRAMEWORK1
Three Time Periods
As shown in Figure C-1, three time periods are pertinent in compensating a worker with an injury serious enough to result in permanent disability benefits. The preinjury period is relevant because inter alia the employee’s average weekly wage is used to calculate the cash benefits after the worker is injured. The temporary disability period refers to the time from the onset of the injury or disease until the date of maximum medical improvement (MMI) has been reached; and the permanent disability period refers to the period following MMI. The distinction between the temporary and disability periods is important because workers’ compensation programs provide different types of cash benefits in the two periods.
The permanent disability period is the crucial period for our study of the veterans disability compensation program because we are examining the benefits provided to veterans with permanent consequences of their injuries or diseases.
The Permanent Consequences of an Injury or Disease
The study will rely on the conceptual relationship shown in Figure C-2 because this provides a useful framework for presenting the evidence on the relationship between impairment ratings and earnings losses. Figure C-2 differs from the model of disability presented in Chapter 3 of this report in two ways. First, Figure C-2 is only concerned with work disability, while the report also considers losses in quality of life, which are defined as “the consequences of an injury or disease other than work disability.” Second, Figure C-2 divides both impairment and work disability into subcomponents in order to facilitate the analysis in this study.
The concepts in Figure C-2 described below correspond to the operational measures currently used to determine the amount of cash benefits provided by workers’ compensation programs and to the outcome measure used in the research on disability programs examined in this study.
IA. Medical impairment: Anatomical loss—The American Medical Association’s (AMA’s) Guides to the Evaluation of Permanent Impairment, Fifth Edition (Cocchiarella and Andersson, 2001, hereafter referred to as the Guides) provides impairment ratings for certain medical conditions based on the anatomical loss. For example, Table 17-32 at page 545 of the Guides indicates that amputation of the leg above the knee at the midthigh is rated at 90 percent of the loss of the leg and 36 percent impairment of the whole person.
IB. Medical impairment: Functional loss—The Guides provides impairment ratings for certain medical conditions based on the extent of the functional loss. Example 16-78 at page 514 explains how to determine the rating for a person who sustained a Colles’ fracture of the right distal radius: “The factors to be rated are the loss of motion of the wrist and forearm rotation.”
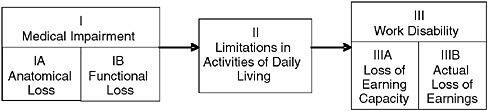
FIGURE C-2 The consequences of an injury or disease resulting in work disability.
II. Limitations in activities of daily living—These are the limitations in the activities of daily living resulting from the impairment. These can be measured by some of the questions in the SF-36. (For example, Question 8 asks if the person’s health now limits bending, kneeling, or stooping.)
IIIA. Work disability: Loss of earning capacity—This is the presumed loss of earning capacity resulting from the functional limitations. This can be measured by some of the questions in the SF-36. (For example, Question 13 asks if during the past four weeks the person cut down the amount of time spent on work or other activities as a result of his or her physical health.) The loss of earning capacity approach is used in a number of workers’ compensation programs for certain types of injuries.
IIIB. Work disability: Actual loss of earnings—This is the actual loss of earnings resulting from the injury or disease and its consequences (e.g., impairment).
The actual loss of earnings is measured by the difference between the worker’s actual earnings and the earnings the individual could have been expected to earn if he or she had not been injured (potential earnings) as shown in Figure C-3. In this example, prior to the date of injury, wages increased through time from A to B, reflecting the worker’s increasing productivity and other factors that caused wages to increase, such as inflation. At point B, the worker experiences a work-related injury that permanently reduces his or her earnings. Had the worker not been injured, his or her
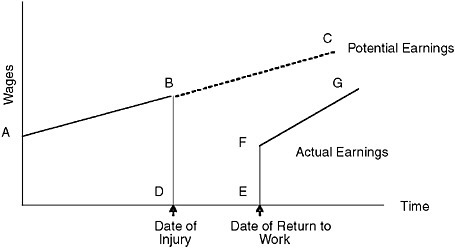
FIGURE C-3 Actual losses of earnings for a worker with a permanent disability.
earnings would have continued to grow along the line BC. The worker’s actual earnings in this example dropped from B to D and continued at this zero earnings level until point E, when the worker returned to work at wage level F. Thereafter, actual earnings grew along the line F to G. In this example, it is assumed the worker’s actual earnings never returned to the potential earnings (line BC) that he or she would have earned if the injury had not occurred. The worker’s “true” wage loss due to the injury is equal to his or her potential earnings after the date of injury (BC) minus the actual earnings after the date of injury (BDEFG).
The calculation of potential earnings (line BC) is a crucial step in the analysis. Different researchers have used different methods to estimate potential earnings. We will describe these methods in connection with the research on the two workers’ compensation programs and the veterans disability compensation program examined in this study.
The Causes of the Injury or Disease
Both workers’ compensation programs and the veterans disability compensation program provide benefits only when specified causation requirements are satisfied. For workers’ compensation, the injury or disease must be work-related, which in most states requires several legal tests to be met.2 For veterans benefits, the injury or disease must be incurred or aggravated during active military service. We assume for this study that the injuries and diseases and the resulting impairment and disability meet the causation requirements of the programs we are examining.
The distinction between causes and consequences of injuries and diseases is important. For example, work disability is a consequence of an injury or disease, but the cause may or may not be work-related. Indeed, one of our central inquiries is the relationship between injuries and diseases caused by military service and the consequences of those injuries and diseases on the loss of earnings (i.e., work disability).
The Purpose of Cash Benefits
A fundamental issue is which of the consequences of injuries and diseases shown in Figure C-2 provide the reasons or purpose of the cash benefits provided by workers’ compensation programs and by the veterans disability program.
Workers’ Compensation
The possible reasons for workers’ compensation program cash benefits were examined by Burton:
To the extent that the rationale for benefits is discernable … two schools of thought can be identified. One view considers lost wages due to the injury (work disability) as the sole justification for workers’ compensation benefits….
An alternative view of the rationale for benefits workers with permanent consequences of their injuries accepts work disability as the primary basis for benefits, but argues there is a secondary role for benefits paid for nonwork disability. Arguments for these “impairment benefits” indicate that the purpose is not only to compensate impairment per se but to also use permanent impairment as a convenient proxy for the functional limitations and nonwork disability that result from the impairment. A variant of this alternative view is to argue that nonwork disability merits compensation, and that the degree of permanent impairment serves as a proxy for the extent of nonwork disability.
The dominant view probably is that the only permanent consequences that warrant benefits in a workers’ compensation program are medical care, rehabilitation, and work disability (Burton, 2005:80).
The view that the only purpose of workers’ compensation cash benefits is to compensate for work disability is explicitly or implicitly adopted in almost all research on the program. Studies of the relationship between earnings losses and cash benefits, for example, use the entire amount of cash benefits to evaluate the performance of the system of cash benefits.3 We assume for this study that the sole purpose of cash benefits in workers’ compensation is to compensate for work disability and not for the other consequences shown in Figure C-2.
Veterans Disability Compensation Program
The statement of tasks for the IOM committee asks for an evaluation of VA’s Schedule for Rating Disabilities (Rating Schedule) and rating regulations for both quality-of-life impairment and impairment in average earning capacity. However, the sole purpose of the cash benefits specified by § 4.1 of the Code of Federal Regulations dealing with VA’s Rating Schedule is limited to work disability (as that term is used in this study):
The percentage ratings represent as far as can practicably be determined the average impairment in earning capacity resulting from such diseases and injuries and their residual conditions in civil occupations.
We assume for the purposes of this study that the sole purpose of the cash benefits provided by the VA Rating Schedule and rating regulations is to compensate for work disability and not for the other consequences of injuries and disease shown in Figure C-2.
The Operational Basis for Cash Benefits
The generally accepted view is that the sole or dominant purpose of cash benefits in workers’ compensation and in the VA disability compensation program is to compensate for work disability. Ideally, the extent of work disability would be determined by measuring each worker’s actual loss of earnings. However, it is impractical and probably inappropriate to directly measure actual loss of earnings for each worker and to determine the amount of cash benefits based on the measure of actual wage loss.4 As a result, one of the other consequences shown in Figure C-2 is used as a proxy (or predictor) of actual loss of wages.
There are several possible reasons why disability compensation programs use proxies, such as the extent of the applicant’s impairment, to provide benefits for which the purpose is actual loss of earnings. The first reason is administrative convenience: It is easier to conduct a medical examination of an applicant than to monitor the worker’s actual labor market experience over an extended period of time. The second reason is that linking benefits to actual loss of earnings may result in incentive effects for some beneficiaries, who may limit their extent of participation in the labor force if higher earnings result in reduced benefits. Despite these reasons for the use of proxies, one possible drawback is that they may not provide accurate estimates of the actual loss of earnings. We examine how well proxies predict the amount of actual wage loss in this study.
One possible objection to using the amount of actual wage loss as the test of the accuracy of the predictions of the disability rating systems is that the stated purpose of the veterans disability compensation program is average impairment in earning capacity, not the average loss of actual earnings. However, there is no meaningful test of the accuracy of the current Rating Schedule if a comparison is made between (1) the ratings produced by application of the criteria for evaluating medical conditions in the Rating Schedule and (2) the average reduction in earning capacity, since in practice
they are the same thing. The only meaningful test is whether the ratings produced by the Rating Schedule (which are estimates of the loss of earning capacity) are closely related to the actual losses of earnings.
THE 1987 STUDY OF THE WISCONSIN WORKERS’ COMPENSATION PROGRAM
The Wisconsin Workers’ Compensation Program
Berkowitz and Burton (1987) conducted a wage-loss study of Wisconsin, Florida, and California workers who were injured in 1968. The results for one of the two samples from Wisconsin are shown in Table C-1. The sample consists of male Wisconsin workers who received permanent partial disability (PPD) benefits without a legal contest.
The system of cash benefits in Wisconsin relied on several distinctions found in most (although not all) state workers’ compensation programs.5 As shown in Figure C-1, three time periods were relevant for determining benefits for workers who received PPD benefits. During the temporary disability period, most Wisconsin workers in the study qualified for temporary total disability (TTD) benefits. In 1968, the TTD benefits were 66-and-two-thirds percent of the workers’ preinjury wages, subject to a maximum weekly benefit. Once the worker reached the date of MMI, the TTD benefits stopped and most workers with permanent disabilities qualified for permanent partial disability (PPD) benefits.6
Scheduled PPD benefits were paid to workers who had an injury included in a list (or schedule) of body parts included in the Wisconsin workers’ compensation statute. The statute also specified the number of weeks of PPD benefits associated with the total loss of each body part. The complete loss of an arm, for example, entitled a worker to 400 weeks of PPD benefits. A 50 percent loss of an arm meant the worker received 200 weeks of PPD benefits.
Nonscheduled PPD benefits were paid to workers who had an injury not included in the list of body parts in the statute. The seriousness of the nonscheduled injury—typically a back condition—was rated “as the nature of the injury bears to one causing permanent total disability.” A 40 percent rating for the back was multiplied by 1,000 weeks to determine the duration of the PPD benefits.
TABLE C-1 Wisconsin Uncontested Permanent Partial Disability Cases for Men with 1968 Injuries
|
|
|
Percent Rating |
|||||||
|
|
Classification of Workers |
1–2 |
3–5 |
6–10 |
11–15 |
16–50 |
51–100 |
Mean Ratings |
Total |
|
Panel A |
Weighted counts of workers and mean disability ratings |
||||||||
|
1 |
Workers ages 20–59 |
941.0 |
467.0 |
177.0 |
52.0 |
48.0 |
|
3.70 |
1,685.0 |
|
2 |
Workers ages 20–29 |
294.0 |
105.5 |
36.0 |
15.0 |
14.0 |
|
3.54 |
464.5 |
|
3 |
Workers ages 30–39 |
226.0 |
122.0 |
39.5 |
10.0 |
14.0 |
|
3.69 |
411.5 |
|
4 |
Workers ages 40–49 |
219.5 |
140.5 |
53.5 |
11.0 |
13.0 |
|
3.68 |
437.5 |
|
5 |
Workers ages 50–59 |
201.5 |
99.0 |
48.0 |
16.0 |
7.0 |
|
3.71 |
371.5 |
|
6 |
Upper extremities |
785.0 |
192.0 |
82.0 |
20.0 |
20.0 |
|
2.80 |
1,099.0 |
|
7 |
Trunk cases |
17.0 |
93.0 |
42.0 |
10.0 |
0.0 |
|
5.83 |
162.0 |
|
8 |
Lower extremities |
120.0 |
150.0 |
34.0 |
9.0 |
4.0 |
|
3.76 |
317.0 |
|
9 |
All other cases |
19.0 |
32.0 |
19.0 |
13.0 |
24.0 |
|
9.62 |
107.0 |
|
Panel B |
Mean potential earnings (1968–1973, in dollars)a |
||||||||
|
1 |
Workers ages 20–59 |
42,567 |
43,938 |
43,320 |
42,472 |
37,960 |
|
|
42,892 |
|
2 |
Workers ages 20–29 |
40,144 |
44,412 |
38,743 |
41,693 |
32,671 |
|
|
40,829 |
|
3 |
Workers ages 30–39 |
43,641 |
46,232 |
47,880 |
52,464 |
42,605 |
|
|
44,995 |
|
4 |
Workers ages 40–49 |
45,298 |
44,383 |
48,995 |
48,364 |
41,628 |
|
|
45,414 |
|
5 |
Workers ages 50–59 |
41,925 |
39,973 |
36,673 |
32,905 |
32,434 |
|
|
40,159 |
|
6 |
Upper extremities |
42,740 |
44,084 |
41,644 |
39,699 |
35,516 |
|
|
42,706 |
|
7 |
Trunk cases |
37,364 |
44,193 |
45,224 |
44,276 |
|
|
|
43,748 |
|
8 |
Lower extremities |
42,497 |
43,123 |
43,355 |
37,036 |
37,720 |
|
|
42,670 |
|
9 |
All other cases |
40,529 |
46,136 |
46,279 |
49,113 |
40,036 |
|
|
44,159 |
|
Panel C |
Mean earnings losses (1968–1973, in dollars)a |
||||||||
|
1 |
Workers ages 20–59 |
1,554 |
2,759 |
*4,292 |
* 7,483 |
*7,175 |
|
|
*2,519 |
|
2 |
Workers ages 20–29 |
1,714 |
1,890 |
1,337 |
6,627 |
8,757 |
|
|
*2,096 |
|
3 |
Workers ages 30–39 |
3,009 |
7,595 |
*6,399 |
*13,028 |
*9,611 |
|
|
*5,162 |
|
4 |
Workers ages 40–49 |
2,822 |
954 |
4,647 |
*4,131 |
4,241 |
|
|
2,520 |
|
5 |
Workers ages 50–59 |
−1,694 |
287 |
4,379 |
7,124 |
*4,586 |
|
|
117 |
|
6 |
Upper extremities |
1,535 |
1,688 |
2,913 |
5,098 |
7,503 |
|
|
*1,838 |
|
7 |
Trunk cases |
4,583 |
5,417 |
*3,395 |
8,916 |
|
|
|
5,022 |
|
8 |
Lower extremities |
1,808 |
2,307 |
9,349 |
*11,740 |
1,984 |
|
|
3,137 |
|
9 |
All other cases |
−1,978 |
3,581 |
3,178 |
7,102 |
*7,766 |
|
|
*3,889 |
|
Panel D |
Standard deviation of mean earnings losses (1968–1973, in dollars)a |
||||||||
|
1 |
Workers ages 20–59 |
860 |
1,150 |
1,138 |
2,236 |
2,046 |
|
|
662 |
|
2 |
Workers ages 20–29 |
1,482 |
2,057 |
2,987 |
4,479 |
3,398 |
|
|
1,237 |
|
3 |
Workers ages 30–39 |
2,194 |
2,449 |
2,272 |
6,193 |
3,059 |
|
|
1,559 |
|
4 |
Workers ages 40–49 |
1,768 |
1,951 |
1,760 |
5,321 |
5,055 |
|
|
1,228 |
|
5 |
Workers ages 50–59 |
1,294 |
2,596 |
2,248 |
2,250 |
4,129 |
|
|
1,213 |
|
6 |
Upper extremities |
875 |
1,952 |
1,726 |
2,754 |
2,328 |
|
|
809 |
|
7 |
Trunk cases |
4,430 |
1,364 |
2,132 |
5,040 |
|
|
|
1,115 |
|
8 |
Lower extremities |
1,639 |
1,160 |
2,351 |
8,283 |
4,188 |
|
|
935 |
|
9 |
All other cases |
2,613 |
3,354 |
3,767 |
3,513 |
3,436 |
|
|
1,596 |
|
|
|
Percent Rating |
|||||||
|
|
Classification of Workers |
1–2 |
3–5 |
6–10 |
11–15 |
16–50 |
51–100 |
Mean Ratings |
Total |
|
Panel E |
Proportional earnings losses |
||||||||
|
1 |
Workers ages 20–59 |
0.036 |
0.063 |
0.099 |
0.176 |
0.189 |
|
|
0.059 |
|
2 |
Workers ages 20–29 |
0.043 |
0.043 |
0.035 |
0.159 |
0.268 |
|
|
0.051 |
|
3 |
Workers ages 30–39 |
0.069 |
0.164 |
0.134 |
0.248 |
0.226 |
|
|
0.115 |
|
4 |
Workers ages 40–49 |
0.062 |
0.021 |
0.095 |
0.085 |
0.102 |
|
|
0.055 |
|
5 |
Workers ages 50–59 |
−0.040 |
0.007 |
0.119 |
0.216 |
0.141 |
|
|
0.003 |
|
6 |
Upper extremities |
0.036 |
0.038 |
0.070 |
0.128 |
0.211 |
|
|
0.043 |
|
7 |
Trunk cases |
0.123 |
0.123 |
0.075 |
0.201 |
|
|
|
0.115 |
|
8 |
Lower extremities |
0.043 |
0.053 |
0.216 |
0.317 |
0.053 |
|
|
0.074 |
|
9 |
All other cases |
−0.049 |
0.078 |
0.069 |
0.145 |
0.194 |
|
|
0.088 |
|
Panel F |
Mean benefits of legal fees (1968–1973, in dollars) |
||||||||
|
1 |
Workers ages 20–59 |
696 |
2,479 |
4,957 |
7,807 |
10,980 |
|
|
2,150 |
|
2 |
Workers ages 20–29 |
742 |
2,316 |
5,078 |
8,388 |
12,846 |
|
|
2,047 |
|
3 |
Workers ages 30–39 |
626 |
2,509 |
5,451 |
7,224 |
10,286 |
|
|
2,136 |
|
4 |
Workers ages 40–49 |
706 |
2,316 |
4,999 |
7,360 |
10,327 |
|
|
2,201 |
|
5 |
Workers ages 50–59 |
696 |
2,846 |
4,412 |
7,934 |
9,851 |
|
|
2,234 |
|
6 |
Upper extremities |
593 |
2,057 |
4,503 |
6,716 |
11,641 |
|
|
1,453 |
|
7 |
Trunk cases |
1,288 |
3,141 |
5,371 |
8,410 |
|
|
|
3,850 |
|
8 |
Lower extremities |
1,261 |
2,636 |
5,803 |
10,254 |
13,537 |
|
|
2,809 |
|
9 |
All other cases |
842 |
2,348 |
4,485 |
7,326 |
10,003 |
|
|
4,782 |
Both scheduled and nonscheduled PPD beneficiaries received weekly benefits that were 66-and-two-thirds percent of the workers’ preinjury weekly wages, subject to a maximum weekly benefit. As of 1968, the ratings for both the scheduled and nonscheduled PPD benefits were based on an evaluation of medical impairment, corresponding to the extent of anatomical loss (IA) or functional loss (IB) shown in Figure C-2. In short, while the purpose of the Wisconsin PPD benefits was to compensate for work disability, in 1968 the operational approach for the benefits was to measure the extent of medical impairment and to use the rating as a proxy for work disability.
As discussed by Berkowitz and Burton (1987), Wisconsin began to base nonscheduled PPD benefits on the loss of earning capacity (corresponding to consequence IIIA in Figure C-2) beginning in the 1970s. Thus the results in this section probably would not be applicable to workers who receive PPD benefits from the current Wisconsin workers’ compensation program.
Summary of the Wisconsin Results
The male Wisconsin workers who were injured in 1968 and received PPD benefits were separated into two categories. Most workers were paid benefits without litigation or use of compromise and release (C&R) agreements. These uncontested cases are shown in Table C-1 (which corresponds to Table 10.1 in Berkowitz and Burton [1987]). Other workers were paid benefits after a contest (litigation or use of C&R agreements). The results for the contested cases are not shown in this report. Table C-1 contains seven panels of information.
Panel A. The Wisconsin uncontested cases were selected using a stratified sampling procedure that selected a higher proportion of cases in cells with fewer workers. The sample represented a total of 1,685 workers from ages 20 to 59 (line 1). The sample was placed into columns based on the permanent disability ratings and into rows corresponding to 10-year age categories (lines 2 to 5) and into rows corresponding to four locations of injury (lines 6 to 9). The numbers of the various types of injuries ranged from upper extremities (1,099) to all other cases (107). The mean disability rating for the entire sample was 3.70 percent. The mean ratings varied by age (from 3.54 percent for workers ages 20–29 to 3.71 percent for workers ages 50–59) and by location of injury (from 2.80 percent for upper extremities to 9.62 percent for all other cases).
Panel B. The potential earnings for each worker were calculated by multiplying the worker’s actual earnings in 1966–1967 by his expected earnings growth ratio (EGR). The EGR was derived from the ratio of the
actual earnings in 1968–1973 to the actual earnings in 1966–1967 of workers in the control group, as shown in Social Security earnings records.
The control group workers were matched to the injured Wisconsin workers in the sample on the basis of each worker’s sex, age in 1968, and level of actual earnings in 1966–1967. The potential earnings in Panel B correspond to the potential earnings in Figure C-3 calculated for the six years between 1968 and 1973, and represent the estimate of what the workers in the sample would have earned if they had not been injured in 1968. The mean potential earnings for all workers in the sample were $42,892. (All dollar figures in Table C-1 are in 1968 dollars.) For workers with injuries to the upper extremity rated at 1–2 percent, the mean potential earnings were $42,740.
Panel C. The actual earnings for each worker from 1968 to 1973 were determined based on Social Security earnings records. The actual earnings used to calculate the results in Panel C correspond to the actual earnings shown in Figure C-3. The actual earnings were subtracted from the potential earnings to determine the earnings losses shown in Panel C. The mean earnings losses for all workers in the sample were $2,519. For workers with injuries to the upper extremity rated at 1–2 percent, the mean earnings losses were $1,535. Of interest, there are two entries in Panel C in which the mean earnings losses are negative: The mean actual earnings exceeded the mean potential earnings for workers in those categories.
Panel D. The earnings losses varied significantly for workers in the sample of Wisconsin workers. The standard deviations (a measure of dispersion) of the mean earnings losses are shown in Panel D. The standard deviation for all workers in the sample was $662. The mean for all workers was $2,519. The ratio of the standard deviation to the mean is low enough that we can be 95 percent certain that the mean earnings losses for all workers in the sample were greater than zero. The significance at the .05 level is shown by the asterisk by the $2,519 entry in Panel C. In contrast, the standard deviation for workers with injuries to the upper extremity rated at 1–2 percent was $875, and so we cannot be 95 percent certain that the mean earnings losses of $1,535 were greater than zero. A perusal of Panel C shows that a number of entries are not significant.
Panel E. The proportional earnings losses are shown in Panel E. These figures represent the mean earnings losses in Panel C divided by the mean potential earnings in Panel B. The proportional earnings loss for all workers in the sample was 0.059 ($2,519 divided by $42,892), which means that all workers had earnings losses that were 5.9 percent of potential earnings. For workers with injuries to the upper extremities rated at 1–2 percent, the
proportional earnings loss was 0.036 ($1,535 divided by $42,740), which means that the earnings losses for workers with this type of injury were 3.6 percent of potential earnings.
Panel F. The mean workers’ compensation benefits net of legal fees are shown in Panel F. These include all temporary disability benefits as well as PPD benefits received between 1968 and 1973. The mean benefits for all workers in the sample were $2,150. For workers with injuries to the upper extremity rated at 1–2 percent, the mean benefits net of legal fees was $593.
Panel G. The replacement rates are shown in Panel G. The replacement rates are the mean benefits net of legal fees received by the Wisconsin workers between 1968 and 1973 (Panel F) divided by the mean earnings losses for these workers during those six years (Panel C). For all workers in the sample, the replacement rate was 0.85 ($2,150 divided by $2,519), which means these workers received benefits that replaced 85 percent of their earnings losses. For workers with injuries to the upper extremity rated at 1–2 percent, the replacement rate was 0.39 ($875 divided by $1,535), which means these workers received benefits that replaced 39 percent of their earnings losses. A perusal of Panel G indicates there were great variations in replacement rates, ranging from 21 percent for workers ages 30–39 with injuries rated at 1–2 percent to 991 percent for workers ages 50–59 with injuries rated at 3–5 percent. There were also two entries (shown in Panel G with “b”) where the workers in the category received workers’ compensation benefits but on average had no earnings losses.
The Wisconsin Disability Rating System and Equity
Background on the Equity Criteria
The concepts of horizontal and vertical equity have a long history in the public finance literature. Musgrave provides an example:
A proper definition of income is important, not only to establish equity in a vertical sense—that is, to plan taxes and transfers so as to adjust relative positions; it is important also to establish equity in a horizontal sense— that is, to give equal treatment to people in equal positions (Musgrave, 1959:20).
The equity criteria were used to evaluate a disability benefits program in The Report of the National Commission on State Workmen’s Compensation Laws:
equitable: delivering benefits and services fairly as judged by the program’s consistency in providing equal benefits or services to workers in identical circumstances and its rationality in providing benefits and services in proportion to the impairment or disability for those with different degrees of loss (The National Commission, 1972:137).
We expand the use of the horizontal and vertical equity criteria to evaluate the performance of the rating system used to provide benefits to people who experience loss of earnings as a result of injuries or diseases.7 The balance of this section discusses a series of figures derived from the information in Table C-1 pertaining to the Wisconsin workers’ compensation program. (The figures transform the proportions in Table C-1 into percentages in order to expedite exposition.)
Vertical Equity for Ratings
The data in Figure C-4 can be used to explain vertical equity. Vertical equity requires that actual wage losses increase in proportion to the increase in disability ratings. In this instance, there is reasonably good vertical equity in the ratings of the upper extremity injuries. With the exception of the lowest and highest disability category, the percentage earnings losses are close to the midpoint of the corresponding category of disability ratings. For example, workers with disability ratings of 11–15 percent experienced 12.8 percent earnings losses.8
Intra-Injury Horizontal Equity for Ratings
Intra-injury horizontal equity for ratings requires that the actual wage losses for workers with the same disability ratings and the same type of injury should be the same or similar. The data for upper extremities shown in Figure C-5 indicates there are substantial variations in earnings losses for these workers with the same disability ratings. The entries include the mean amount of earnings losses for workers in each rating category, plus the earnings losses associated with plus or minus two times the standard deviation for the earnings losses. As can be seen, the range of earnings losses contains some workers who had negative earnings losses in the six years after their
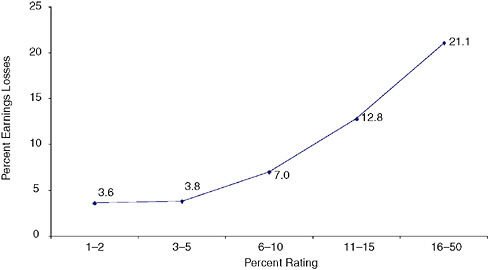
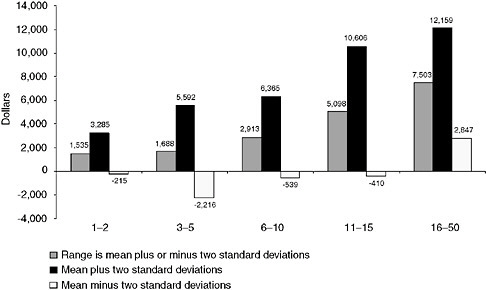
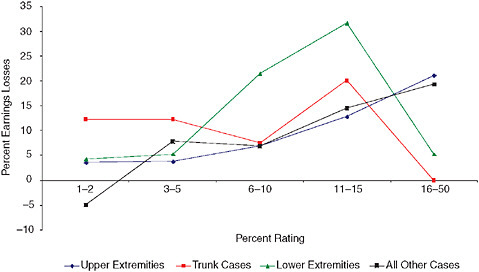
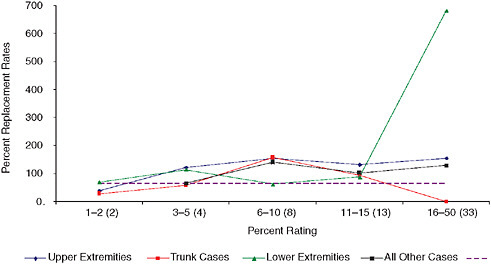
FIGURE C-6 Percentage earnings losses for Wisconsin workers with four types of injuries.
injuries.9 Indeed, the earnings losses are only statistically significantly different than zero for workers with injuries of the upper extremities with ratings of 16–50 percent.
One “lesson” of Figure C-5 in conjunction with Panels C and D of Table C-1 is that the Wisconsin workers’ compensation program did a reasonably good job on vertical equity for upper extremity cases when the emphasis is placed on mean values of losses, but that the program did not do as well on intra-injury horizontal equity, as shown by the considerable variability in lost wages for workers with similar disability ratings.
The relationships between disability ratings and earnings losses for four types of injuries are shown in Figure C-6.
Inter-Injury Horizontal Equity for Ratings
Inter-injury horizontal equity for ratings requires that the actual wage losses for workers with the same disability ratings, but different types of injuries, should be the same or similar. However, the results in Figure C-6 suggest there are significant differences among the types of injuries in the relationships between disability ratings and lost earnings. For example,
for workers with disability ratings of 11 to 15 percent, earnings losses ranged from 31.7 percent for lower extremities to 12.8 percent for upper extremities.
Vertical Equity for Ratings—Revisited
Figure C-6 is also useful in illustrating the challenges of achieving vertical equity for particular types of injuries. As shown earlier in Figure C-4, there is a reasonably close relationship between higher ratings for workers with upper extremity injuries and higher earnings losses. However, the data in Figure C-6 “tell” a somewhat different story. For two types of injuries (upper extremities and all other cases), earnings losses generally increase with higher disability ratings. However, for trunk cases and lower extremities, earnings losses are much lower for workers in the most serious rating category than in most of the categories with lower disability ratings.
Vertical Equity for Ratings—Revisited Again!
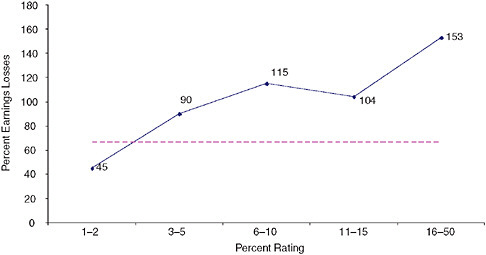
Shall we look at the trees (represented by Figures C-5 and C-6) or the forest (represented by Figure C-7)? As shown in Figure C-7, for all Wisconsin workers, there is a very close relationship between rating categories and percentage earnings losses. The dashed line represents an exact correspondence between ratings and losses (for example, an 8 percent disability rating equals an 8 percent earnings loss). At this level of aggregation, the Wisconsin rating system does an excellent job of providing vertical equity.
The Wisconsin Replacement Rates and Adequacy
It is useful to separate the analysis of the ability of the rating system to predict earnings losses from the analysis of the ability of the compensation system to replace an appropriate portion of lost earnings with benefits. It is possible, for example, that the rating system does an excellent job in predicting earnings losses, but that the design or implementation of the benefit system results in a poor match between benefits and lost wages. The next set of figures looks at the equity and adequacy of the Wisconsin workers’ compensation benefits for workers with PPD benefits.
Background on the Adequacy Criterion
There is also a long history of the use of the adequacy criterion to assess social insurance programs, including those providing benefits to persons with disabilities. One possible standard is the Social Adequacy Model, which requires that benefits provide at least enough income to assume the
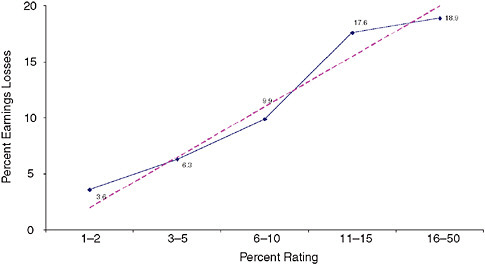
FIGURE C-7 Percentage earnings losses for all Wisconsin workers.
beneficiary is not living in poverty (Hunt, 2004). Other standards rely on replacement rates, which represent the proportion of lost wages replaced by the cash benefits from a program.
The National Commission argued that workers’ compensation should replace a substantial proportion of the worker’s lost income.
Replacement of a substantial proportion is justified by a feature of workmen’s compensation which distinguishes the program from other forms of social insurance. In exchange for the benefits of workers compensation, workers renounced their right to seek redress for economic damages and pain and suffering under the common law. In no other social insurance program, such as Social Security or unemployment compensation, did workers surrender any right of value in exchange for benefits (The National Commission, 1972:36).
The generally accepted standard of adequacy for workers’ compensation is that the benefits should replace two-thirds of lost wages (Hunt, 2004). This replacement rate, which is shown by the horizontal line 66.67 percent in Figures C-8 to C-10, can be used to assess the adequacy of benefits provided by the Wisconsin workers’ compensation program for workers receiving permanent partial disability benefits. One meaning of adequacy is to consider the replacement rate for the entire sample of injured workers. In Wisconsin, cash benefits replaced 85 percent of earnings losses for the entire sample, as shown in Panel G of Table C-1, which clearly met the adequacy test.
The Wisconsin Replacement Rates and Equity
Vertical Equity for Benefits
The data in Figures C-8 through C-10 can also be used to examine vertical equity of the PPD benefits. Vertical equity requires that the same proportion of lost wages should be replaced for workers at all disability ratings. (This definition is refined in the next paragraph.) In Figure C-8, there is fairly good vertical equity for the benefits for upper extremity injuries. The least serious category (1–2 percent ratings) has a replacement rate of only 39 percent, but the other categories have replacement rates that are within the range of 122 to 155 percent. The results for the four types of injuries in Figure C-9 suggest that there was a reasonable degree of vertical equity for the four lowest rating categories, but there were serious equity problems for the highest rating category.
Vertical Equity for Benefits—Revisited
Vertical equity has two possible meanings. A narrow view asserts that all levels of severity should have the same proportion of earnings losses replaced by benefits. An alternative view is that more serious injuries should have a higher replacement rate. Those who subscribe to the alternative view can take some comfort from Figure C-10, which indicates the Wisconsin
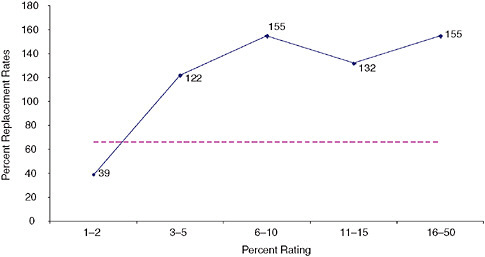
FIGURE C-8 Replacement rates (benefits as a percentage of earnings losses) for Wisconsin workers with upper extremity injuries.
workers’ compensation program was in general replacing a higher proportion of earnings loss for workers with more serious disability ratings.
Inter-Injury Horizontal Equity for Benefits
Inter-injury horizontal equity for benefits requires that the replacement rates for workers with the same disability ratings and different types of injuries should be the same or similar. The results in Figure C-9 suggest there are significant differences among the types of injuries concerning the relationships between benefits and lost earnings.
Observations on the Wisconsin Results
-
It is important to distinguish between the ability of the disability rating system to accurately predict earnings losses (discussed in entries 2 through 5 below) and the ability of the benefit system to match benefits to earnings losses (discussed in entries 6 through 8). These are related, but different, matters. The former is of greater interest for this study because an assessment of the accuracy of the disability ratings produced by the VA Rating Schedule is part of the assignment for the IOM committee for which this study is being prepared.
-
At the most aggregate level—the entire sample of Wisconsin workers—the Wisconsin rating system did an excellent job of providing vertical equity. As shown in Figure C-7, there is a close correspondence between higher disability ratings and greater earnings losses.
-
When the Wisconsin sample is separated into the four injury types, the Wisconsin rating system does not do as well in terms of vertical equity. As shown in Figure C-6, the earnings losses generally increase with higher ratings for two types of injuries, but there are serious problems with vertical equity for two other types of injuries.
-
There are also serious problems with the Wisconsin rating system in terms of inter-injury horizontal equity. As shown in Figure C-6, there are significant differences among the four types of injuries in the relationships between disability ratings and lost earnings.
-
There are also serious problems with the Wisconsin rating system in terms of intra-injury horizontal equity. As shown in Figure C-5 (and in Panels C and D of Table C-1), with cells defined by injury type (or age) and percent rating, there are large variations in earnings losses among different workers.
-
The Wisconsin cash benefits system met the generally accepted test of adequacy, since the average replacement rate for the entire sample was more than 66.67 percent.
-
The Wisconsin rating system did a fairly good job of providing vertical equity for benefits. As shown in Figure C-9, the replacement rates generally were roughly the same for workers with different ratings for the same injury (although there were some important exceptions).
-
Finally, the Wisconsin benefit system had serious problems with inter-injury horizontal equity. As shown in Figure C-9, there were significant differences among the types of injuries concerning the relationships between benefits and lost earnings.
A CURRENT STUDY OF THE CALIFORNIA WORKERS’ COMPENSATION PROGRAM
The California Worker’s Compensation Program
The workers’ compensation programs in California and several other states have been examined in a series of studies conducted by the RAND Corporation in recent years.10 Boden et al. (2005) provide a summary of the results for California, New Mexico, Oregon, Washington, and Wisconsin. Reville et al. (2005) examined various aspects of the California program for permanent disability rating system; we rely on material from that study. We produced new empirical results for this study involving workers who were injured between January 1, 1991, and December 31, 1993, and who received permanent partial disability benefits in California.11
The California workers’ compensation benefit system applicable to the workers in this study had some similarities to the Wisconsin workers compensation program described in the previous section. California used different benefit formulae during the temporary disability period and the permanent disability period (Figure C-1). During the temporary disability period, most California workers in the study qualified for TTD benefits, which were 66-and-two-thirds percent of the worker’s preinjury wages, subject to a maximum weekly benefit. Once the worker reached the date of MMI, the TTD benefits stopped and most California workers with permanent disabilities qualified for PPD benefits. The weekly benefit for PPD
was 66-and-two-thirds percent of the worker’s preinjury wages, subject to a maximum weekly benefit. These attributes of the California system were basically the same as in Wisconsin.
There were also significant differences between the PPD benefits in California and Wisconsin. In Wisconsin, a distinction was made between scheduled injuries (those involving injuries to body parts listed in the workers’ compensation statute) and unscheduled injuries (those involving injuries to other body parts, such as backs), whereas in California all injuries were rated using a rating schedule adopted by the administrative director of the Division of Workers’ Compensation.
Another major distinction between the states pertained to the basis for the permanent disability ratings.12 In Wisconsin, both the scheduled and nonscheduled injuries were rated based on an evaluation of medical impairment, corresponding to the extent of anatomical loss (IA) or functional loss (IB) shown in Figure C-2. In California, there were several sets of criteria that could be used to apply the “standard rating” for permanent disabilities. Objective factors roughly corresponded to IA or IB in Figure C-2, and were largely based on information the rating physician could directly observe or measure. Subjective factors could be based on the worker’s description of the severity or frequency of pain and the resulting limitations on his or her ability to perform various activities. Such subjective factors roughly correspond to IB or limitations in activities of daily living (II) in Figure C-2. Work-capacity Guidelines were developed to rate spines and then were extended to other medical conditions. The guidelines in part correspond to II in Figure C-2 (“contemplates the individual has lost approximately half of his pre-injury capacity for performing such activities as bending, stooping, lifting”). The guidelines in part also correspond to loss of earning capacity (IIIA) in Figure C-2 (“disability precluding heavy work”).
An additional complication of the California permanent disability rating system is that the objective factors, subjective factors, and work-capacity guidelines were not mutually exclusive categories. Rather, it was quite common for an injury to have rating factors from more than one category, such as an injury to the wrist that causes immobility plus pain. Finally, a distinctive attribute of the California rating system is that the standard rating was modified on the basis of the individual worker’s age and occupation. The ultimate basis for the rating was provided in the workers’ compensation statute: namely, “the diminished ability of such injured employee to compete in an open labor market.” In essence, the California rating system used measurements of a variety of consequences of an injury or disease to
serve as proxies or predictors of the loss of earning capacity and/or actual loss of earnings.
The California rating system for permanent disabilities was significantly changed in 2004, subsequent to the period when the injuries analyzed in this section occurred. One significant change was the adoption of the Guides as the basis for rating permanent impairments. Therefore, the results in this section likely would not be applicable to workers who receive PPD benefits from the current California workers’ compensation program.
Summary of the California Results
The California workers who were injured between 1991 and 1993 and who received PPD benefits were classified into 21 impairment categories based on the California permanent disability rating system, which are shown in Table C-2.
There are four panels of data for California, which roughly correspond to four of the seven panels of data presented for Wisconsin. There are no California data on the standard deviation of mean earnings losses corresponding to Panel D in the Wisconsin data in Table C-1. In addition, the only benefits data readily available for California are confined to PPD benefits and do not include temporary disability benefits, as in Wisconsin, and so there are no Panels F and G in Table C-2. Because we lack data on all types of cash benefits, we will not evaluate the adequacy and equity of the California cash benefits.
Panel A. There are 78,696 California PPD cases shown in Table C-2.
Panel B. The potential earnings for each worker were determined by matching the injured worker to a control group, which consisted of other workers in the same firm who had similar earnings in the four quarters prior to the date of injury and who did not experience workplace injuries.13 The uninjured workers’ actual earnings in the five years after the date of injury as recorded in the California unemployment insurance database correspond to the potential earnings shown in Figure C-3. For workers with injuries that resulted in general lower extremity impairments rated at 1 to 5 percent, the mean potential earnings for the five years were $222,772. (The figures are in 2003 dollars discounted to the present value of the potential earnings at the date of injury.14)
TABLE C-2 California Permanent Partial Disability Cases
|
|
|
Percent Rating |
||||||||
|
|
Classification of Workers |
1–5 |
6–10 |
11–15 |
16–20 |
21–25 |
26–50 |
51–100 |
Mean Ratings |
Total |
|
Panel A |
Counts of workers |
|||||||||
|
1 |
General lower extremity impairment |
299 |
134 |
152 |
136 |
117 |
147 |
65 |
18.7 |
1,050 |
|
2 |
Hip impairment |
65 |
44 |
44 |
17 |
26 |
42 |
25 |
20.6 |
263 |
|
3 |
Knee impairment |
2,549 |
1,500 |
1,313 |
843 |
690 |
825 |
206 |
14.6 |
7,926 |
|
4 |
Ankle impairment |
988 |
473 |
335 |
253 |
134 |
218 |
100 |
13.7 |
2,501 |
|
5 |
Impaired function in toe(s) |
196 |
35 |
23 |
23 |
11 |
13 |
10 |
9.4 |
311 |
|
6 |
Vision impairment |
93 |
22 |
12 |
8 |
28 |
7 |
1 |
10.2 |
171 |
|
7 |
Hearing impairment |
732 |
255 |
227 |
103 |
74 |
62 |
79 |
11.0 |
1,532 |
|
8 |
Hand/fingers |
2,322 |
615 |
507 |
233 |
102 |
273 |
17 |
8.7 |
4,069 |
|
9 |
Loss of grasping power |
1,721 |
2,421 |
1,167 |
771 |
234 |
511 |
85 |
11.3 |
6,910 |
|
10 |
Chronic lung impairment |
19 |
68 |
9 |
13 |
4 |
15 |
16 |
20.4 |
144 |
|
11 |
Heart disease |
6 |
34 |
26 |
43 |
10 |
64 |
47 |
32.0 |
230 |
|
12 |
General impairment to shoulder or arm |
895 |
886 |
1,187 |
621 |
272 |
1,003 |
75 |
17.9 |
4,939 |
|
13 |
Impaired function in shoulder |
1,808 |
1,023 |
930 |
410 |
109 |
106 |
14 |
9.8 |
4,400 |
|
14 |
Impaired function in elbow |
760 |
388 |
292 |
107 |
43 |
59 |
1 |
9.3 |
1,650 |
|
15 |
Impaired function in wrist |
1,244 |
711 |
716 |
334 |
115 |
437 |
18 |
13.0 |
3,575 |
|
16 |
Impaired function of neck, spine, or pelvis |
3,414 |
4,664 |
4,771 |
3,290 |
3,534 |
4,572 |
687 |
19.6 |
24,932 |
|
17 |
General impairment to abdomen |
57 |
77 |
41 |
37 |
16 |
33 |
10 |
17.3 |
271 |
|
18 |
Psychiatric impairment |
135 |
201 |
162 |
108 |
49 |
181 |
77 |
22.2 |
913 |
|
19 |
Posttraumatic head syndrome |
6 |
18 |
9 |
17 |
1 |
17 |
4 |
24.4 |
72 |
|
20 |
Headaches |
70 |
18 |
8 |
2 |
2 |
3 |
1 |
7.7 |
104 |
|
21 |
Other |
155 |
82 |
41 |
17 |
14 |
20 |
13 |
13.6 |
342 |
|
22 |
Multiple impairments |
478 |
1,310 |
1,765 |
1,679 |
1,381 |
4,266 |
1,512 |
27.9 |
12,391 |
|
23 |
Total |
18,012 |
14,979 |
13,737 |
9,065 |
6,966 |
12,874 |
3,063 |
17.6 |
78,696 |
|
Panel B |
Mean potential earnings (5 years in dollars) |
|||||||||
|
1 |
General lower extremity impairment |
222,772 |
212,342 |
201,888 |
191,640 |
210,192 |
193,088 |
173,165 |
|
205,757 |
|
2 |
Hip impairment |
216,122 |
222,054 |
186,194 |
255,052 |
202,375 |
172,636 |
152,215 |
|
200,246 |
|
3 |
Knee impairment |
248,030 |
226,808 |
219,113 |
225,184 |
221,475 |
206,545 |
181,574 |
|
228,436 |
|
4 |
Ankle impairment |
213,040 |
210,958 |
225,356 |
183,737 |
213,007 |
183,213 |
159,130 |
|
206,574 |
|
5 |
Impaired function in toe(s) |
226,615 |
171,619 |
250,608 |
158,705 |
165,986 |
187,296 |
302,528 |
|
215,831 |
|
6 |
Vision impairment |
179,462 |
163,693 |
182,941 |
152,001 |
214,175 |
173,203 |
907,883 |
|
186,080 |
|
7 |
Hearing impairment |
327,325 |
298,036 |
286,521 |
300,473 |
322,791 |
263,565 |
342,879 |
|
312,602 |
|
8 |
Hand/fingers |
209,404 |
212,214 |
192,877 |
201,203 |
181,845 |
188,842 |
173,162 |
|
205,078 |
|
9 |
Loss of grasping power |
202,594 |
197,372 |
184,260 |
182,303 |
171,652 |
187,648 |
206,208 |
|
193,295 |
|
10 |
Chronic lung impairment |
209,446 |
187,187 |
172,809 |
236,983 |
161,239 |
199,785 |
216,351 |
|
197,553 |
|
|
|
Percent Rating |
||||||||
|
|
Classification of Workers |
1–5 |
6–10 |
11–15 |
16–20 |
21–25 |
26–50 |
51–100 |
Mean Ratings |
Total |
|
11 |
Heart disease |
230,212 |
321,699 |
386,182 |
296,066 |
441,916 |
320,496 |
271,779 |
|
316,501 |
|
12 |
General impairment to shoulder or arm |
221,518 |
212,543 |
192,945 |
186,673 |
179,654 |
186,235 |
160,057 |
|
198,256 |
|
13 |
Impaired function in shoulder |
229,916 |
218,578 |
224,585 |
191,834 |
177,413 |
201,546 |
181,857 |
|
220,468 |
|
14 |
Impaired function in elbow |
244,375 |
236,635 |
217,595 |
217,276 |
211,776 |
187,296 |
25,710 |
|
233,035 |
|
15 |
Impaired function in wrist |
196,603 |
204,600 |
191,931 |
187,747 |
173,689 |
195,437 |
205,847 |
|
195,597 |
|
16 |
Impaired function of neck, spine, or pelvis |
211,659 |
201,228 |
198,319 |
193,793 |
186,691 |
181,240 |
185,695 |
|
194,965 |
|
17 |
General impairment to abdomen |
298,018 |
283,966 |
202,290 |
252,706 |
351,237 |
173,110 |
219,259 |
|
258,382 |
|
18 |
Psychiatric impairment |
252,582 |
203,768 |
209,605 |
199,731 |
233,809 |
215,352 |
231,894 |
|
217,825 |
|
19 |
Posttraumatic head syndrome |
109,461 |
133,884 |
254,696 |
199,530 |
199,818 |
132,797 |
215,269 |
|
167,631 |
|
20 |
Headaches |
171,730 |
216,163 |
215,627 |
66,244 |
70,903 |
136,991 |
221,950 |
|
178,310 |
|
21 |
Other |
222,476 |
172,208 |
268,260 |
352,335 |
194,575 |
211,438 |
218,442 |
|
220,426 |
|
22 |
Multiple impairments |
232,058 |
205,536 |
191,462 |
193,938 |
188,114 |
184,851 |
190,298 |
|
192,060 |
|
23 |
Total |
224,315 |
209,364 |
202,352 |
197,457 |
192,891 |
187,224 |
193,817 |
|
204,505 |
|
Panel C |
Mean earnings losses (5 years in dollars) |
|||||||||
|
1 |
General lower extremity impairment |
33,533 |
35,278 |
37,981 |
51,788 |
68,946 |
85,767 |
82,942 |
|
51,081 |
|
2 |
Hip impairment |
39,905 |
55,351 |
37,400 |
114,564 |
76,527 |
32,562 |
76,796 |
|
52,850 |
|
3 |
Knee impairment |
37,506 |
33,523 |
44,222 |
55,132 |
75,147 |
81,495 |
103,220 |
|
49,303 |
|
4 |
Ankle impairment |
27,987 |
29,882 |
54,860 |
35,299 |
67,201 |
63,883 |
72,010 |
|
39,675 |
|
5 |
Impaired function in toe(s) |
32,144 |
27,913 |
73,854 |
−7,694 |
31,962 |
90,456 |
174,570 |
|
38,817 |
|
6 |
Vision impairment |
1,518 |
27,353 |
24,981 |
−31,339 |
50,294 |
81,007 |
769,050 |
|
20,680 |
|
7 |
Hearing impairment |
97,275 |
105,490 |
106,834 |
134,188 |
147,299 |
112,385 |
126,603 |
|
107,081 |
|
8 |
Hand/fingers |
30,674 |
40,465 |
47,015 |
53,352 |
62,070 |
76,110 |
117,422 |
|
39,687 |
|
9 |
Loss of grasping power |
29,904 |
35,871 |
46,702 |
48,068 |
49,262 |
72,625 |
83,994 |
|
41,338 |
|
10 |
Chronic lung impairment |
53,569 |
62,087 |
14,616 |
49,687 |
−41,265 |
51,094 |
151,581 |
|
62,804 |
|
11 |
Heart disease |
54,910 |
80,954 |
62,862 |
135,073 |
222,307 |
131,962 |
191,720 |
|
131,322 |
|
12 |
General impairment to shoulder or arm |
41,267 |
47,078 |
51,570 |
60,893 |
58,731 |
74,778 |
89,442 |
|
55,752 |
|
13 |
Impaired function in shoulder |
41,217 |
56,103 |
74,430 |
65,240 |
64,813 |
94,681 |
94,728 |
|
55,980 |
|
14 |
Impaired function in elbow |
43,771 |
48,292 |
59,764 |
49,634 |
72,154 |
54,021 |
9,145 |
|
49,130 |
|
15 |
Impaired function in wrist |
30,876 |
48,626 |
44,769 |
51,796 |
46,014 |
69,838 |
107,651 |
|
44,779 |
|
16 |
Impaired function of neck, spine, or pelvis |
34,857 |
37,488 |
46,577 |
50,187 |
58,597 |
67,237 |
103,985 |
|
50,822 |
|
17 |
General impairment to abdomen |
106,332 |
96,965 |
45,454 |
121,247 |
165,557 |
53,324 |
120,402 |
|
94,057 |
|
|
|
Percent Rating |
||||||||
|
|
Classification of Workers |
1–5 |
6–10 |
11–15 |
16–20 |
21–25 |
26–50 |
51–100 |
Mean Ratings |
Total |
|
18 |
Psychiatric impairment |
114,519 |
107,346 |
105,382 |
103,634 |
136,278 |
146,619 |
189,275 |
|
123,867 |
|
19 |
Posttraumatic head syndrome |
60,075 |
17,161 |
86,519 |
53,981 |
−75,641 |
85,629 |
200,984 |
|
63,190 |
|
20 |
Headaches |
39,739 |
66,326 |
98,959 |
−32,016 |
50,423 |
20,066 |
−12,946 |
|
46,647 |
|
21 |
Other |
41,070 |
13,888 |
38,994 |
170,609 |
61,545 |
114,093 |
152,655 |
|
50,093 |
|
22 |
Multiple impairments |
54,613 |
41,508 |
39,885 |
57,043 |
57,888 |
74,409 |
104,045 |
|
64,671 |
|
23 |
Total |
38,687 |
42,198 |
49,856 |
55,293 |
62,038 |
73,530 |
106,482 |
|
53,623 |
|
Panel E |
Proportional earnings losses |
|||||||||
|
1 |
General lower extremity impairment |
0.15 |
0.17 |
0.19 |
0.27 |
0.33 |
0.44 |
0.48 |
|
0.25 |
|
2 |
Hip impairment |
0.18 |
0.25 |
0.20 |
0.45 |
0.38 |
0.19 |
0.50 |
|
0.26 |
|
3 |
Knee impairment |
0.15 |
0.15 |
0.20 |
0.24 |
0.34 |
0.39 |
0.57 |
|
0.22 |
|
4 |
Ankle impairment |
0.13 |
0.14 |
0.24 |
0.19 |
0.32 |
0.35 |
0.45 |
|
0.19 |
|
5 |
Impaired functionin toe(s) |
0.14 |
0.16 |
0.29 |
−0.05 |
0.19 |
0.48 |
0.58 |
|
0.18 |
|
6 |
Vision impairment |
0.01 |
0.17 |
0.14 |
−0.21 |
0.23 |
0.47 |
0.85 |
|
0.11 |
|
7 |
Hearing impairment |
0.30 |
0.35 |
0.37 |
0.45 |
0.46 |
0.43 |
0.37 |
|
0.34 |
|
8 |
Hand/fingers |
0.15 |
0.19 |
0.24 |
0.27 |
0.34 |
0.40 |
0.68 |
|
0.19 |
|
9 |
Loss of grasping power |
0.15 |
0.18 |
0.25 |
0.26 |
0.29 |
0.39 |
0.41 |
|
0.21 |
|
10 |
Chronic lung impairment |
0.26 |
0.33 |
0.08 |
0.21 |
−0.26 |
0.26 |
0.70 |
|
0.32 |
|
11 |
Heart disease |
0.24 |
0.25 |
0.16 |
0.46 |
0.50 |
0.41 |
0.71 |
|
0.41 |
|
12 |
General impairment to shoulder or arm |
0.19 |
0.22 |
0.27 |
0.33 |
0.33 |
0.40 |
0.56 |
|
0.28 |
|
13 |
Impaired function in shoulder |
0.18 |
0.26 |
0.33 |
0.34 |
0.37 |
0.47 |
0.52 |
|
0.25 |
|
14 |
Impaired function in elbow |
0.18 |
0.20 |
0.27 |
0.23 |
0.34 |
0.29 |
0.36 |
|
0.21 |
|
15 |
Impaired function in wrist |
0.16 |
0.24 |
0.23 |
0.28 |
0.26 |
0.36 |
0.52 |
|
0.23 |
|
16 |
Impaired function of neck, spine, or pelvis |
0.16 |
0.19 |
0.23 |
0.26 |
0.31 |
0.37 |
0.56 |
|
0.26 |
|
17 |
General impairment to abdomen |
0.36 |
0.34 |
0.22 |
0.48 |
0.47 |
0.31 |
0.55 |
|
0.36 |
|
18 |
Psychiatric impairment |
0.45 |
0.53 |
0.50 |
0.52 |
0.58 |
0.68 |
0.82 |
|
0.57 |
|
19 |
Posttraumatic head syndrome |
0.55 |
0.13 |
0.34 |
0.27 |
−0.38 |
0.64 |
0.93 |
|
0.38 |
|
20 |
Headaches |
0.23 |
0.31 |
0.46 |
−0.48 |
0.71 |
0.15 |
−0.06 |
|
0.26 |
|
21 |
Other |
0.18 |
0.08 |
0.15 |
0.48 |
0.32 |
0.54 |
0.70 |
|
0.23 |
|
22 |
Multiple impairments |
0.24 |
0.20 |
0.21 |
0.29 |
0.31 |
0.40 |
0.55 |
|
0.34 |
|
23 |
Total |
0.17 |
0.20 |
0.25 |
0.28 |
0.32 |
0.39 |
0.55 |
|
0.26 |
Panel C. The actual earnings for each injured worker in the five years after the date of injury were determined based on California unemployment insurance earnings records. These actual earnings correspond to the actual earnings shown in Figure C-3. The actual earnings were subtracted from the potential earnings to determine the earnings losses shown in Panel C. For workers with injuries that resulted in general lower extremity impairments rated at 1 to 5 percent, the mean earnings losses for the five years were $33,533.15 Of interest, there were five entries in Panel C in which the mean earnings losses are negative: The mean actual earnings exceeded the mean potential earnings for workers in those categories.
Panel D. There are no data on the standard deviation of the earnings losses for California workers; therefore, this panel is missing in Table C-2.
Panel E. The proportional earnings losses are shown in Panel E. These figures represent the mean earnings losses in Panel C divided by the mean potential earnings in Panel B. For workers with injuries that resulted in general lower extremity impairments rated at 1 to 5 percent, the proportional earnings loss was 0.15 ($33,533 divided by $222,772), which means these workers experienced earnings losses that were 15 percent of potential earnings.
The California Disability Rating System and Equity
The results from the study of California workers can be used to illustrate the use of the equity criterion to evaluate the performance of a system providing benefits to persons experiencing loss of earnings as a result of injuries or diseases. The balance of this section discusses a series of figures derived from the information in Table C-2. (The figures transform the proportions in Table C-2 into percentages in order to expedite exposition.) We have selected eight medical conditions from Table C-2 for this discussion.
Vertical Equity for Ratings
The data in Figures C-11 and C-12 can be used to evaluate vertical equity. Vertical equity requires that actual wage losses increase in proportion to the increases in disability ratings. There are some conditions for which earnings losses consistently increase as the permanent disability rating increases. These are condition 1 (general lower extremity impairment) and condition 3 (knee impairment) in Figure C-11, and condition 12
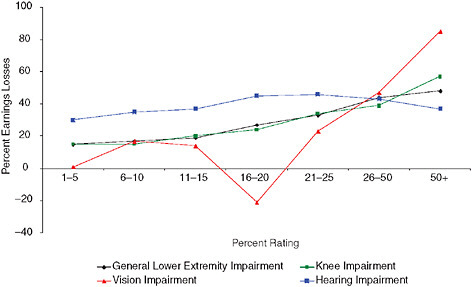
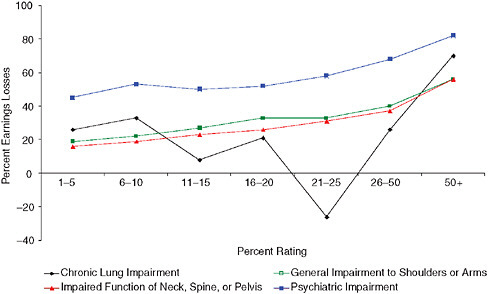
(general impairment to shoulder or arm) and 16 (impaired function of neck, spine, or pelvis) in Figure C-12. With one or two exceptions, the earnings losses increase with higher disability ratings for condition 6 (vision impairment) and condition 7 (hearing impairment) in Figure C-11 and condition 18 (psychiatric impairment) in Figure C-12. (The vertical equity for psychiatric impairment must be qualified, however, since workers with a 1 to 5 percent rating experienced a 45 percent loss of earnings, which increases very little until the condition receives a disability rating of at least 21 percent.) The condition for which vertical equity for ratings is clearly lacking is condition 10 (chronic lung impairment) in Figure C-12.
Vertical Equity for Ratings—Revisited
Shall we look at the trees (represented by Figures C-11 and C-12) or the forest (represented by Figure C-13)? As shown in Figure C-13, for all California workers, there is a monotonic relationship between rating categories and percentage earnings losses: They consistently increase together. However, the magnitudes of the ratings and the losses are not particularly close. The dashed line represents an exact correspondence between ratings and losses (for example, an 8 percent disability rating equals an 8 percent earnings loss). For the three lowest rating categories, earnings losses clearly exceed the ratings, while for the 21–25 and 26–50 percent rating categories, the earnings losses are clearly less than the ratings. At this level of aggrega-
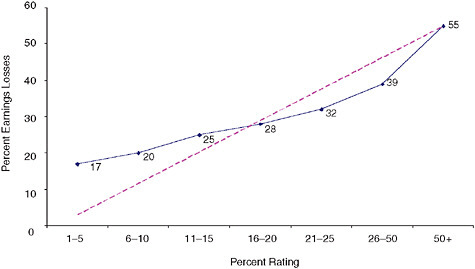
FIGURE C-13 Percentage earnings losses for all California workers.
tion, the California rating system does a moderately good job of providing vertical equity.
Intra-Injury Horizontal Equity for Ratings
Intra-injury horizontal equity for ratings requires that the actual wage losses for workers with the same disability ratings and the same type of injury should be the same or similar. This test cannot be used for the California workers’ compensation program because we lack information on the extent of variation within each cell (which is why Table C-2 does not contain Panel D).
Inter-Injury Horizontal Equity for Ratings
Inter-injury horizontal equity for ratings requires that the actual wage losses for workers with the same disability ratings and different types of injuries should be the same or similar. The results in Figures C-11 and C-12 suggest there are significant differences among the types of injuries concerning the relationships between ratings and lost earnings. For example, for the five lowest rating categories, hearing impairment (condition 7) has the highest earnings losses for each rating category in Figure C-11, and without exception, psychiatric impairment has the highest earnings losses for each rating category in Figure C-12.
Observations on the California Results
-
We confine our observations to the ability of the disability rating system to accurately predict earnings losses, because we do not have the data necessary to assess the ability of the benefit system to match benefits to earnings losses.
-
We have data on disabled workers with 22 medical conditions, which constitute a significant portion, but not the universe, of California workers who received permanent partial disability benefits during the years covered by our study.
-
At the most aggregate level—the total experience of workers with all 22 conditions—the California rating system did a moderately good job of providing vertical equity. As shown in Figure C-13, the earnings losses increase monotonically with higher disability ratings, but the correspondence between the magnitudes of the disability ratings and the earnings losses is far from perfect. For lower disability ratings, the earnings losses are much higher than the ratings.
-
We selected eight medical conditions for particular scrutiny and, at this level, the California system also does a moderately good job of providing vertical equity. As shown in Figures C-11 and C-12, earnings losses generally increase with higher ratings for most medical conditions, but there are serious vertical equity problems for two conditions.
-
There are serious problems with the California rating system in terms of inter-injury horizontal equity. As shown in Figures C-11 and C-12, there are significant differences among the eight types of injuries in the relationships among disability ratings and lost earnings.
-
As previously noted, the results in this section involve injuries that occurred well before the 2004 reforms to the California workers’ compensation program. These reforms introduced a new method for rating the severity of permanent disability, beginning with the use of the Guides. However, the new disability rating system continued to use proxies to predict the loss of earning capacity or actual loss of earnings. A distinctive feature of the new California system is a provision designed to incorporate empirical data on wage losses into revisions of the permanent disability rating system in order to reduce the types of horizontal and vertical inequities discussed in this section. This adjustment feature bears watching, although currently there are insufficient data on post-injury outcomes for workers who were recently injured to evaluate whether the 2004 reforms have been successful.
THE 1971 REPORT ON THE ECONOMIC VALIDATION OF THE [VA] RATING SCHEDULE STUDY
The Veterans Disability Compensation Program
Disability compensation is a cash benefit paid to veterans who are disabled by injuries or diseases incurred or aggravated during active military service. The benefit amount is graduated according to the degree of the veteran’s disability rated on a scale from 10 to 100 percent (in increments of 10 percent). The monthly benefit depends on the veteran’s disability rating and dependency status. As of December 2006, the monthly benefit for a veteran with no dependents ranged from $115 for a 10 percent rating to $712 for a 50 percent rating to $2,471 for a 100 percent rating. The monthly benefit is higher for veterans with dependents; for example, as of December 2006, a veteran with a 50 percent disability rating with a spouse and one child received $832 per month.
Purpose of the Cash Benefits in the Veterans Disability Compensation Program
As discussed above, the sole purpose of the cash benefits specified by §4.1 of the Code of Federal Regulations dealing with the VA’s Rating Schedule is to compensate for work disability (as that term is used in this study):
The percentage ratings represent as far as can practicably be determined the average impairment in earning capacity resulting from such diseases and injuries and their residual conditions in civil occupations.
The Operational Basis for the Cash Benefits in the Veterans Disability Compensation Program
While the purpose of the cash benefits in the veterans disability compensation program is to compensate for work disability, the program is similar to the Wisconsin and California programs in the use of a proxy or proxies for work disability as the operational basis for the benefits. The Rating Schedule used for the program is contained in the Code of Federal Regulations (38 CFR Ch.1). The general guidance for the basis of the ratings is contained in
§4.10 Functional impairment.
The basis of disability evaluations is the ability of the body as a whole, or of the psyche, or of a system or organ of the body to function under the ordinary conditions of daily life including employment. Whether the upper or lower extremities, the back or abdominal wall, the eyes or ears, or the cardiovascular, digestive, or other systems, or psyche are affected, evaluations are based upon lack of usefulness, of these parts or systems, especially in self-support. This imposes upon the medical examiner the responsibility of furnishing, in addition to the etiological, anatomical, pathological, laboratory and prognostic data required for ordinary medical classification, full description of the effects of disability upon the person’s ordinary activity. In this connection, it will be remembered that a person may be too disabled to engage in employment although he or she is up and about and fairly comfortable at home or upon limited activity.
This paragraph appears to direct that ratings should be based on at least two concepts in Figure C-2, including limitations in activities of daily living (II) and loss of earning capacity (IIIA). The paragraph also appears to contain an admonition to not consider loss of capacity for nonwork experiences (IVA) in determining the rating.
Despite the language of § 4.10 that mandates consideration of a broad array of factors in determining the disability rating, the instructions for the
ratings of specific injuries contained in the Code of Federal Regulations appear to rely on more constricted criterion. For example, the rating for medical condition 5120 (arm, amputation of: above insertion of deltoid) is 90 percent for the major arm and 80 percent for the minor arm. The basis for rating medical condition 5120 appears to correspond to medical impairment: anatomical loss (IA) in Figure C-2. Another example is the ratings for medical condition 5201 (arm, limitation of motion of), which are 40 percent for limitation to 25° from side, 30 percent for limitation to midway between side and shoulder level, and 20 percent for limitation at shoulder level. The basis for rating medical condition 5201 appears to correspond to medical impairment: functional loss (IB) in Figure C-2.
Summary of the Economic Validation of the Rating Schedule Study
In 1971, VA conducted a study of the 1967 earnings of disabled veterans called Economic Validation of the Rating Schedule or ECVARS. The results were tabulated by the diagnostic codes used in the Rating Schedule and by the rating degrees for the veterans’ medical conditions. We examined the results for disabled veterans with 10 medical conditions. These conditions were chosen because (1) they were among the 21 medical conditions selected by the IOM committee for special scrutiny; (2) there are results from the 1971 study for the medical conditions being scrutinized by the IOM committee;16 and (3) the 1971 results include at least two levels of disability rating for the medical condition.17
The results from the ECVARS study are included in the panels in Table C-3. The panels correspond to those used in Tables C-1 (Wisconsin) and C-2 (California) in order to facilitate comparisons. However, some panels are omitted from Table C-3 because data are not available for the veterans with disabilities.
Panel A. There are no data on the number of veterans in each cell; therefore, this panel is missing in Table C-3. Because we do not have the number of veterans with disabilities in each cell, we cannot calculate a weighted average for all veterans in the tables.18
|
16 |
For example, there are no 1971 results for diagnostic code 6351 (HIV-related illness), so this condition is not included in Table C-3. |
|
17 |
For example, there is only one rating level for diagnostic code 6350 (Lupus) in the 1971 results, so this condition is not included in Table C-3. |
|
18 |
According to the ECVARS study, the number of cases in each cell was at least 200, except for a small number of cells with fewer than 200 that were included “because of unique problems associated with them [i.e., those particular conditions].” If the population in a cell was greater than 500, it was sampled. Overall, there were approximately 500,000 cases in a little more than the 1,000 cells. |
Panel B. The potential earnings for veterans with disabilities in each cell were based on the actual median earnings of the veterans without disabilities in the control group, as reported on a survey questionnaire administered by the Census Bureau. The control group consisted of 14,000 veterans not receiving disability compensation from VA or the Department of Defense (DoD).19 The veterans without disabilities in the control group were matched to the veterans with disabilities on the basis of age, education, and region.20 The potential earnings in Panel B correspond to the potential earnings in Figure C-3 for 1967 and represent the estimate of what the veterans in the study would have earned had they not been injured. For veterans with injuries that resulted in an amputation of an upper extremity, the median potential earnings were $7,444.
Panel C. The actual median earnings of the veterans in each cell in 1967 were determined based on the survey conducted by the Census Bureau. The actual earnings used to calculate the results in Panel C correspond to the actual earnings shown in Figure C-3. The actual earnings were subtracted from the potential earnings to determine the earnings losses in Panel C. For veterans with injuries that resulted in an amputation of an upper extremity, the median of the earnings losses was $335.
Panel D. There are no data on the standard deviation of the earnings losses for the veterans with disabilities: therefore, this panel is missing in Table C-3.
Panel E. The proportional earnings losses are shown in Panel E. These figures represent the median earnings losses in Panel C divided by the median potential earnings in Panel B. For veterans with injuries that resulted in an amputation of an upper extremity, the proportional earnings loss was 0.045 ($335 divided by $7,444), which means that the earnings losses for disabled veterans with this type of injury were 4.5 percent of potential earnings.
Panel F. The median disability benefits for veterans are shown in Panel F. Because the benefits are a function of the rating category, there are no variations in benefits among veterans with the same percentage disability
TABLE C-3 Veterans with Disabilities in 1967
|
|
|
Percent Rating |
|||||||||
|
|
Medical Conditions |
10 |
20 |
30 |
40 |
50 |
60 |
70 |
80 |
90 |
100 |
|
Panel B |
Median potential earnings (in dollars)a |
||||||||||
|
1 |
Amputation, upper extremity |
7,444 |
7,135 |
7,176 |
6,743 |
7,016 |
7,003 |
7,272 |
7,412 |
7,517 |
|
|
2 |
Spine disorders |
8,119 |
7,559 |
|
7,413 |
|
7,108 |
|
|
|
|
|
3 |
Impairment of knee (other than ankylosis) |
7,955 |
7,699 |
7,550 |
|
|
|
|
|
|
|
|
4 |
Defective visual acuity |
7,576 |
8,262 |
7,241 |
7,439 |
7,018 |
6,993 |
7,209 |
7,243 |
7,008 |
7,507 |
|
5 |
Hearing impairment |
7,821 |
7,425 |
7,293 |
7,223 |
|
7,263 |
|
7,203 |
|
|
|
6 |
Chronic respiratory diseases |
7,844 |
|
7,069 |
|
|
6,605 |
|
|
|
6,502 |
|
7 |
Hypertensive vascular disease |
7,672 |
7,519 |
|
7,275 |
|
|
|
|
|
|
|
8 |
Gastrointestinal ulcers |
7,287 |
7,023 |
|
6,691 |
|
|
|
|
|
|
|
9 |
Scars |
7,692 |
|
7,592 |
|
7,447 |
|
|
7,215 |
|
|
|
10 |
Diabetes mellitus |
7,547 |
7,617 |
|
7,709 |
|
7,500 |
|
|
|
7,035 |
|
11 |
Average |
7,696 |
7,530 |
7,320 |
7,213 |
7,160 |
7,079 |
7,241 |
7,268 |
7,263 |
7,015 |
|
Panel C |
Median earnings losses (in dollars)a |
||||||||||
|
1 |
Amputation, upper extremity |
335 |
899 |
775 |
1,733 |
1,747 |
2,500 |
2,269 |
2,283 |
1,977 |
|
|
2 |
Spine disorders |
479 |
703 |
|
1,401 |
|
4,144 |
|
|
|
|
|
3 |
Impairment of knee (other than ankylosis) |
700 |
1,047 |
755 |
|
|
|
|
|
|
|
|
4 |
Defective visual acuity |
500 |
694 |
1,231 |
1,964 |
2,000 |
2,930 |
3,691 |
4,838 |
5,599 |
6,013 |
|
5 |
Hearing impairment |
219 |
891 |
547 |
809 |
|
1,271 |
|
2,096 |
|
|
|
6 |
Chronic respiratory diseases |
753 |
|
1,633 |
|
|
5,046 |
|
|
|
5,533 |
|
7 |
Hypertensive vascular disease |
468 |
1,421 |
|
1,746 |
|
|
|
|
|
|
|
8 |
Gastrointestinal ulcers |
634 |
927 |
|
1,559 |
|
|
|
|
|
|
|
9 |
Scars |
300 |
|
782 |
|
700 |
|
|
2,720 |
|
|
|
10 |
Diabetes mellitus |
800 |
815 |
|
1,457 |
|
2,700 |
|
|
|
5,565 |
|
11 |
Average |
519 |
925 |
954 |
1,524 |
1,482 |
3,099 |
2,980 |
2,984 |
3,788 |
5,704 |
|
Panel E |
Proportional earnings lossesa |
||||||||||
|
1 |
Amputation, upper extremity |
0.045 |
0.126 |
0.108 |
0.257 |
0.249 |
0.357 |
0.312 |
0.308 |
0.263 |
|
|
2 |
Spine disorders |
0.059 |
0.093 |
|
0.189 |
|
0.583 |
|
|
|
|
|
3 |
Impairment of knee (other than ankylosis) |
0.088 |
0.136 |
0.100 |
|
|
|
|
|
|
|
|
4 |
Defective visual acuity |
0.066 |
0.084 |
0.170 |
0.264 |
0.285 |
0.419 |
0.512 |
0.668 |
0.799 |
0.801 |
|
5 |
Hearing impairment |
0.028 |
0.120 |
0.075 |
0.112 |
|
0.175 |
|
0.291 |
|
|
|
6 |
Chronic respiratory diseases |
0.096 |
|
0.231 |
|
|
0.764 |
|
|
|
0.851 |
|
7 |
Hypertensive vascular disease |
0.061 |
0.189 |
|
0.240 |
|
|
|
|
|
|
|
8 |
Gastrointestinal ulcers |
0.087 |
0.132 |
|
0.233 |
|
|
|
|
|
|
|
9 |
Scars |
0.039 |
|
0.103 |
|
0.094 |
|
|
0.377 |
|
|
|
10 |
Diabetes mellitus |
0.106 |
0.107 |
|
0.189 |
|
0.360 |
|
|
|
0.791 |
|
11 |
Average |
0.068 |
0.123 |
0.131 |
0.212 |
0.209 |
0.443 |
0.412 |
0.411 |
0.531 |
0.814 |
|
Panel F |
Median benefits (in dollars)a |
||||||||||
|
1 |
Amputation, upper extremity |
252 |
480 |
720 |
984 |
1,356 |
1,632 |
1,932 |
2,232 |
2,508 |
|
|
2 |
Spine disorders |
252 |
480 |
|
984 |
|
1,632 |
|
|
|
|
|
3 |
Impairment of knee (other than ankylosis) |
252 |
480 |
720 |
|
|
|
|
|
|
|
|
4 |
Defective visual acuity |
252 |
480 |
720 |
984 |
1,356 |
1,632 |
1,932 |
2,232 |
2,508 |
3,600 |
|
5 |
Hearing impairment |
252 |
480 |
720 |
984 |
|
1,632 |
|
2,232 |
|
|
|
6 |
Chronic respiratory diseases |
252 |
|
720 |
|
|
1,632 |
|
|
|
3,600 |
|
7 |
Hypertensive vascular disease |
252 |
480 |
|
984 |
|
|
|
|
|
|
|
8 |
Gastrointestinal ulcers |
252 |
480 |
|
984 |
|
|
|
|
|
|
|
9 |
Scars |
252 |
|
720 |
|
1,356 |
|
|
2,232 |
|
|
|
10 |
Diabetes mellitus |
252 |
480 |
|
984 |
|
1,632 |
|
|
|
3,600 |
|
11 |
Average |
252 |
480 |
720 |
984 |
1,356 |
1,632 |
1,932 |
2,232 |
2,508 |
3,600 |
rating.21 For veterans with injuries that resulted in an amputation of an upper extremity, the median of the disability benefits was $252.
Panel G. The replacement rates are shown in Panel G. For veterans with injuries that resulted in an amputation of an upper extremity, the replacement rate was 0.752 ($252 divided by $335), which means these veterans received benefits that replaced 75.2 percent of their earnings losses.
The Veterans Disability Rating System and Equity
The results from the study of disabled veterans can be used to illustrate the use of the equity and adequacy criteria to evaluate the performance of a system providing benefits to persons experiencing losses of earnings as a result of injuries or diseases. The balance of this section discusses several figures derived from the information in Table C-3. (The figures transform the proportions in Table C-3 into percentages.) Figures C-14 and C-15 each contain five of the medical conditions included in Table C-3.
Vertical Equity for Ratings
The data in Figures C-14 and C-15 suggest that the Rating Schedule performed reasonably well when evaluated using the vertical equity criteria. This test requires that actual wage losses generally increase as the disability ratings increase. In most instances, as the percentage disability ratings increase for a particular medical condition, the percentage earnings losses also increase. The major exception is for amputations to the upper extremity, where earnings losses increase as ratings increase over the 10 to 60 percent range, and then earnings losses decrease over the 60 to 90 percent range. There is a general tendency for earnings losses to increase less rapidly than the disability ratings, as shown by the location of the plots of the 10 conditions below the exact proportionate increase line (shown as a dashed line in Figures C-15 and C-16).
Vertical Equity for Ratings—Revisited
Shall we look at the trees (represented by Figures C-14 and C-15) or the forest (represented by Figure C-16)? As shown in Figure C-16, which represents an unweighted average of the 10 conditions shown in Figures C-14 and C-15, the relationship between rating categories and percentage earn-
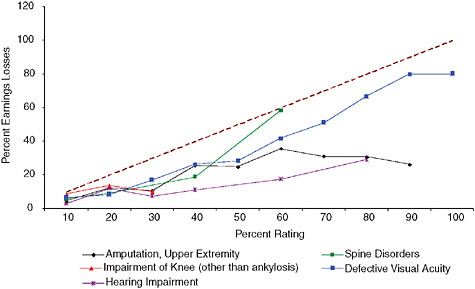
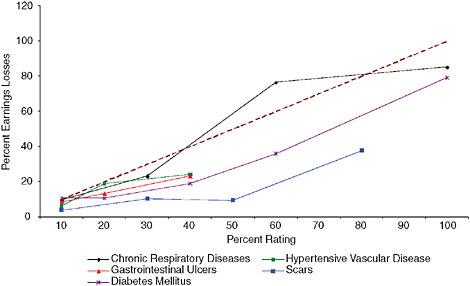
ings losses is not monotonic: They do not consistently increase together. For example, the earnings losses decline as ratings increase from 60 to 70 to 80 percent. Moreover, the magnitudes of the ratings and the losses are not particularly close. The dashed line represents an exact correspondence between ratings and losses (for example, a 40 percent disability rating equals a 40 percent earnings loss). For every level of rating, ratings clearly exceed the earnings losses. For example, for veterans with a 40 percent rating, earnings losses are 21.2 percent of potential earnings. At this level of aggregation, the VA rating system does a fairly poor job of providing vertical equity.
Intra-Injury Horizontal Equity for Ratings
Intra-injury horizontal equity for ratings requires that the actual wage losses for veterans with the same disability ratings and the same types of injury should be the same or similar. This test cannot be applied to the Rating Schedule because we lack information on the extent of variation within each cell (which is why Table C-3 does not contain Panel D.)
Inter-Injury Horizontal Equity for Ratings
Inter-injury horizontal equity for ratings requires that the earnings losses for veterans with the same disability ratings and different types of
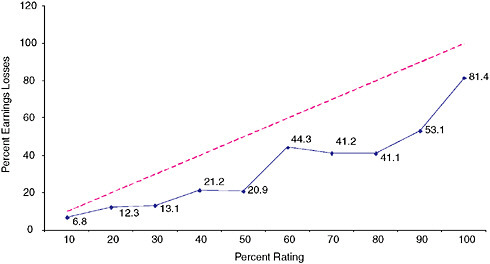
FIGURE C-16 Percentage earnings losses for veterans: averages for ten types of injuries.
injuries should be the same or similar. The results in Figures C-14 and C-15 suggest that the earnings losses for the various types of injuries with ratings from 10 to 40 percent are similar. However, there are significant differences among the types of injuries concerning the relationships between disability ratings and lost earnings for more serious injuries. For example, defective visual acuity (condition 4) has higher earnings losses than upper extremity amputations (condition 1) and hearing impairments (condition 5) for disability ratings between 40 and 90 percent in Figure C-14. In addition, without exception, veterans with scars have the lowest earnings losses for each rating category in Figure C-15.
Replacement Rates and Adequacy for Veterans with Disabilities
The relationships between disability ratings and replacement rates for each of the 10 types of injuries in Table C-3 are shown in Figures C-17 and C-18. The relationship between disability ratings and replacement rates for the average of the 10 types of injuries are shown in Figure C-19.
Adequacy of Benefits
The data in Figures C-17 through C-19 could be used to assess the adequacy of benefits provided by the veterans disability compensation pro-
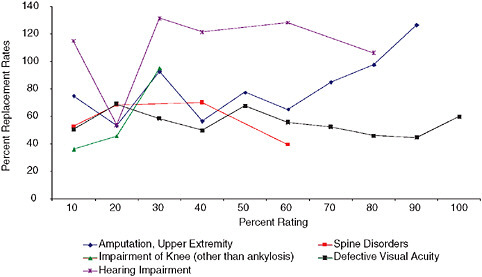
FIGURE C-17 Replacement rates (benefits as a percentage of earnings losses) for veterans with five types of injuries.
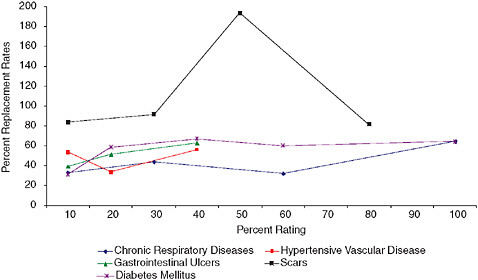
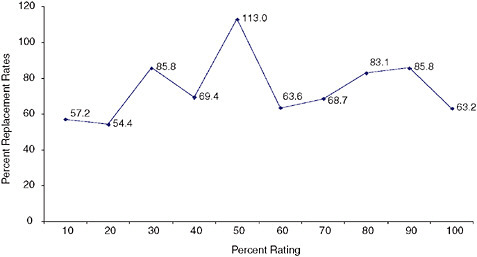
gram. However, the decision about what constitutes adequate benefits is not part of the charge for the IOM committee for whom this report is being prepared. We therefore will not discuss that topic other than to note that the contributions of veterans to the security of the United States provides a special justification for adequate benefits.
Replacement Rates and Equity for Veterans with Disabilities
Vertical Equity for Benefits
The data in Figures C-17 through C-19 can also be used to examine the vertical equity of benefits for veterans with disabilities. Vertical equity requires that the same proportion of lost wages should be replaced for veterans at all disability ratings, which would require the lines for an injury to be flat in these figures. In this instance, there is fairly good vertical equity for the benefits for the five conditions included in Figure C-18, with the obvious exception of the spike in the replacement rate for veterans with scars rated at 50 percent. There is less vertical equity for the five conditions shown in Figure C-17. For the average of the 10 types of injuries, shown in Figure C-17, the replacement rates vary between roughly 55 and 85 percent for all the rating categories, except the 50 percent rating category, which indicates there is reasonable degree of vertical equity for the benefits in the veterans disability benefit program.
Inter-Injury Horizontal Equity for Benefits
Inter-injury horizontal equity for benefits requires that the replacement rates for veterans with the same disability ratings and different types of injuries should be the same or similar. The results in Figures C-17 and C-18 suggest there are significant differences among the types of injuries concerning the relationships between benefits and lost earnings.
Observations on the Veterans Disability Compensation Program
-
We again note it is important to distinguish between the ability of the disability rating system to accurately predict earnings losses (discussed in entries 3 through 5 below) and the ability of the benefit system to match benefits to earnings losses (discussed in entries 6 and 7). The former is of particular relevance to this study because the IOM committee has been asked to assess the accuracy of the disability ratings produced by the Rating Schedule.
-
We have analyzed data on veterans with 10 medical conditions, which constitute a small portion of veterans who received disability benefits during the year covered by the ECVARS study.
-
At the most aggregate level—the average for the 10 medical conditions—the disability rating system for veterans does a fairly poor job of providing vertical equity. As shown in Figure C-16, the earnings losses decline with higher ratings for several levels of severity. In addition, the earnings losses are consistently less than the ratings levels.
-
When the veterans are separated into the 10 injury types, the rating system appears to do a better job of providing vertical equity. In general, as shown in Figures C-14 and C-15, earnings losses increase as ratings increase, although there are exceptions. Of interest is that earnings losses are less than the disability ratings for almost all entries in the figures.
-
There are serious problems with the rating system for veterans with disabilities in terms of inter-injury horizontal equity. As shown in Figures C-14 and C-15, there are significant differences among the 10 types of medical conditions in the relationships between disability ratings and lost earnings.
-
The veterans disability system does a reasonably good job of providing vertical equity for benefits. Vertical equity for benefits is better at the aggregate level (Figure C-16) than at the level of individual medical conditions (Figures C-17 and C-18).
-
Finally, the benefit system for veterans with disabilities has serious problems with inter-injury horizontal equity. As shown in Figures C-14 and C-19, there were significant differences among the types of medical conditions in the relationships between benefits and lost earnings.
CONCLUSIONS
Purpose of This Study
The primary purpose of this study is to provide a framework for examining the relationship between disability ratings and earnings losses in order to help the IOM committee formulate a response to the first task assigned to the committee. We use that framework to examine three different programs that provide cash benefits to persons with disabilities. We realize that the three programs—the Wisconsin and California workers’ compensation programs and the veterans disability compensation program—are quite
different in many aspects. However, the three programs all have a common goal—compensating persons with earnings losses resulting from injuries or diseases—and a common procedure—using a proxy or proxies for actual earnings losses as the basis for predicting earnings losses rather than relying on direct measurement of each person’s actual earnings losses.
Our study provides a useful framework and several empirical findings important for our understanding of VA’s Rating Schedule and other disability rating systems. However, we did not have access to current data concerning the earnings losses for veterans who are receiving benefits from the compensation program. A study being conducted by the Center for Naval Analyses (CNA) should provide data that can be used in connection with our framework to revise the Rating Schedule and related rating regulations.
Use of the Equity Criteria
We used several variants of equity criteria to assess the performance of the three programs. Vertical equity requires that actual wage losses increase in proportion to increases in disability ratings. At the aggregate level (the entire sample of workers or veterans), we concluded that the Wisconsin rating system did an excellent job, the California rating system did a moderately good job, and the VA rating system did a fairly poor job using the vertical equity criterion. When the samples were disaggregated by type of injury (or medical condition), Wisconsin did not do as well as at the aggregate level, California did a moderately good job (similar to the performance at the aggregate level), and the VA rating system did reasonably well (and better than at the aggregate level). Overall, we conclude that the three ratings did a reasonably good job on the vertical equity criterion.
Inter-injury horizontal equity requires that workers or veterans with similar disability ratings but different types of injuries should experience similar earnings losses. We concluded there were serious inter-injury equity problems in the ratings systems used by the Wisconsin and California workers’ compensation programs, as well as the veterans disability compensation program. Each of the programs systematically treated some injuries or medical conditions different from other injuries in terms of the extent of earnings losses associated with similar disability ratings.
Intra-injury horizontal equity requires that workers or veterans with the same injuries or medical conditions and the same ratings should experience similar earnings losses. We only have data for the Wisconsin workers’ compensation program to apply this criterion, and we found serious equity problems.
Our overall conclusion is that the three programs do a reasonably good job on vertical equity—especially at the aggregate level—but that there are serious horizontal equity problems in each of the programs. As a result, we
conclude that the various factors in Figure C-1 (such as medical impairment or loss of earning capacity) currently used by various workers’ compensation programs and VA do a reasonably good job in serving as proxies for actual wage loss.
Distinguishing Between the Purpose of Benefits and the Operational Basis for Benefits
We distinguish between the purpose of benefits and the operational basis for benefits. The purpose of the two workers’ compensation programs we examined and the current purpose of the veterans disability compensation program is to compensate for work disability (loss of earnings). However, all three programs use proxies (or predictors) for losses of earnings as the operational basis for benefits. For example, the amount of benefits is determined for some medical conditions by rating the severity of the permanent impairment (a medical concept) because the severity of the impairment is assumed to be a good predictor of the loss of earnings resulting from the impairment.
The Use of Proxies to Predict Earnings Losses
We conclude that the various factors in Figure C-1 (such as medical impairment or loss of earning capacity) currently used by various workers’ compensation programs and VA do a reasonably good job in serving as proxies for actual wage loss. If the factors in Figure C-1 can be used as rough proxies for actual wage loss, what can be done to improve the match between the proxies and the actual wage loss? We have several observations and suggestions.
One issue we have considered is whether the disability rating systems would do a better job of predicting actual wage loss if they placed less emphasis on impairment as the proxy for wage loss and more emphasis on functional limitations and loss of earning capacity as proxies. That is, should we be “shifting to the right” in the factors in Figure C-1 to find better proxies for actual wage loss? The answer—based on the comparison of Wisconsin and California results—is no! Wisconsin at the time the data shown in Table C-2 were collected relied strictly on assessments of medical impairment to determine the amount of PPD benefits, while California relied on a variety of the consequences shown in Figure C-2 as proxies for work disability. Wisconsin did a better job in terms of vertical equity than California and a comparable job in terms of horizontal equity. We therefore tentatively conclude based on the workers’ compensation data that there is no reason to incorporate consequences of injuries and disease other than medical impairment in order to improve the accuracy of the predictions of
actual earnings losses. We want to make clear that this tentative conclusion needs to be carefully examined in subsequent research, especially in studies of the veterans disability compensation program. The forthcoming data from CNA, for example, should be studied to compare the ability to predict earnings losses for (1) medical conditions for which the ratings are based on permanent impairment with (2) medical conditions for which ratings are based on limitations in the activities of daily living or other “intermediate” concepts in Figure C-2.
One policy change recommended by RAND for California workers’ compensation was to periodically assess the actual earnings losses associated with workplace injuries and to determine if there were systematic overestimates or underestimates of the earnings losses associated with the disability ratings for both the system as a whole and for particular injuries or medical conditions. This information could then be used to recalibrate the rating system.22 A similar procedure could be adopted for the VA disability compensation program. For example, if mental disorders were found to have greater earnings losses than would be expected based on the disability ratings, the rating system could be revised. This could be done either by changing the rating system directly (so that a given level of mental impairment would now be rated at 40 percent rather than 20 percent) or indirectly by producing a set of “modifiers” (so that the medical impairment ratings for mental impairments would be multiplied by two to produce a “disability rating” used for determining the amount of benefits). This policy change could help improve the vertical equity and the inter-injury horizontal equity for the ratings in the veterans disability program.
Intra-Injury Horizontal Equity and Outliers
The preceding discussion essentially pertains to the virtues and deficiencies in the rating system for disabilities in two workers’ compensation programs and in the veterans disability program using the criteria of vertical equity and inter-injury horizontal equity, and to some possible policies to deal with the deficiencies. Another topic we want to examine is intra-injury horizontal equity for ratings, which requires that workers or veterans with the same disability rating and same type of injury or medical condition should experience the same or similar levels of earnings losses. The evidence from Wisconsin in Panels C and D of Table C-2, as summarized in Figure C-5, suggest that lack of intra-injury equity is a pervasive phenomenon.
We are skeptical that any disability rating system—no matter how refined—can accurately predict the actual earnings losses resulting from medical conditions for substantial numbers of workers or veterans. Most systems can accommodate those cases in which the earnings losses are much less than is predicted based on the disability rating. The challenge is to deal with the other type of “outliers”—the worker or veteran who has earnings losses far in excess of the amount predicted based on the person’s disability rating.
There are four possible responses to this challenge. First, the disability program can assert that in a system of social insurance (or social justice), outliers should be ignored in order to reduce administrative costs and to avoid excessive costs to the system. This is the approach used in most workers’ compensation programs for the vast majority of workers with permanent disabilities.
Second, the disability program can treat every worker or veteran as an individual and determine benefits based on his or her own labor market experience. This comes close to the “wage-loss” approach (which bases the benefits solely or primarily on the worker’s own labor market experience) that has been tried in several workers’ compensation programs and generally rejected as unworkable or too expensive. The “wage-loss” approach foregoes the use of proxies as the basis for benefits, which have generally been incorporated into disability compensation systems because of administrative convenience and to avoid the incentive effects that occur if higher earnings result in reduced benefits.
Third, the disability program may be able to identify variables that increase the accuracy of the rating system but that do not cause inappropriate incentives for beneficiaries. For example, if after controlling for the type and severity of injury, the addition of age to the disability rating system increases the accuracy of the predictions of loss of actual earnings, intra-injury horizontal equity will be improved. However, whether there are such variables that improve the accuracy of the rating system is an empirical question where logic is probably a poor guide.23
Fourth, the disability program can use the disability rating system to determine the amount of benefits for the majority of beneficiaries, but provide a safety valve for “outliers” who have earnings losses far in excess of the amount of losses predicted by the rating system. This approach is used
in some workers’ compensation programs in which workers with relatively low “impairment ratings” can receive additional benefits either because they are reclassified from PPD to permanent total disability (using the “odd lot” doctrine24) or because they are workers in a state with hybrid benefits (where workers who exhaust their benefits based on the rating schedule qualify for additional benefits because they have continuing wage losses due to their workplace injuries25).
The counterpart to this provision of additional benefits for extraordinary wage loss in some workers’ compensation programs is the veterans disability compensation program provision of “individual unemployability” (IU) benefits, which serve as the program’s safety valve for those veterans who have much greater earnings losses than the disability rating system predicts. Without endorsing the specific aspects of the IU benefits in the veterans disability compensation program, we endorse the general concept of a special benefit for those veterans who are outliers in terms of their actual earnings losses compared with their expected earnings losses. The reason is that the best of all possible disability rating systems will seriously underpredict the earnings losses of some disabled persons.
The Difference Between Rating Systems and Benefit Systems
We have distinguished between the rating systems for permanent disability and the benefits systems for permanent disability. The former measures the seriousness of an injury or disease in terms of the consequences, such as permanent impairment, limitations in activities of daily living, and loss of earning capacity. The latter uses the disability rating, perhaps in connection with other information, such as the disabled person’s age or education, to determine the amount of disability benefits.
We have focused on disability rating systems because that is the domain of the IOM committee. We have provided criteria for evaluating the rating system—horizontal and vertical equity. We have also briefly discussed benefits systems, and provided criteria for evaluating such systems—horizontal equity, vertical equity, and adequacy. While we have concluded that the disability rating systems for the two workers’ compensation programs and the veterans disability compensation program do a reasonably good job of providing equity, we have not attempted to make any judgment about the adequacy of the veterans disability benefits.
Methodological Limitations
There are several methodological issues that sophisticated examinations of disability ratings systems must consider, and that are beyond the scope of the current study. We will briefly comment on two of them.
First, there is a question concerning the proper level of aggregation for examining the relationship between disability ratings and loss of earnings. In our tables, we have divided the mean (or median) earnings losses for all workers in a cell (defined by medical condition and age) by the mean (or median) earnings losses for all workers in the cell. Thus, in Table C-1, we divided the mean earnings losses for workers with upper extremity injuries rated 1–2 percent in Panel C ($1,535) by the mean potential earnings for those workers shown in Panel B ($42,740) to produce the proportional earnings losses shown in Panel E (0.036 or 3.6 percent). An alternative approach would be to calculate the proportional earnings losses for individual workers by using each worker’s earnings losses and potential earnings. The approach we used may be affected by a few outliers, that is, by workers whose experience was much different than most workers in the cell. Using the distribution of proportional earnings losses for individual workers might show, for example, that the rating system accurately predicted the earnings losses for the vast majority of workers in the cell. We did not use this alternative procedure to assess the equity of the rating systems we examined because the necessary data were unavailable for the Wisconsin workers’ compensation program and the veterans disability compensation program. We suggest that subsequent examinations of disability rating systems consider this alternative approach.
Second, there is a difficult methodological problem caused by the possible comingling of disability ratings and earnings losses, as discussed by Greenberg and Rosenheck (2007). This can occur for two reasons. In some disability systems, such as the Disability Insurance (DI) component of the Social Security program, eligibility for the benefits depends on demonstrating an inability to engage in gainful activity. If DI benefits increase, some workers may limit the amount of time they work in order to qualify for benefits. If there were no DI program (or if the DI benefits were lower) the workers would have higher earnings. Thus, the disability benefits system induces higher earnings losses than would have occurred in the absence of the system.
The permanent partial disability benefits provided by most workers’ compensation programs and the veterans disability compensation program do not in general link eligibility for the cash benefits to a demonstration of earnings losses and, consequently, the possible inducement to reduce
earnings in order to qualify for benefits is muted.26 There is, however, another possible effect on earnings resulting from the cash benefits provided by these programs. The benefits received by injured workers and injured veterans increase their wealth, and the wealth effect (as it is termed by economists) may induce the beneficiaries to reduce their supply of labor. Thus, a higher disability rating may lead to higher disability benefits and, in turn, to lower earnings than would have occurred if there were no disability benefits system, with the result that part of the lower earnings associated with higher ratings may be due to the inducements provided by the disability benefits system. Ideally, an empirical study of the relationship between disability benefits and earnings losses would separate the effects of the severity of the consequence of the injury from the effects of the benefits provided by the disability benefits system.27
We do not think these methodological issues detract from the primary conclusions of the current study.
REFERENCES
Berkowitz, M., and J. F. Burton, Jr. 1987. Permanent disability benefits in workers’ compensation. Kalamazoo, MI: W. E. Upjohn Institute for Employment Research.
Boden, L. I., R. T. Reville, and J. Biddle. 2005. The adequacy of workers compensation benefits. In Workplace injuries and diseases: Prevention and compensation: Essays in honor of Terry Thomason, edited by K. Roberts, J. F. Burton, Jr., and M. M. Bodah. Kalamazoo, MI: W. E. Upjohn Institute for Employment Research. Pp. 37–68.
Burton, J. F., Jr. 2005. Permanent partial disability benefits. In Workplace injuries and diseases: Prevention and compensation: Essays in honor of Terry Thomason, edited by K. Roberts, J. F. Burton, Jr., and M. M. Bodah. Kalamazoo, MI: W. E. Upjohn Institute for Employment Research, Pp. 69–116.
Cocchiarella, L., G. B. J. Andersson. 2001. Guides to the evaluation of permanent impairment, Fifth Edition. Chicago, IL: American Medical Association.
Greenberg, G. A., and R. A. Rosenheck. 2007. Compensation of veterans with psychiatric or substance abuse disorders and employment and earnings. Military Medicine 172:162–168.
Hunt, H. A. 2004. Adequacy of earnings replacement in workers compensation programs. Kalamazoo, MI: W. E. Upjohn Institute for Employment Research.
Larson, A., and L. K. Larson. 2006. Larson’s workers’ compensation, desk edition. Newark, NJ: LexisNexis.
Musgrave, R. A. 1959. The theory of public finance. New York: McGraw-Hill.
The National Commission (National Commission on State Workmen’s Compensation Laws). 1972. The report of the National Commission on State Workmen’s Compensation Laws. Washington, DC: Government Printing Office.
Peterson, M. A., R. T. Reville, R. K. Stern, and P. S. Barth. 2001. Compensating permanent workplace injuries: A study of California’s system. Santa Monica, CA: RAND Corporation.
Reville, R. T. 1999. The impact of a disabling workplace injury on earnings and labor participation. In The creation and analysis of linked employer-employee data, contributions to economic analysis, edited by J. C. Haltiwanger, J. I. Lane, J. R. Spletzer, J. J. M. Theeuwes, and K. R. Troske. New York: Elsevier Science, North-Holland. Pp. 147–173.
Reville, R. T., J. Bhattacharya, and L. Sager. 2001. New methods and data sources for measuring the economic consequences of workplace injuries. American Journal of Industrial Medicine 40:452–463.
Reville, R. T., S. A. Seabury, F. W. Neuhauser, J. F. Burton, Jr., and M. D. Greenberg. 2005. An evaluation of California’s permanent disability rating system. Santa Monica, CA: RAND Institute for Civil Justice.
Willborn, S. L., S. J. Schwab, J. F. Burton, Jr., and G. L. L. Lester. 2007. Employment law: Cases and material, Fourth Edition. Newark, NJ: LexisNexis.


