
2
Veterans with Disabilities in the 21st Century
An effective medical evaluation system for a veterans disability compensation program depends in part on the purpose of the program, which is addressed in Chapter 3. The effectiveness of such a system also depends in part on the volume of claims and the types of impairments for which veterans are likely to seek compensation.
The numbers and types of claims submitted to the Department of Veterans Affairs (VA) for disability compensation depend on a number of variables, some of which are demographic. According to the VA secretary, “The number of active duty servicemembers as well as reservists and National Guard members who have been called to active duty to support Operation Enduring Freedom [OEF] and Operation Iraqi Freedom [OIF] is one of the key drivers of new claims activity” (U.S. Congress, House of Representatives, Committee on Veterans’ Affairs, 2007a). The VA under secretary for benefits reported in March 2007 that nearly 1.46 million active duty servicemembers and reservists had been deployed to Afghanistan and Iraq, of whom more than 689,000 had returned and been discharged (U.S. Congress, House of Representatives, Committee on Veterans’ Affairs, 2007c). Original (i.e., first-time) compensation claims have doubled in recent years from 112,000 in fiscal year (FY) 2000 to 217,000 in FY 2006 (VA, 2007a).
However, original claims constitute only a third of the claims. The remaining two-thirds of compensation claims made each year are from veterans previously determined to have a service-connected disability, most
of them veterans of World War II, Korea, and Vietnam.1 As the population of veterans ages, the Veterans Benefits Administration (VBA) can expect to see a growing percentage of claims for worsening chronic conditions, such as cardiovascular diseases, mental illnesses, and diabetes, and secondary conditions resulting from already service-connected disabilities.2 This in turn has implications for VA’s Schedule for Rating Disabilities (Rating Schedule) and the process for applying it in the rating process. VBA is already reporting higher rates of claims for complications of diabetes.3 Often, these are more complex claims, requiring a determination that a new impairment, such as kidney or coronary heart disease, is as likely as not caused by the veteran’s service-connected diabetes, an issue that is addressed more fully in Chapter 9. If the incidence of a particular condition is likely to increase substantially, VBA might want to review and, if warranted, update the criteria in the Rating Schedule, to ensure that appropriate specialists are available to conduct examinations, and to provide specialized training and information resources to the raters.
Similarly, if a war is under way, VBA can expect to see a new cohort of veterans with wounds and other injuries and diseases encountered in wartime situations. As protective equipment, frontline emergency medicine, and medical evacuation techniques improve, more seriously injured servicemembers will survive at a higher rate. For example, the average time to evacuate a wounded servicemember from the battlefield to stateside care is 3 days, compared with 10 to 14 days during the Persian Gulf War in 1991 and 45 days during the Vietnam War (U.S. Congress, Senate, Defense Appropriations Subcommittee, 2007).
The ratio of wounded to killed in the current wars in Iraq and Afghanistan is 9.1 to 1, compared with 3.2 to 1 in Vietnam and 2.3 to 1 in World War II.4
The main cause of injury in Iraq has been blasts from roadside bombs, resulting in a characteristic or “signature” set of multi-system injuries likely to result in permanent severe impairments and functional limitations (Scott, 2005).5 These include brain injury, blinding, hearing and vestibular impairment, nerve and organ damage, burns, and amputation of one or more extremities, some or all of which can happen to one person.6 Some of these injuries are caused by bomb fragments and flying debris, but some are caused by overpressure from the blast wave. The latter injuries may not be as apparent, such as closed-head brain injury and internal lung and other organ damage. As a VA physician treating these injuries told the Veterans’ Disability Benefits Commission, such impairments may be underestimated (Scott, 2005).7 Given the unprecedented combination of severe injuries distinctive of combat in southwest Asia, VBA may want to reassess the ability of the Rating Schedule and rating process to evaluate blast injuries to the brain and other internal organs and to rate the disability caused by interaction of impairments in multiple body systems.
THE VETERAN POPULATION
There are approximately 24 million living veterans of active duty in the U.S. military. VA expects this number to fall to less than 15 million over the next 25 years, barring a large increase in troop levels (Figure 2-1).8 As the number of veterans declines, the average age increases. The median age of veterans is 60 years, up from 57 as recently as 2000 (VA, 2001b, 2006b).
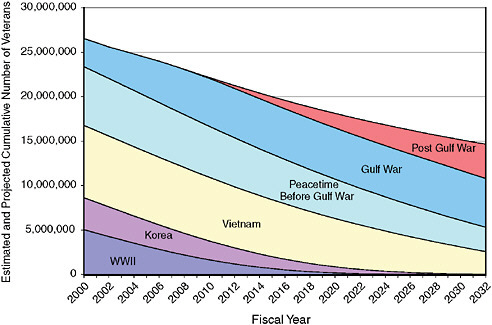
FIGURE 2-1 Estimated and projected cumulative number of veterans by period of service, FY 2000–FY 2032.
NOTES: Veterans of more than one period are counted in the latest period in which they served; for example, veterans who served in WWII, Korea, and Vietnam are counted as part of the Vietnam era service period. Gulf War includes veterans from the beginning of the first Gulf War in 1990 through 2007. Post Gulf War includes new veterans in 2008 and later. This means that individuals who served in OEF/OIF are counted as Gulf War veterans if they separate from service before 2008 and as Post Gulf War veterans if they separate in 2008 or later.
SOURCE: IOM (2007).
The number of veterans ages 65 and older is expected to increase in the near future but begin to decrease within 10 years, from 9.2 million in 2012 to 6.7 million in 2032. They will constitute a larger percentage of living veterans, however, increasing from 39 to 46 percent of the total between 2007 and 2017, before declining slightly to 45 percent in 2032 (Figure 2-2).
VA expects the percentage of women veterans to double during the next 25 years, from the current 7 percent to 14 percent in 2032. The percentage of non-Hispanic white veterans, currently 80 percent of living veterans, is projected to decrease to 71 percent by 2032. The percentages of Hispanic, non-Hispanic black, and other minority veterans would increase in the same time period, from 5 to 9 percent, 10 to 15 percent, and 3 to 5 percent, respectively (IOM, 2007).
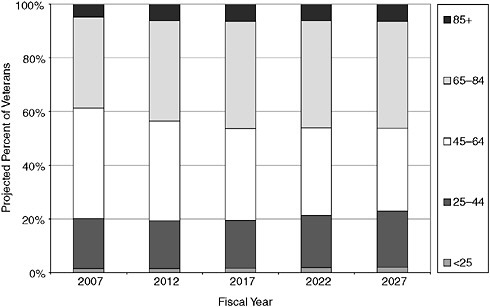
FIGURE 2-2 Projected percentages of veterans by age group, FY 2007–FY 2032.
SOURCE: IOM (2007).
VA does not forecast the number of veterans it expects to apply for or be granted disability benefits beyond the next few years, but experience has shown that more recent veterans tend to apply at higher rates, and that the percentage of veterans service connected for disability compensation has been increasing accordingly. Approximately 12 percent of the veterans who served during the Gulf War era (i.e., since August 1990) had been granted a service-connected disability rating when OEF was launched in Afghanistan in October 2001, compared with 9.5 percent of Vietnam era veterans and 10.4 percent of World War II veterans (VA, 2002). As of the end of May 2006, approximately 105,000 veterans of the current wars in Iraq and Afghanistan had been granted disability compensation—about 18 percent of those who had separated from service at that time (VA, 2006a).9 Thus the number of veterans service connected for disability compensation is increasing, although the overall number of veterans is decreasing. In FY 2000, when there were 27 million veterans, 2.3 million were receiving disability compensation. The annual number of claims received for service-
connected compensation, which was 579,000 in FY 2000, reached 806,000 in FY 2006. In 2008, when VA estimates there will be 23 million veterans (13 percent fewer than in 2000), 2.9 million are expected to be receiving compensation (25 percent more than in 2000).
THE POPULATION OF VETERANS WITH DISABILITIES
In FY 2006, about 2.7 million veterans were receiving $26.5 billion monthly in disability compensation from VA. VA estimates that compensation payments to veterans will increase to about $32.4 billion in FY 2008, when there will be an estimated 2.9 million beneficiaries. Compensation per veteran is expected to average $11,258 in 2008, up from $9,864 in 2006 (VA, 2007a).10
Period of Service
Of the 2.3 million veterans with service-connected disabilities at the end of FY 2000, the largest group was Vietnam era veterans, followed by (in descending order) veterans serving in peacetime, World War II, the Gulf War, and the Korean conflict. This composition is expected to change substantially by 2008, when the number of Gulf War veterans is expected to have increased by 160 percent, while the number of World War II and Korean War veterans is expected to fall by 19 and 3 percent, respectively (Figure 2-3). As a result, Gulf War veterans will constitute 29 percent of service-connected beneficiaries in 2008, compared with 14 percent in 2000.
Age
In FY 2005, more than half of the 2.6 million veterans with service-connected disabilities were older than age 55 (Figure 2-4). Most of the rest were between ages 36 and 55. Only 8 percent were ages 35 or younger. The median age was 60 in FY 2006, compared with 59 in FY 2000 (VA, 2006b).
Disability Rating Levels
Each condition for which a veteran receives VA disability compensation is given a rating, expressed as a percentage between 0 and 100 in increments of 10; higher ratings are intended to reflect greater severity than lower
|
10 |
This does not include ancillary benefits, as described in Chapter 6, for which veterans with service-connected disabilities may be eligible. |
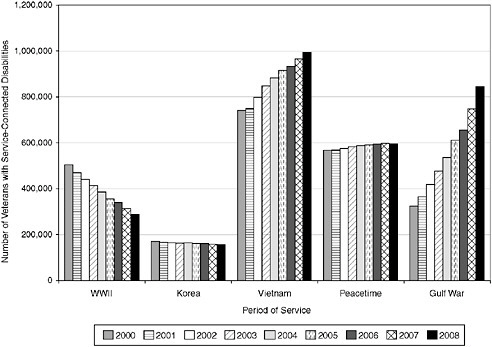
FIGURE 2-3 Number of veterans with service-connected disabilities, by period of service, FY 2000–FY 2008.
NOTE: Gulf War veterans are those who served on or since August 2, 1990, including veterans of OEF/OIF.
SOURCES: VA (2001b, 2002, 2003, 2004a, 2005b, 2006b, 2007a).
ratings. Conditions can be rated 0 percent when they have been determined by VA to be service connected and disabling, but not to the extent that they would affect an average veteran’s ability to work.11 If a veteran has more than one rated condition, VA calculates a combined percentage intended to represent the net impact of the multiple conditions on the veteran. For example, a 40 percent rating and a 20 percent rating result in a combined rating of 50 percent. The combined rating level determines the amount of monthly compensation. (The procedure for combining ratings is described in Chapter 4.)
|
11 |
Technically, as will be explained in Chapter 3, veterans rated 0 percent disabled have minor impairments that are not considered to be disabling on average. For example, the most common impairments rated 0 percent are minor hearing loss, hemorrhoids, and scars. Similarly, someone who has lost both legs but is a successful lawyer or teacher is rated 100 percent for the severity of his or her impairment, rather than 0 percent for lack of disability. |
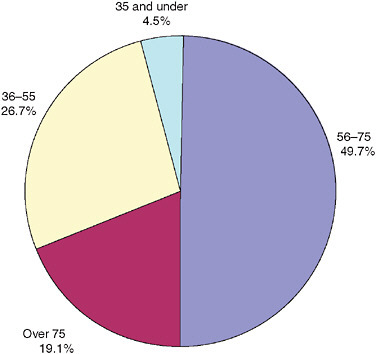
FIGURE 2-4 Veterans receiving disability benefits by age range, FY 2005 (percentages).
SOURCE: VA (2006b).
In FY 2005, veterans with disabilities were being compensated for approximately 7.7 million separate conditions that VA considered disabling, an average of about 3 each. The largest group of the 2.6 million veterans with disabilities had a combined rating of 10 percent (30 percent), followed by those with a 20 percent rating (15 percent). Fewer than 10 percent were rated totally (100 percent) disabled (Figure 2-5).
The distribution of rating levels by individual condition is quite different. Of the total of 7.7 million conditions, the largest number is rated 10 percent, followed by conditions rated at 0 percent. Only 3 percent are rated 100 percent (Figure 2-6).
The Most Prevalent Disabling Conditions
There are two ways to consider prevalence of disabilities, either by the major (i.e., highest-rated) condition of each individual veteran or by the
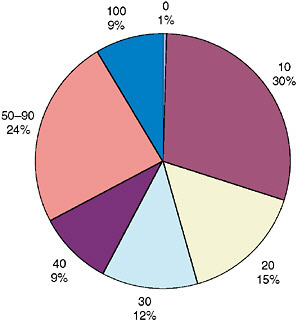
FIGURE 2-5 Veterans by combined rating level, FY 2005 (percentages).
SOURCE: VA (2006b).
7.7 million separate conditions the 2.7 individual veterans have among them. In FY 2005, posttraumatic stress disorder (PTSD) was the major diagnosis for the largest number of veterans, or 203,000, followed by diabetes mellitus and tinnitus, each with 102,000 (left half of Table 2-1).12 PTSD, diabetes, and tinnitus together were the major diagnosis for 15 percent of service-connected veterans in FY 2005. The three conditions were much less prominent 10 years earlier, however, when they were ranked 9th, 22nd, and 14th, respectively, as major diagnoses, and accounted for less than 5 percent of the veterans with disabilities (VA, 1995). (In FY 1995, the three most prevalent major conditions were impairment of the knee other than ankylosis, generalized anxiety disorder, and lumbosacral strain,
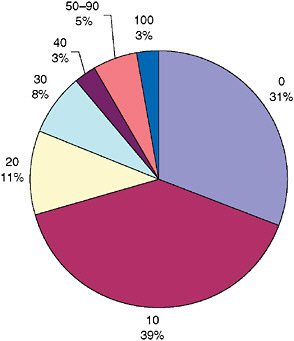
FIGURE 2-6 Disabling conditions by rating level, FY 2005 (percentages).
NOTE: These are the 7.7 million separate conditions for which the 2.7 million service-connected veterans have been rated.
SOURCE: Appendix Table 2-1.
which together accounted for 11 percent of veterans with disabilities at that time.)
The most numerous service-connected conditions in FY 2005 were defective hearing (354,000 ratings), tinnitus (340,000 ratings), and orthopedic conditions for which there was no diagnostic code (300,000 ratings); they were rated using the code for a similar, or “analogous,” condition (right half of Table 2-1). These conditions ranked higher because they tend to have lower ratings such as 10 or 0 percent, and while many veterans have these lower ratings, they also have higher ratings for other conditions. For example, 354,000 veterans were rated for impaired hearing, but only 71,000 had it as their highest-rated condition.
Another point of comparison is the prevalence of the same conditions in the general population, although one should bear in mind that some or many veterans may have impairments (e.g., tinnitus, diabetes, PTSD) that are not service connected or for which, if service connected, applications for benefits have not been submitted, making the comparison inexact. The
TABLE 2-1 Number of Veterans and Number of Rated Conditions, by Diagnostic Code, End of FY 2005
|
|
Number of Veterans by Major Condition |
Number of Conditions Rated per Diagnostic Code |
||
|
Rank |
Major Condition (Diagnostic Code) |
Number of Veterans |
Condition (Diagnostic Code) |
Number of Conditions |
|
1 |
PTSD (9411) |
203,378 |
Defective hearing (6100–6110) |
353,897 |
|
2 |
Diabetes mellitus (7913) |
101,883 |
Tinnitus (6260) |
339,573 |
|
3 |
Tinnitus (6260) |
101,758 |
Analogous to an orthopedic diagnostic code (5299) |
300,098 |
|
4 |
Knee, other impairment of (5257) |
98,662 |
Scars, other (7805) |
283,337 |
|
5 |
Arthritis, due to trauma (5010) |
98,132 |
Arthritis, due to trauma (5010) |
272,047 |
|
6 |
Intervertebral disc syndrome (5293) |
86,469 |
PTSD (9411) |
244,876 |
|
7 |
Analogous to an orthopedic diagnostic code (5299) |
75,628 |
Knee, other impairment of (5257) |
235,158 |
|
8 |
Sacroiliac injury and weakness (5295) |
74,644 |
Diabetes mellitus (7913) |
220,532 |
|
9 |
Defective hearing (6100–6110) |
70,915 |
Hypertensive vascular disease (7101) |
193,055 |
|
10 |
Hypertensive vascular disease (7101) |
57,252 |
Arthritis, degenerative, hypertrophic, or osteoarthritis (5003) |
162,004 |
|
|
All diagnostic codes |
2,636,979 |
All diagnostic codes |
7,675,811 |
|
SOURCE: VA (2005c). |
||||
12-month prevalence of PTSD in U.S. adults ages 18 and older is estimated to be 3.5 percent (Kessler et al., 2005a). The estimated lifetime prevalence of PTSD is 6.8 percent (Kessler et al., 2005b). The baseline analysis of the Millennium Cohort found that the prevalence of PTSD among veterans was 2.4 percent, although it was between 3.5 and 3.8 percent among some subgroups—those without a high school diploma, ages 17–24, or who served
4 years or less (Riddle et al., 2007).13 Recent studies have found higher rates of PTSD among OEF/OIF veterans, probably because of their younger age and other demographic risk factors, and because of greater exposure to combat and to dead and wounded servicemembers and civilians than the Millenium Cohort (Hoge et al., 2004; Seal et al., 2007).14 The 245,000 veterans service connected for PTSD in 2005 constituted 1 percent of all veterans at that time (VA, 2006d).
The prevalence of diabetes among U.S. adults ages 20 and older is 9.6 percent (NIDDK, 2005). The 2001 National Survey of Veterans found that 11.2 percent of veterans in the sample were being treated for diabetes with insulin or diet (VA, 2001a:Table 5-16). The number of veterans service connected for diabetes in 2005 was 202,000, or 0.8 percent of all veterans (VA, 2006d).
Between 10 and 15 percent of U.S. adults have prolonged tinnitus requiring medical evaluation (Heller, 2003). In the 1994 National Health Interview Survey, 29 percent of veteran respondents reported having chronic (lasting three months or more) tinnitus, compared with 15 percent of non-veterans (Hoffman and Reed, 2004). The 340,000 veterans service connected for tinnitus constitute 1.4 percent of all veterans (VA, 2006d).
Conditions Rated 100 Percent
Three conditions are the major diagnosis for half the veterans rated 100 percent: PTSD (26 percent), schizophrenia (19 percent), and malignancies of the genitourinary system (e.g., prostate cancer) (5 percent) (Figure 2-7).
The major diagnoses most likely to be associated with combined ratings of 100 percent are relatively rare, except for loss of, or loss of use of, both feet. They include loss of, or loss of use of, two or more limbs; loss of, or blindness in, both eyes; renal diseases; certain cancers; and schizophrenia and other psychoses. All or nearly all veterans with these conditions as their major diagnosis are rated 100 percent.
Conditions by Period of Service
Prevalence and distribution of disabling conditions vary somewhat by service period, reflecting age and other differences, such as attitudes about
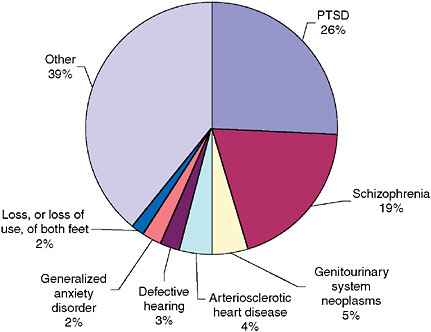
FIGURE 2-7 Service-connected veterans with 100 percent combined rating, by major diagnosis, end of FY 2005 (percentages).
NOTE: Schizophrenia combines codes 9200–9205; defective hearing combines codes 6100–6110; and loss, or loss of use, of both feet combines 5107 and 5710.
SOURCE: VA (2005c).
admitting to having mental illness. Prevalence is also affected by decisions to make certain conditions presumptive for compensation, such as diabetes among veterans who served in Vietnam. Although World War II veterans are age 80 or older, they have the least number of service-connected conditions. The average number of conditions currently being compensated for is 2.0 for World War II, 2.2 for Korea, 3.0 for Vietnam, and 3.7 for Gulf War veterans (i.e., veterans since 1990) (VA, 2006b) (Figure 2-8).15
Hearing impairments are very prevalent among veterans of all periods of service. In FY 2005, tinnitus ranked among the top five most prevalent service-connected conditions for all periods of service, and defective hearing ranked among the top five in all periods except the Gulf War (Appendix Table 2-2).
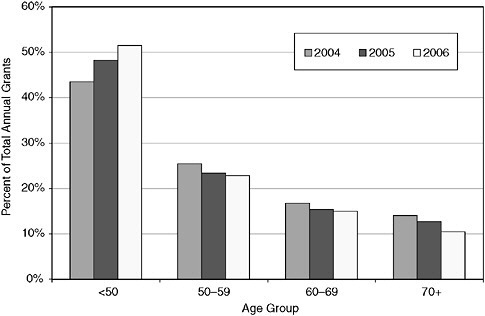
FIGURE 2-8 Percent of conditions granted service connection or higher rating, by age group, calendar year (CY) 2004–CY 2005.
NOTE: The absolute number of grants to veterans younger than age 50 increased by 29 percent (from 315,000 to 406,000) between 2004 and 2006, while the number of grants to older veterans stayed about the same (ages 50–59 and 60–69) or declined (age 70 or older).
SOURCE: IOM (2006).
Other conditions are more prevalent in particular periods of service. Residuals of frozen feet, or immersion foot, were the second and third most common conditions among veterans of World War II and Korea, respectively, but this condition is rare among veterans of other periods. Diabetes and PTSD are the first and second most prevalent disorders among Vietnam veterans, but these conditions are not among even the 10 most prevalent conditions among veterans of other periods. Musculoskeletal conditions are the most prevalent disorders among Gulf War and peacetime veterans, along with hearing impairment.
Women Veterans
Between 1990 and 2000, the population of women veterans increased by one-third, from 1.2 to 1.6 million. There were 1.7 million women veterans at the end of FY 2005, representing approximately 7 percent of
the total veteran population. By the year 2015, more than 9 percent of the veteran population is projected to be women (VA, 2004b).
Data on the total number of women receiving VA disability compensation is not reported. For the years 2004 through 2006, however, women veterans were granted compensation for 235,600 conditions, 10 percent of all grants for compensation made during those three years (IOM, 2006). Women were more likely to be younger and be Gulf War veterans than men. Most (84 percent) of the grants to women for disability compensation made during 2004–2006 were to women younger than age 50, and 78 percent were to Gulf War veterans (the comparable figures for men granted disability compensation were 41 and 45 percent, respectively).
Several of the conditions most frequently granted compensation among women between 2004 and 2006 were also the most frequently granted among men. For example, lumbosacral or cervical strain, limitation of flexion of leg, degenerative arthritis of the spine, limited motion of the ankle, and arthritis due to trauma were among the 20 most frequently service-connected conditions for both women and men (Appendix Table 2-3).
Certain disabilities were more prevalent among men, and others among women. Defective hearing and diabetes mellitus were the second and third most frequently granted conditions among men, but these conditions were not among the 20 most frequently service-connected conditions in women. Migraine, major depressive disorder, allergic or vasomotor rhinitis, flatfoot, asthma, and hallux valgus (bunion deformity) were more prevalent in women than in men.
RECENT TRENDS
VA provided the committee with data on disability compensation decisions made during CY 2004, CY 2005, and CY 2006. These data are more detailed than data available before 2004, when Rating Board Automation 2000, the Compensation and Pension (C&P) Service’s computerized management information system, became fully operational.
In the three-year period from 2004 through 2006, C&P Service raters decided on compensation for 5.2 million conditions—whether they should be service connected if new, or whether they should be given a higher rating if previously service connected (Table 2-2). They granted (and assigned a rating to) 45 percent of the new conditions claimed and approved a higher rating level for 35 percent of the already service-connected conditions.
The grant rate varied somewhat by the age, sex, and period of service of the veteran claiming the condition. On average, women veterans were slightly more likely to receive a favorable decision. Younger veterans (under age 50) were more likely to have their conditions service connected but not to receive a higher rating of an earlier service-connected condition. Veterans
TABLE 2-2 Disability Compensation Decisions on and Grants of Service Connection and Higher Ratings, CY 2004–CY 2006
|
Service-Connected Veterans |
Service Connection |
Higher Rating |
Total |
|||
|
Decisions |
Grants (%) |
Decisions |
Grants (%) |
Decisions |
Grants (%) |
|
|
All |
4,313,860 |
1,947,027 (45%) |
926,263 |
327,543 (35%) |
5,240,123 |
2,274,570 (43%) |
|
Men |
3,716,252 |
1,673,947 (45%) |
796,580 |
283,430 (36%) |
4,512,832 |
1,957,377 (43%) |
|
Women |
444,875 |
207,909 (47%) |
69,523 |
24,740 (40%) |
514,398 |
235,649 (46%) |
|
Unknown |
152,733 |
65,171 (43%) |
60,160 |
19,373 (32%) |
212,893 |
84,544 (40%) |
|
Age <50 |
1,994,176 |
997,570 (50%) |
260,302 |
91,163 (35%) |
2,254,478 |
1,088,733 (48%) |
|
50–59 |
1,092,450 |
438,987 (40%) |
288,699 |
102,893 (36%) |
1,381,149 |
541,880 (39%) |
|
60–69 |
694,794 |
289,455 (42%) |
186,171 |
66,931 (36%) |
880,965 |
356,386 (41%) |
|
70 or older |
519,376 |
215,590 (42%) |
186,540 |
65,372 (35%) |
705,916 |
280,962 (40%) |
|
Unknown |
13,064 |
5,425 (42%) |
4,551 |
1,184 (26%) |
17,615 |
6,609 (38%) |
|
WW II |
201,437 |
88,538 (44%) |
72,739 |
24,551 (34%) |
274,176 |
113,089 (41%) |
|
Korea |
110,119 |
50,890 (46%) |
36,627 |
12,674 (35%) |
146,746 |
63,564 (43%) |
|
Vietnam |
1,222,142 |
540,350 (44%) |
333,314 |
121,448 (36%) |
1,555,456 |
661,798 (43%) |
|
Peacetime |
882,988 |
343,158 (39%) |
279,247 |
97,854 (35%) |
1,162,235 |
441,012 (38%) |
|
Gulf War |
1,896,602 |
924,089 (49%) |
200,044 |
69,236 (35%) |
2,096,646 |
993,325 (47%) |
|
Unknown |
571 |
1 (0%) |
4,292 |
1,780 (42%) |
4,863 |
1,781 (37%) |
|
SOURCE: IOM (2006). |
||||||
of peacetime periods were less likely to have a new condition service connected than veterans of other periods, while Gulf War veterans were more likely to have a condition service connected. The rate of grants of higher ratings did not vary by age group or service period.
Veterans younger than age 50 not only had the largest number of disability issues granted during the period 2004–2006 (Table 2-2), but their share of grants increased each year relative to the older age groups. The pattern was similar for Gulf War veterans (Figure 2-9).
Claims were evaluated for almost 1 million veterans age 70 or older between 2004 and 2006. This constituted about 13 percent of the total claims filed. Reasons for older veterans applying for VA disability compensation may include increased disability with aging, increased ratings of already service-connected disabilities, and opening of new claims reflective of degenerative problems.
During 2004–2006, the most common disabling conditions considered by raters were defective hearing, tinnitus, PTSD, lumbosacral strain, and diabetes, which accounted for 26 percent of the decisions (left side of Table 2-3). The conditions that were granted service connection or higher rating were the same five, in different order: tinnitus, defective hearing,
FIGURE 2-9 Percent of conditions granted service connection or higher rating, by period of service, CY 2004–CY 2006.
SOURCE: IOM (2006).
TABLE 2-3 10 Conditions with the Highest Number of Decisions and 10 Most Common Conditions for Which Veterans Were Granted Disability Compensation, CY 2004–CY 2006
|
|
Decisions on Disability Compensation by Diagnosis |
Grants of Disability Compensation by Diagnosis |
||
|
Rank |
Diagnosis (Diagnostic Code) |
Number of Decisions |
Diagnosis (Diagnostic Code) |
Number of Grants |
|
1 |
Defective hearing (6100) |
419,323 |
Tinnitus (6260) |
178,608 |
|
2 |
Tinnitus (6260) |
304,773 |
Defective hearing (6100) |
165,476 |
|
3 |
PTSD (9411) |
257,191 |
PTSD (9411) |
115,478 |
|
4 |
Lumbosacral or cervical strain (5237) |
288,088 |
Diabetes mellitus (7913) |
100,796 |
|
5 |
Diabetes mellitus (7913) |
178,126 |
Lumbosacral or cervical strain (5237) |
78,388 |
|
6 |
Hypertensive vascular disease (7101) |
162,953 |
Hypertensive vascular disease (7101) |
60,329 |
|
7 |
Limitation of flexion of leg (5260) |
112,353 |
Degenerative arthritis of the spine (5242) |
54,036 |
|
8 |
Limited motion of the ankle (5271) |
102,141 |
Limitation of flexion of leg (5260) |
49,492 |
|
9 |
Knee impairment other than ankylosis (5257) |
101,342 |
Paralysis of sciatic nerve (8520) |
46,402 |
|
10 |
Eczema (7806) |
88,558 |
Limited motion of ankle (5271) |
41,923 |
|
|
All diagnostic codes |
5,240,141 |
All diagnostic codes |
2,274,588 |
|
SOURCE: IOM (2006). |
||||
PTSD, diabetes, and lumbosacral strain (right side of Table 2-3). They accounted for 28 percent of the grants made in that three-year period.
Five conditions accounted for almost half (48 percent) of the 58,000 conditions that were service connected and rated 100 percent during CY 2004–CY 2006: malignant neoplasms of the genitourinary system (prostate cancer), malignancies of the respiratory system (lung cancer), PTSD, arteriosclerotic heart disease, and loss of use of both feet (left side of Table 2-4). Lung and prostate cancer and arteriosclerotic heart disease are related to age, while PTSD and loss of use of both feet are more likely to be related to recent service. Other age-related disabilities in the 20 most numerous condi-
TABLE 2-4 10 Most Common Diagnoses for Which Veterans Were Granted Service Connection and Rated 100 Percent, CY 2004–CY 2006
tions rated 100 percent include leukemia, lymphomas, and other cancers; hip and knee replacements; coronary artery bypass surgery; myocardial infarction; and stroke. Some if not many of the cases of renal disorders and dialysis are probably long-term manifestations of diabetes.
The most numerous conditions service connected and rated 100 percent among Gulf War veterans were (in descending order) PTSD, loss of use of both feet, malignant neoplasms of the genitourinary system, major depressive disorder, and impairment of sphincter control (right side of Table 2-4). The 20 most numerous conditions rated 100 percent include more that might be related to recent service in a war zone (e.g., PTSD, loss of use of both feet, major depression, dementia associated with brain trauma, loss of use of both hands, and brain hemorrhage), but they still include a large number of age-related conditions (e.g., prostate and lung cancers, hip and knee replacements, and arteriosclerosis).
VETERANS OF THE WARS IN AND AROUND AFGHANISTAN AND IRAQ
The Department of Defense (DoD) reported that, as of early March 2007, more than 25,000 U.S. servicemembers had been wounded in action in or around Afghanistan or in Iraq.16 Almost 7,700 servicemembers in OEF/OIF required medical air transport between September 2001 and February 2007 (Embrey, 2007). Of the 25,000 wounded in action in OEF/OIF, the majority (55 percent) were able to return to duty within 72 hours.17
Most of the wounded in action in OEF/OIF have been young—30 percent younger than age 22, 25 percent from ages 22 to 24, and 23 percent from ages 25 to 30 (DoD, 2007c). The main source of injury in Iraq has been from explosive devices, such as improvised explosive devices, suicide bombs, and landmines (68 percent of injuries), and from mortar, rocket, or other artillery fire (11 percent of injuries) (DoD, 2007d).18
DoD does not provide figures on the number injured or ill in addition to those wounded in action, but reported that in addition to those wounded in action in OEF/OIF, more than 8,000 servicemembers required medical air transport for nonbattle injuries, and 22,600 because of disease or other medical causes (Embrey, 2007).
VA’s claims-processing data system cannot separate out veterans who have served in OEF/OIF. They are included within a broader category of
|
16 |
See http://www.defenselink.mil/news/casualty.pdf (accessed March 9, 2007). Iraq figures were as of March 8, 2007; OEF figures were as of March 3, 2007. |
|
17 |
See footnote 19. |
|
18 |
The percentages are based on the number of wounded for whom the cause was known as of February 10, 2007 (17,500 of the 23,500 wounded). |
Gulf War era veterans who have served in the period beginning with the start of the first Gulf War on August 2, 1990. Statistics on this group were presented in the previous section of this chapter.
VA has some information on OEF/OIF veterans obtained by comparing the names of discharged servicemembers who had been deployed to OEF/ OIF with the names of claimants for compensation and pension benefits. According to a November 2006 report from VBA’s Office of Performance Analysis and Integrity, 1,324,000 servicemembers had been deployed to OEF/OIF from September 11, 2001, through August 31, 2006. Nearly three-quarters were active duty servicemembers; 28 percent were from the reserves.
Of those deployed, 634,000 had been discharged by the end of August 2006. This group of veterans had filed 176,111 claims for compensation and pension benefits. Of the 136,000 claims that had been decided, service connection of one or more disabilities had been granted in 120,000 cases (88 percent). The claims of 16,000 veterans had been denied on all issues. As of the end of August, nearly 40,000 claims were pending adjudication.
Most (55 percent) of the service-connected veterans of OEF/OIF were granted a combined rating of 20 percent or less; 21 percent were rated 50 percent or higher. Compared with all veterans with disabilities, OEF/OIF veterans are rated lower on average (Figure 2-10). They are far more likely to have a combined rating of 0 percent and much less likely to have a rating of 70 to 100 percent. This reflects their age and their recent military service separation. As they become older and their impairments worsen, they will be able to apply for higher ratings.
The most common disabling conditions for OEF/OIF veterans were tinnitus and hearing loss, PTSD, and musculoskeletal conditions (Table 2-5).
VA reported only the 10 most numerous disability conditions at all combined rating degrees; the most numerous conditions rated 100 percent are unknown. The number of seriously wounded veterans, the nature of their disabilities, and how they have fared in the disability claims process is not known, except from scattered reports. VA’s Office of Research and Development reported that from the time the OEF/OIF conflicts began through January 2006, almost one-third (more than 600) of servicemembers with battlefield injuries severe enough to warrant evacuation from Iraq to the Walter Reed Army Medical Center had traumatic brain injury, and the majority of these cases were blast-related (VA, 2007b). According to a poster presented by a VA researcher at a conference in November 2006, the four VA polytrauma rehabilitation centers had treated 566 active duty servicemembers during the first four years of OEF/OIF, 188 of whom were injured in OEF/OIF. A little more than half of the OEF/OIF servicemembers had been wounded by blasts, the rest by other means such as gunshots and vehicular crashes. The primary injury in both groups was head trauma,
FIGURE 2-10 Distribution of service-connected OEF/OIF veterans and all service-connected veterans by combined rating degree.
NOTE: Figures for OEF/OIF veterans are as of August 30, 2006; figures for all veterans are as of September 30, 2005.
SOURCE: VA (2006a,b).
but soft-tissue wounds and burns, eye, otologic, oral/maxillofacial, and penetrating brain injuries were more common in the group injured by blasts than in the group suffering non-blast injuries. Cognitive impairments, pain, psychiatric symptoms, problems with balance and motor function, and other impairments were prevalent in both groups, but blast-injured servicemembers were more likely to have hearing loss, tinnitus, and PTSD symptoms (Sayer et al., 2006).19
According to the head of Disabled American Veterans, as of February 2007, there were 553 amputees from OIF/OEF who had lost one or more arms, legs, hands, and/or feet. Almost a quarter (128) suffered multiple amputations (U.S. Congress, Senate and House of Representatives, Com-
TABLE 2-5 Most Common Conditions of Veterans of the Afghanistan and Iraq Wars, 2001–2006
|
Diagnostic Code |
Condition |
Number of Grants |
|
6260 |
Tinnitus |
35,871 |
|
5237 |
Lumbosacral or cervical strain |
32,733 |
|
6100 |
Defective hearing |
28,907 |
|
5299 |
Conditions analogous to musculoskeletal impairments listed in the VA Rating Schedule |
23,892 |
|
5271 |
Limited motion of the ankle |
16,454 |
|
9411 |
PTSD |
16,131 |
|
5260 |
Limitation of flexion of leg |
15,335 |
|
5257 |
Limitation of knee other than ankylosis |
12,048 |
|
5201 |
Limitation of motion of arm |
11,337 |
|
7101 |
Hypertensive vascular disease |
11,303 |
|
SOURCE: VA (2006a). |
||
mittees on Veterans’ Affairs, 2007a). More than 400 OEF/OIF veterans had suffered major burns by 2006 (Kupersmith, 2006).20
According to March 2007 testimony from Blinded Veterans of America, 16 percent of all casualties evacuated from Iraq between March 2003 and April 2005 had eye injuries. Walter Reed Army Medical Center had surgically treated about 690 soldiers for blindness or moderate to severe significant visual injuries. The National Naval Medical Center had surgically treated approximately 450 traumatic eye injuries (U.S. Congress, Senate and House of Representatives, Committees on Veterans’ Affairs, 2007b).
Another source of information on the potential disability status of OEF/ OIF veterans is the types of conditions for which they seek health care at the Veterans Health Administration (VHA). According to the latest analysis of those data, as of the end of August 2006, 205,097 (32 percent) of the 631,174 OEF/OIF military personnel who had separated from service and become veterans had sought VA health care for a current health problem (VA, 2006c). Most of those who sought care were male, were between the ages of 20 and 29, and had separated from the Army. About equal numbers were former active duty and reserve or National Guard members.
OEF/OIF veterans filed disability claims with VHA for a wide variety of conditions (Appendix Table 2-4). The largest percentage of conditions matched ICD-9 codes that belonged within the category of diseases of the musculoskeletal and connective system (43 percent), followed by mental
disorders (36 percent), and symptoms, signs, and ill-defined conditions without an immediately obvious cause or with laboratory abnormalities that cannot be coded elsewhere in the ICD-9 (33 percent).
A total of 73,157, or about one-third of, OEF/OIF veterans received a diagnosis of a possible mental disorder (Appendix Table 2-5). The most common diagnosis was PTSD (33,754), followed by non-dependent abuse of drugs (28,732), and depressive disorders (23,462).21
Although these statistics are suggestive, they do not mean that, for example, 36 percent of all OEF/OIF veterans have diagnosable mental disorders. Veterans who seek care at VA are self-selected. If very sick, they are perhaps unemployed or underemployed and lacking health insurance, which they do not need for VA services.
Of OIF soldiers who completed post-deployment health assessments between May 1, 2003, and April 30, 2004, 19 percent reported a mental health concern, compared with 11 percent of soldiers returning from Afghanistan and 9 percent of soldiers returning from other locations. OIF veterans whose post-deployment health was reassessed three to six months after deployment showed even higher rates of mental health concerns; 35 percent reported some kind of mental health concern on at least one general screening question related to PTSD, depression, alcohol use, relationship/interpersonal concerns, or suicidal ideation. Data from the Army’s health-care system show that 35 percent of soldiers who returned from Iraq accessed military mental health services at some time during the first year after return, most often within the first two months. Twelve percent of all soldiers who returned from OIF were diagnosed with a mental health problem within the first year after return (U.S. Congress, House of Representatives, Committee on Veterans’ Affairs Subcommittee on Health, 2006).
CONCLUSION
Veterans likely to seek disability compensation from VA currently and in the future are a diverse group. Some are veterans of the current wars in Afghanistan and Iraq, and most of them are young. If the wars end soon, and if the same percentage of those deployed as those who were in the first Gulf War leave active service within 10 years (67 percent), and the same percentage of those who have left active service apply for disability compensation as did veterans of the first Gulf War as of September 30, 2001 (about 33 percent), VA can expect to receive about 290,000 claims from veterans of OEF/OIF. The number is likely to be larger, because a higher percentage (28 percent) of the deployed servicemembers have been activated
from the National Guard and reserves than in the first Gulf War. (At this point, 48 percent of those deployed to OEF/OIF have left the service, and 28 percent of them have filed claims for disability compensation.)
If this group continues to have the same impairments as it has had to date, most claims that will be adjudicated will be for hearing problems, musculoskeletal impairments, and mental disorders, especially PTSD. However, the majority of veterans will continue to be from earlier periods of service and, therefore, will be approaching middle or advanced age. They will be filing reopened claims as their service-connected conditions become worse and new conditions appear, either secondary to already service-connected conditions or made presumptive by legislation or regulation. The percentage of reopened claims has declined from 75 percent in 2000, but is still two-thirds of all claims. This means that VA will continue to receive a substantial number of claims for cardiovascular conditions, cancers, diabetes and its complications, deteriorating hearing and vision, joint replacements, and other problems associated with advancing age. Claims for such conditions are likely to continue to increase in number as evaluation tools improve and problems are detected earlier. In addition, there will be a relatively small but important set of mostly younger veterans with multiple impairments, including traumatic brain injuries, which must be adequately evaluated and rated.
REFERENCES
ATA (American Tinnitus Association). 2007. About tinnitus. http://www.ata.org/about_tinnitus/ (accessed May 14, 2007).
DoD (Department of Defense). 2007a. Global war on terrorism [casualties] by reason, October 7, 2001, through February 10, 2007. http://siadapp.dior.whs.mil/personnel/CASUALTY/gwot_reason.pdf (accessed March 9, 2007).
DoD. 2007b. Military casualty information. http://siadapp.dior.whs.mil/personnel/CASUALTY/castop.htm (accessed March 6, 2007).
DoD. 2007c. Military casualty information. http://siadapp.dior.whs.mil/personnel/CASUALTY/OIF-Wounded-After.pdf and http://siadapp.dior.whs.mil/personnel/CASUALTY/OEFWIA.pdf (accessed March 9, 2007).
DoD. 2007d. Military casualty information. http://siadapp.dior.whs.mil/personnel/CASUALTY/gwot_reason.pdf (accessed March 9, 2007).
DVBIC (Defense and Veterans Brain Injury Center). 2007. Blast injury FAQs. http://www.dvbic.org/blastinjury.html (accessed March 12, 2007).
Embrey, E. P. 2007. Force health protection. PowerPoint presentation by the Deputy Assistant Secretary of Defense for Force Health Protection and Readiness. http://www.amsus.org/sm/presentations/Feb07-B.ppt#293,1,ForceHealthProtection (accessed March 14, 2007).
Heller, A. J. 2003. Classification and epidemiology of tinnitus. Otolaryngology Clinics of North America 36(2):239–248.
Hoffman, H. J., and G. W. Reed. 2004. Epidemiology of tinnitus. In Tinnitus: Theory and management, edited by J. B. Snow, Jr. Hamilton, Ontario, Canada: B. C. Decker. Pp. 16–41.
Hoge, C. W., C. A. Castro, S. C. Messer, D. McGurk, D. I. Cotting, and R. L. Koffman. 2004. Combat duty in Iraq and Afghanistan, mental health problems, and barriers to care. New England Journal of Medicine 351(1):13–22.
IOM (Institute of Medicine). 2006. Staff analyses of claims data provided by VA, December 19, in response to Data Request 07-042, submitted by the Veterans’ Disability Benefits Commission.
IOM. 2007. Staff analyses of data from VetPop2004 Version 1.0 State and National Tables, Table 2L. http://www.va.gov/vetdata/docs/VP2004B.htm (accessed March 1, 2007).
Kessler, R. C., W. T. Chiu, O. Demler, and E. E. Walters. 2005a. Prevalence, severity, and comorbidity of twelve-month DSM-IV disorders in the National Comorbidity Survey Replication (NCS-R). Archives of General Psychiatry 62(6):617–627.
Kessler, R. C., P. A. Berglund, O. Demler, R. Jin, K. R. Merikangas, and E. E. Walters. 2005b. Lifetime prevalence and age-of-onset distributions of DSM-IV disorders in the National Comorbidity Survey Replication (NCS-R). Archives of General Psychiatry 62(6):593–602.
Kupersmith, J. 2006. Global conflicts: Implications for VA research. PowerPoint presentation by the Chief Research and Development Officer, Veterans Health Administration, VA. http://www.academyhealth.org/2006/kupersmith.pdf (accessed March 9, 2007).
NIDDK (National Institute of Diabetes and Digestive and Kidney Diseases). 2005. National Diabetes Statistics. http://diabetes.niddk.nih.gov/dm/pubs/statistics/#7/ (accessed May 18, 2007).
Riddle, J. R., T. C. Smith, B. Smith, T. E. Corbeil, C. C. Engel, T. S. Wells, C. W. Hoge, J. Adkins, M. Zamorski, and D. Blazer. 2007. Millennium Cohort: The 2001–2003 baseline prevalence of mental disorders in the U.S. military. Journal of Clinical Epidemiology 60(2):192–201.
Ryan, M. A., T. C. Smith, B. Smith, P. Amoroso, E. J. Boyko, G. C. Gray, G. D. Gackstetter, J. R. Riddle, T. S. Wells, G. Gumbs, T. E. Corbeil, and T. I. Hooper. 2007. Millennium Cohort: Enrollment begins a 21-year contribution to understanding the impact of military service. Journal of Clinical Epidemiology 60(2):181–191.
Sayer, N. A., C. Chiros, B. Clothier, H. Lew, T. Pickett, S. Scott, and B. Sigford. 2006. Predictors of functional improvement during acute inpatient rehabilitation among combatinjured OIF and OEF servicemembers. Poster presented at 2006 annual meeting of the American Military Surgeons of the United States, San Antonio, TX.
Scott, S. G. 2005. Polytrauma rehabilitation system of care. PowerPoint presentation made at February 2005 meeting of the Veterans’ Disability Benefits Commission, St. Petersburg, FL. http://www.1888932-2946.ws/vetscommission/e-documentmanager/gallery/Documents/February_2006/DrScottColFryerPresentation.pdf (accessed March 1, 2007).
Seal, K. H., D. Bertenthal, C. R. Miner, S. Sen, and C. Marmar. 2007. Bringing the war back home: Mental health disorders among 103,788 U.S. veterans returning from Iraq and Afghanistan seen at Department of Veterans Affairs facilities. Archives of Internal Medicine 167(5):476–482.
U.S. Congress, House of Representatives, Committee on Appropriations. 2007. Prepared statement of Joel Kupersmith, M.D., Chief Research and Development Officer, VA, before the Subcommittee on Military Construction, Veterans’ Affairs and Related Agencies, 110th Cong., 1st Sess., March 14. https://www.va.gov/OCA/testimony/hac/smqlva/070314JK.asp (accessed May 14, 2007).
U.S. Congress, House of Representatives, Committee on Veterans’ Affairs. 2006. Prepared statement of Colonel Charles W. Hoge, U.S. Army Director of Division of Psychiatry and Neuroscience, Walter Reed Army Institute of Research, before the Subcommittee on Health’s hearing on posttraumatic stress disorder and traumatic brain injury, 109th
Cong., 2nd Sess. September 28. http://veterans.house.gov/hearings/schedule109/sep06/9-28-06/CharlesHoge.html (accessed March 15, 2007).
U.S. Congress, House of Representatives, Committee on Veterans’ Affairs. 2007a. Prepared statement of James R. Nicholson, Secretary of Veterans Affairs, before the Full Committee. 110th Cong., 1st Sess., February 8. http://veterans.house.gov/hearings/schedule110/feb07/02-08-07/JamesNicholson.html (accessed March 1, 2007).
U.S. Congress, House of Representatives, Committee on Veterans’ Affairs. 2007b. Prepared statement of Steven G. Scott, Medical Director, VA Tampa Polytrauma Rehabilitation Center, before the Subcommittee on Oversight and Investigation. 110th Cong., 1st Sess., March 8. http://veterans.house.gov/hearings/schedule110/mar07/03-08-07/StevenScott.shtml (accessed March 9, 2007).
U.S. Congress, House of Representatives, Committee on Veterans’ Affairs. 2007c. Prepared statement of Ronald R. Aument, Deputy Under Secretary for Benefits, VA, before the Subcommittee on Disability Assistance and Memorial Affairs. 110th Cong., 1st Sess., March 13. http://veterans.house.gov/hearings/schedule110/mar07/03-13-07/Aument.pdf (accessed March 9, 2007).
U.S. Congress, Senate, Defense Appropriations Committee. 2007. Prepared statement of Lt. Gen. (Dr.) James G. Roudebush, Surgeon General of the Air Force, before the Defense Appropriations Subcommittee. 110th Cong., 1st Sess., March 7. http://appropriations.senate.gov/hearings.cfm (accessed March 9, 2007).
U.S. Congress, Senate and House of Representatives, Committees on Veterans’ Affairs. 2007a. Prepared statement of Bradley S. Barton, National Commander, Disabled American Veterans. 110th Cong., 1st Sess., February 27. http://veterans.house.gov/hearings/schedule110/feb07/02-27-07/BradleyBarton.shtml (accessed March 9, 2007).
U.S. Congress, Senate and House of Representatives, Committees on Veterans’ Affairs. 2007b. Prepared statement of Larry Belote, National President, Blinded Veterans of America. 110th Cong., 1st Sess., March 8. http://veterans.senate.gov/index.cfm?FuseAction=Hearings.CurrentHearings&rID=946&hID=256/ (accessed March 16, 2007).
VA (Department of Veterans Affairs). 1995. VA report RCS 20-0227, as of March 31, 1995 (unpublished).
VA. 2001a. 2001 National Survey of Veterans: Final report. Washington, DC: Department of Veterans Affairs. http://www.va.gov/vetdata/docs/NSV%20Final%20Report.pdf (accessed June 22, 2007).
VA. 2001b. Veterans Benefits Administration annual benefits report for fiscal year 2000. Washington, DC: Veterans Benefits Administration. http://www.vba.va.gov/bln/dmo/reports/fy2000_abr_v3.pdf (accessed March 1, 2007).
VA. 2002. Veterans Administration annual benefits report for fiscal year 2001. Washington, DC: Veterans Benefits Administration. http://www.vba.va.gov/bln/dmo/reports/FY2001_ABR.pdf (accessed March 1, 2007).
VA. 2003. Veterans Administration annual benefits report for fiscal year 2002. Washington, DC: Veterans Benefits Administration. http://www.vba.va.gov/bln/dmo/reports/fy2002/2002_abr_all.pdf (accessed March 1, 2007).
VA. 2004a. Veterans Administration annual benefits report for fiscal year 2003. Washington, DC: Veterans Benefits Administration. http://www.vba.va.gov/bln/dmo/reports/fy2003/2003_abr.pdf (accessed March 1, 2007).
VA. 2004b. VetPop2004 Version 1.0 State and National Tables Table 5L: Veterans 2000– 2033 by race/ethnicity, gender, period, age. http://www.va.gov/vetdata/docs/VP2004B.htm (accessed December 18, 2006).
VA. 2005a. Polytrauma rehabilitation procedures. VHA handbook 1172.1. http://www.va.gov/vhapublications/ViewPublication.asp?pub_ID=1317 (accessed March 12, 2007).
VA. 2005b. Veterans Administration annual benefits report for fiscal year 2004. Washington, DC: Veterans Benefits Administration. http://www.vba.va.gov/bln/dmo/reports/fy2004/2004_abr.pdf (accessed March 1, 2007).
VA. 2005c. VA report RCS 20-0227, as of September 30, 2005 (unpublished).
VA. 2006a. Compensation and pension benefit activity among 633,867 veterans deployed to the Global War on Terrorism. Washington, DC: Office of Performance Analysis and Integrity, Veterans Benefit Administration. Prepared November 8, 2006. Unpublished document provided by VA to the Committee on Medical Evaluation of Veterans for Disability Compensation on March 14, 2007.
VA. 2006b. Veterans Benefits Administration annual benefits report for fiscal year 2005. Washington, DC: Veterans Benefit Administration. http://www.vba.va.gov/bln/dmo/reports/fy2005/2005_abr.pdf (accessed March 1, 2007).
VA. 2006c. Analysis of VA health care utilization among U.S. Southwest Asian war veterans: Operation Iraqi Freedom and Operation Enduring Freedom. Washington, DC: Office of Public Health and Environmental Hazards, Veterans Health Administration.
VA. 2006d. VA report RCS 20-0227, as of September 30, 2005 (unpublished).
VA. 2007a. FY2008 budget submission, volume II: National Cemetery Administration, benefits programs, and departmental administration. Washington, DC: Office of Budget, Department of Veterans Affairs. http://www.vba.va.gov/bln/dmo/reports/FY2001_ABR.pdf (accessed March 1, 2007).
VA. 2007b. Polytrauma and blast-related injuries. QUERI (Quality Enhancement Research Initiative) fact sheet. http://www.va.gov/hsrd/publications/internal/polytrauma_factsheet.pdf (accessed March 14, 2007).
VA. 2007c. Unpublished tables of claims data provided by VA Office of Performance Analysis and Integrity to the Committee on Medical Evaluation of Veterans for Disability Compensation.
Warden, D. 2006. TBI during wartime: The Afghanistan and Iraq experience. Presentation at 2nd Federal Traumatic Brain Injury Interagency Conference, Bethesda, MD, March 9. http://www.tbi-interagency.org/pdf/dwarden.pdf (accessed March 21, 2007).
APPENDIX TABLE 2-1 Individual Service-Connected Conditions by Rating, FY 1995 and FY 2005
APPENDIX TABLE 2-2 Five Most Common Service-Connected Conditions by Period of Service, All Veterans Receiving Disability Compensation as of FY 2005
|
Period of Service |
Condition |
Number of Conditions |
Percent of All Conditions |
|
WWII |
|
|
|
|
|
Defective hearing |
42,464 |
5.8% |
|
|
Frozen feet, residuals of (immersion foot) |
39,169 |
5.4% |
|
|
Tinnitus |
32,491 |
4.5% |
|
|
Generalized anxiety disorder |
31,367 |
4.3% |
|
|
Scars, other |
30,571 |
4.2% |
|
|
PTSD |
25,281 |
3.5% |
|
|
Arthritis, due to trauma |
24,420 |
3.3% |
|
|
Scars, superficial, tender and painful |
15,584 |
2.1% |
|
|
Flatfoot, acquired |
15,359 |
2.1% |
|
|
Scars, disfiguring, head, face, or neck |
11,718 |
1.6% |
|
|
All |
728,911 |
100.0% |
|
Korea |
|
|
|
|
|
Defective hearing |
25,529 |
7.2% |
|
|
Tinnitus |
22,100 |
6.2% |
|
|
Frozen feet, residuals of (immersion foot) |
19,808 |
5.6% |
|
|
Scars, other |
15,476 |
4.4% |
|
|
PTSD |
10,994 |
3.1% |
|
|
Arthritis, due to trauma |
10,030 |
2.8% |
|
|
Scars, superficial, tender and painful |
7,147 |
2.0% |
|
|
Duodenal ulcer |
6,825 |
1.9% |
|
|
Scars, disfiguring, head, face, or neck |
5,758 |
1.6% |
|
|
Generalized (analogous to) musculoskeletal conditions |
5,552 |
1.6% |
|
|
All |
355,344 |
100.0% |
|
Vietnam |
|
|
|
|
|
Diabetes mellitus |
190,199 |
6.9% |
|
|
PTSD |
179,737 |
6.5% |
|
|
Defective hearing |
129,323 |
4.7% |
|
|
Scars, other |
121,850 |
4.4% |
|
|
Tinnitus |
120,625 |
4.4% |
|
|
Generalized (analogous to) musculoskeletal conditions |
78,270 |
2.9% |
|
|
Hypertensive vascular disease |
72,169 |
2.6% |
|
|
Arthritis, due to trauma |
69,034 |
2.5% |
|
|
Other impairment of knee |
62,713 |
2.3% |
|
|
Arthritis, degenerative, hypertrophic, or osteoarthritis |
52,920 |
1.9% |
|
|
All |
2,745,555 |
100.0% |
|
Period of Service |
Condition |
Number of Conditions |
Percent of All Conditions |
|
Gulf War |
|
|
|
|
|
Generalized musculoskeletal conditions |
131,092 |
5.9% |
|
|
Tinnitus |
104,039 |
4.7% |
|
|
Arthritis due to trauma |
100,374 |
4.5% |
|
|
Other impairment of knee |
81,677 |
3.7% |
|
|
Hypertensive vascular disease |
64,558 |
2.9% |
|
|
Lumbosacral strain |
61,658 |
2.8% |
|
|
Scars, other |
60,350 |
2.7% |
|
|
Defective hearing |
60,023 |
2.7% |
|
|
Arthritis, degenerative, hypertrophic, or osteoarthritis |
54,042 |
2.4% |
|
|
Limited motion of ankle |
53,002 |
2.4% |
|
|
All |
2,233,479 |
100.0% |
|
Peacetime |
|
|
|
|
|
Generalized musculoskeletal conditions |
78,233 |
4.9% |
|
|
Other impairment of knee |
77,768 |
4.9% |
|
|
Arthritis due to trauma |
68,068 |
4.2% |
|
|
Defective hearing |
64,013 |
4.0% |
|
|
Tinnitus |
60,278 |
3.8% |
|
|
Scars, other |
54,823 |
3.4% |
|
|
Hypertensive vascular disease |
50,247 |
3.1% |
|
|
Lumbosacral strain |
44,736 |
2.8% |
|
|
Arthritis, degenerative, hypertrophic, or osteoarthritis |
39,646 |
2.5% |
|
|
Intervertebral disc syndrome |
37,103 |
2.3% |
|
|
All |
1,602,697 |
100.0% |
|
SOURCE: VA (2006b). |
|||
APPENDIX TABLE 2-3 20 Most Frequent Service-Connected Conditions Among Women and Men, 2004–2006
|
Women |
Men |
||
|
Condition |
Number of Grants |
Condition |
Number of Grants |
|
Lumbosacral or cervical strain |
11,113 |
Tinnitus |
161,090 |
|
Migraine |
10,255 |
Defective hearing |
135,394 |
|
Tinnitus |
5,901 |
Diabetes mellitus |
85,005 |
|
Scars, other |
5,807 |
PTSD |
74,491 |
|
Limitation of flexion of leg |
5,566 |
Hypertensive vascular disease |
51,033 |
|
Major depressive disorder |
5,378 |
Lumbosacral or cervical strain |
50,136 |
|
Tenosynovitis |
5,155 |
Penis, deformity with loss of erectile power |
38,719 |
|
Degenerative arthritis of the spine |
4,997 |
Paralysis of sciatic nerve |
38,356 |
|
Scars, superficial, tender, and painful |
4,847 |
Degenerative arthritis of the spine |
36,672 |
|
Allergic or vasomotor rhinitis |
4,687 |
Limitation of flexion of leg |
35,798 |
|
Hernia, hiatal |
4,671 |
Scars, other |
33,537 |
|
Eczema |
4,443 |
Limited motion of the ankle |
30,182 |
|
Limited motion of the ankle |
4,258 |
Arthritis, due to trauma |
29,306 |
|
Flatfoot, acquired |
3,992 |
Hernia, hiatal |
25,251 |
|
Hypertensive vascular disease |
3,734 |
Scars, superficial, tender, and painful |
24,924 |
|
Asthma, bronchial |
3,534 |
Tenosynovitis |
24,806 |
|
PTSD |
3,313 |
Eczema |
23,666 |
|
Hallux valgus |
3,303 |
Paralysis of the median nerve |
22,227 |
|
Arthritis, due to trauma |
3,236 |
Intervertebral disc syndrome |
20,929 |
|
Paralysis of the median nerve |
2,988 |
Arteriosclerotic heart disease |
19,854 |
|
SOURCE: VA (2007c). |
|||
APPENDIX TABLE 2-4 Frequency of Diagnoses Among Recent Veterans of Iraq and Afghanistan
|
Broad ICD-9 Category |
Frequency |
% |
|
Infectious and parasitic diseases (001–139) |
21,362 |
10.4 |
|
Malignant neoplasms (140–208) |
1,584 |
0.8 |
|
Benign neoplasms (210–239) |
6,571 |
3.2 |
|
Diseases of endocrine/nutritional/metabolic systems (240–279) |
36,409 |
17.8 |
|
Diseases of blood and blood-forming organs (280–289) |
3,591 |
1.8 |
|
Mental disorders (290–319) |
73,157 |
35.7 |
|
Diseases of nervous system/sense organs (320–389) |
61,524 |
30.0 |
|
Diseases of circulatory system (390–459) |
29,249 |
14.3 |
|
Diseases of respiratory system (460–519) |
36,190 |
17.6 |
|
Diseases of digestive system (520–579) |
63,002 |
30.7 |
|
Diseases of genitourinary system (580–629) |
18,886 |
9.2 |
|
Diseases of skin (680–709) |
29,010 |
14.1 |
|
Diseases of musculoskeletal system/connective system (710–739) |
87,590 |
42.7 |
|
Symptoms, signs, and ill-defined conditions (780–799) |
67,743 |
33.0 |
|
Injury/poisonings (800-999) |
35,765 |
17.4 |
|
SOURCE: VA (2006d). |
||
APPENDIX TABLE 2-5 Frequency of Mental Diagnoses Among Recent Veterans of Iraq and Afghanistan
|
Disease Category (ICD-9CM Code) |
Number of OEF/OIF Veterans |
|
PTSD (309.81) |
33,754 |
|
Nondependent abuse of drugs (305) |
28,732 |
|
Depressive disorders (311) |
23,462 |
|
Neurotic disorders (300) |
18,294 |
|
Affective psychoses (296) |
12,386 |
|
Alcohol dependence syndrome (303) |
5,413 |
|
Sexual deviations and disorders (302) |
3,239 |
|
Special symptoms, not elsewhere classified (307) |
3,178 |
|
Drug dependence (304) |
2,387 |
|
Acute reaction to stress (308) |
2,273 |
|
SOURCE: VA (2006d). |
|


