
India’s Knowledge Economy in the Global Context1
Carl J. Dahlman
Georgetown University
INTRODUCTION
The rise of India as an emerging economic power is increasingly in the global headlines. This is due in part to its large population and impressive growth rates, not just in the past three years, but the past decade and a half. However, it is also due to India’s increasing scientific and technological capability.
This paper assesses India’s knowledge economy in the global context. To put the analysis in context, the second section quickly summarizes some of the key global trends. The third provides an overview of the Indian economy and its recent economic performance. The fourth presents India’s rising economic power and briefly summarizes some of its advantages and challenges. The fifth section benchmarks India’s position in the global knowledge economy using a four-part framework that includes the economic and institutional regime, education and training, the information infrastructure and its use, and the innovation system. It summarizes some of the key challenges and policy issues in the first three of these. The innovation system is analyzed in more detail in the sixth section. That analysis includes a quick overview of the innovation system as well as some of the key issues that need to be addressed. The seventh section summarizes some of the key opportunities for greater U.S.–India collaboration. The final section provides a very brief summary and conclusions.
KEY GLOBAL TRENDS
India’s rise needs to be seen in the broader context of some of the broader global trends affecting growth and competitiveness.
One of these is the increased importance of knowledge. The world is in the midst of what could be considered a knowledge revolution. It is not that knowledge has not always been important for growth and competitiveness, but that there has been a speeding up in the rate of creation and dissemination of knowledge.
A second key trend is an increase in globalization. The share of goods and services that are traded as a percentage of global GDP has increased from 38 percent in 1990 to 48 percent in 2004. This is the result of greater trade liberalization worldwide. However, it is also the result of reductions in transportation and communications costs that result from rapid advances in technology.
A third and related trend is that knowledge markets have become global. Products and services are increasingly designed and developed for global markets in order to recoup the research and development (R&D) investments. In addition, R&D itself is becoming increasingly globalized. This is not just an increase in joint authorship of technical papers by teams from different countries, or joint patenting. An increasing amount of R&D is now being done by multinationals in countries other than their respective home countries, and not just among developed countries. India and China in particular are also benefiting from this trend as they are becoming hosts to many R&D centers set up by multinational companies, as well.
In addition, thanks to the reduction in communications costs, there is an increasing trend to source many knowledge-intensive services in lower-cost developing countries. This is part of what is driving global offshoring of knowledge-intensive services, such as back office functions, as well as engineering design, and even contract innovation services.2
The result of these trends is that innovation and high-level skills are becoming the most important determinants of competitiveness. Thus countries such as India need to develop more explicit strategies to take advantage of the rapid creation and dissemination of knowledge and to develop their own stronger innovation capabilities.
THE INDIAN ECONOMY
The Indian economy has had a very impressive performance (Table 1). Between 1990 and 2000, it grew at an average annual rate of 6.0 percent. Between
TABLE 1 Growth of output overall and by sector (average annual % growth)
|
|
GDP |
Agriculture |
Industry |
Manufacturing |
Services |
|||||
|
|
1990–2000 |
2000–2004 |
1990–2000 |
2000–2004 |
1990–2000 |
2000–2004 |
1990–2000 |
2000–2004 |
1990–2000 |
2000–2004 |
|
Low income |
4.6 |
5.5 |
3.1 |
2.7 |
4.9 |
6 |
5.8 |
6.5 |
5.9 |
6.7 |
|
India |
6.0 |
6.2 |
3.0 |
2.0 |
6.3 |
6.2 |
7.0 |
6.5 |
8.0 |
8.2 |
|
Low middle income |
5.2 |
6.0 |
2.6 |
3.8 |
6.4 |
7.3 |
NA |
NA |
5.1 |
5.4 |
|
China |
10.6 |
9.4 |
4.1 |
3.4 |
13.7 |
10.6 |
NA |
NA |
10.2 |
9.8 |
|
Upper middle income |
2.1 |
2.7 |
0.3 |
2.2 |
1.5 |
2.5 |
4.5 |
2.1 |
2.8 |
2.7 |
|
High income |
2.7 |
2.0 |
1.0 |
−1.3 |
1.9 |
0.3 |
NA |
0.7 |
3.0 |
2.0 |
|
World |
2.9 |
2.5 |
1.8 |
2.1 |
2.4 |
1.4 |
NA |
1 |
3.1 |
2.3 |
|
SOURCE: World Bank, World Development Indicators 2006, Washington, D.C.: World Bank, 2006, Table 4.1. |
||||||||||
2000 and 2004, it grew at an average rate of 6.2 percent. In the past three years, it has grown at slightly over 8 percent. The sector that has been growing the fastest has been services.
Compared to China, the structure of the economy has not changed as rapidly. Twenty-five years ago the per capita income of these two giant economies was very similar. However, China has had a much faster rate or growth for a longer period of time and more rapid structural change (Table 2). To some extent, India has not followed the traditional pattern of a large increase in the share of industrial value added and then a shift to services. There has been a faster and earlier shift to services, driven in part by a rapid growth of high-value knowledge-intensive services (such as information technology [IT], banking, consulting, and real estate), although they account for only a very small share of India’s very large labor force.
Another difference between India and other developing countries is that it is much less integrated into the global system through trade (Table 3). The contrast with China is again very stark as the share of trade of goods and services in the Chinese economy is more than twice that of India.
INDIA AS A RISING ECONOMIC POWER
India is a rising economic power, but one that has not yet integrated very much with the global economy. It has many strengths, but it also will be facing many challenges in the increasingly globalized, competitive, and fast changing global economy.
Figure 1 presents the current and projected size through 2015 of the world’s 15 largest economies in terms of purchasing power parity (PPP) comparisons.3 Using PPP exchange rates, India already is the fourth largest economy in the word. Moreover, using average growth rates for the period 1991–2003 to project future size, India surpasses Japan by the end of next year to become the third largest economy in the world. During the period projected, China (currently, the second largest economy), will become the largest economy, surpassing the United States by about 2013. However, it should be emphasized that past performance is not necessarily a good predictor of future performance—just of potential, as future reality is usually different than projected trend. Nevertheless, this projection based on PPP exchange rates is helpful to emphasize that India has great potential, but also faces competition, particularly from China. It is therefore useful to quickly take stock of India’s strengths and challenges.
TABLE 2 Structure of output, 1990 vs. 2004
|
|
Agriculture |
Industry |
Manufacturing |
Services |
||||
|
|
1990 |
2004 |
1990 |
2004 |
1990 |
2004 |
1990 |
2004 |
|
Low income |
32 |
23 |
26 |
28 |
15 |
15 |
42 |
49 |
|
India |
31 |
21 |
28 |
27 |
17 |
16 |
41 |
52 |
|
Low middle income |
19 |
12 |
39 |
41 |
27 |
NA |
42 |
46 |
|
China |
27 |
13 |
42 |
46 |
33 |
NA |
31 |
41 |
|
Upper middle income |
10 |
6 |
39 |
32 |
22 |
20 |
51 |
62 |
|
High income |
3 |
2 |
33 |
26 |
22 |
18 |
65 |
72 |
|
World |
6 |
4 |
33 |
28 |
22 |
18 |
61 |
68 |
|
SOURCE: World Bank, World Development Indicators 2006, Washington, D.C.: World Bank, 2006, Table 4.1. |
||||||||
India’s key strengths are its large domestic market, its young and growing population, a strong private sector with experience in market institutions, and a well-developed legal and financial system. In addition, from the perspective of the knowledge economy, another source of strength is a large critical mass of highly trained English-speaking engineers, business people, scientists, and other professionals, who have been the dynamo behind the growth of the high-value service sector.
However, India is still a poor developing country. Its per capita income in 2004 was just $674 and with a billion people, it accounted for 17 percent of the world’s population. Its share of global GDP is less than 2 percent (using nominal exchange rates), and just 1 percent of world trade. Moreover, 80 percent of its population lives on less that $2 a day, and 71 percent is rural, with about 60 percent of the total labor force still engaged in agriculture.
TABLE 3 Integration with global economy (% of GDP)
|
|
Merchandise Trade |
Trade in Services |
FDI |
|||
|
|
1990 |
2004 |
1990 |
2004 |
1990 |
2004 |
|
Low income |
24.1 |
37.8 |
6.5 |
9.4 |
0.4 |
1.4 |
|
India |
13.1 |
25 |
3.4 |
8.2 |
0.1 |
0.8 |
|
Lower middle income |
31.5 |
57.5 |
6.2 |
10.3 |
0.7 |
2.7 |
|
China |
32.5 |
59.8 |
2.9 |
7.0 |
1.0 |
2.8 |
|
Upper middle income |
38.3 |
67.0 |
8.1 |
10.2 |
1.0 |
2.8 |
|
High income |
32.3 |
41.5 |
8.0 |
10.5 |
1.0 |
1.3 |
|
World |
32.4 |
44.9 |
7.8 |
10.5 |
1.0 |
1.6 |
|
SOURCE: World Bank, World Development Indicators 2006, Washington, D.C.: World Bank, 2006, Table 6.0. |
||||||
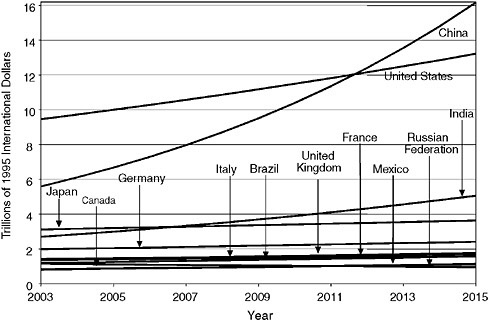
FIGURE 1 Current economic size and projection through 2015 for 15 largest economies.
SOURCE: Author’s projections based on data in the WDI database. World Bank, World Development Indicators 2006, Washington, D.C.: World Bank, 2006.
One of India’s key challenges is its rapidly growing and young population. India’s population is expected to continue to grow at a rate of 1.7 percent per year until 2020 and to overtake China as the most populous country in the world. Part of the challenge is that India’s population has low average educational attainment. Years of school for the adult population averages less then 5 years, compared to nearly 8 years in China now, and 12 in developed countries. In addition, illiteracy is 52 percent among women and 27 percent among men.
Another challenges is poor infrastructure—power supply, roads, ports, and airports. This increases the cost of doing business. In addition, India is noted for an excessively bureaucratic and regulated environment which also increases the cost of doing business.
All these challenges constrain the ability of the Indian economy to react to changing opportunities. Low education reduces the flexibility to respond to new challenges. Poor infrastructure and high costs of doing business constrain domestic and foreign investment. The high costs of getting goods in or out of India also constrain India’s ability to compete internationally and to attract export-oriented foreign investment except for business that can be done digitally rather than requiring physical shipments.
Figure 2 presents alternative projections of India’s per-worker income to 2020. The projections assume that the growth of capital, labor, and education in
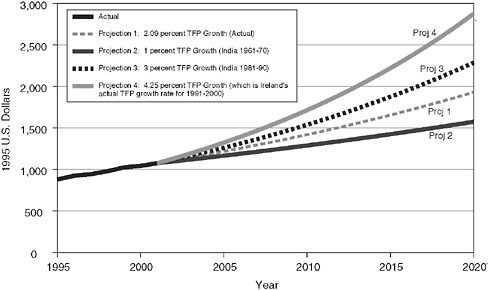
FIGURE 2 India’s choice set in determining its future growth path: Real GDP Per Capita—Alternate projections, 2001-2020.
NOTE: The projections assume that capital, labor, and human capital (the educational complement to labor) grow at their 1991–2000 respective annual rates of growth. What is varied is the rate of total factor productivity growth. The TFP numbers are taken from the historical experience noted for each of the projections.
SOURCE: Carl Dahlman and Anuja Utz, India and the Knowledge Economy: Leveraging Strengths and Opportunities, Washington, D.C.: The World Bank, 2005.
India continue their trend lines. The only parameter that is changed is the rate of growth of total factor productivity (TFP)—the efficiency with which these basic factors are utilized.4 The projections show that the real per-worker income in India could be between 46 to 167 percent higher in 2020 than in 2001, depending on how effectively knowledge is used. As noted, these projections are based on
the historical trends in the growth of inputs and of TFP. To a very large extent, these depend on policy measures that are under the control of India’s policy makers, business, and the broader Indian society. The point of this projection is to emphasize that India’s performance to a very large extent depends on its policy choices—what is holding India back is itself.
There is a tremendous window of opportunity for India to leverage its strengths to improve it competitiveness and increase the well-being of its population. However, it is important to seize these opportunities and to move quickly to action. The next section will examine India’s position in the context of the global knowledge economy as a way to identify some of the key policy issues that need to be addressed to make India’s recent rapid growth sustainable.
INDIA IN THE GLOBAL KNOWLEDGE ECONOMY
The World Bank Institute has developed a useful benchmarking tool that helps to rank countries in terms of their readiness to use knowledge for development.5 The methodology consists of examining a country’s rank ordering in four pillars based on a series of 20 indicators in each pillar. The four pillars are:
-
an economic and institutional regime that provides incentives for the efficient use of existing and new knowledge and the flourishing of entrepreneurship;
-
an educated and skilled population that can create, share, and use knowledge well;
-
a dynamic information infrastructure that can facilitate the effective communication, dissemination, and processing of information;
-
an efficient innovation system of firms, research centers, universities, consultants, and other organizations that can tap into the growing stock of global knowledge, assimilate and adapt it to local needs, and create new knowledge.
|
5 |
See www.worldbank.org/kam. The knowledge assessment methodology (KAM) is designed to help countries understand their strengths and weaknesses in making the transition to the knowledge economy. It is thus useful in identifying the challenges and opportunities that a country faces, and where it may need to focus policy attention or future investments. In so doing, the KAM provides a preliminary knowledge economy assessment of a country, which can form the basis for more detailed sector-specific work. The KAM consists of a set of 80 structural and qualitative variables that serve as proxies for the four pillars that are critical to the development of a knowledge economy. The comparison is undertaken for a group of 128 countries which includes most of the developed Organisation for Economic Co-operation and Development economies and over 90 developing countries. The data used for this paper are from the 2006 version of the KAM. The basic scorecard for 14 variables is done for two points in time—1995 and the most current year for which data are available. See Figure A-1 in the Annex for the basic scorecard comparison of India, China, and the United States. |
Broad Assessment of India’s Position
A simple summary measure called the Knowledge Economy Index has been developed for quick comparative benchmarking. It is an amalgamated index consisting of the average ranking of three of the most indicative indicators for each of the four sectors.6 This index is tracked over time. It permits the comparison of a country’s current ranking to that in 1995. This is done in Figure 3 for India plus five other countries: Brazil, Russia, China, Korea, and Mexico7 plus some other standard reference countries.
Figure 3 shows that India is placed roughly in the sixth decile of a rank-ordering distribution from the most advanced countries. It also shows that India’s relative position has slipped relative to where it was in 1995. Figure 4 shows the contribution of each of the four pillars to India’s relative ranking. India has improved its relative position on the innovation indicators and slightly on the information and communications technology (ICT) indicators. On the economic and institutional regime and education, it has slipped back. (See Annex Table A-1 for the ranking on each of the pillars.)8
The rest of this section summarizes very briefly some of the key issues in the economic and institutional regime, education and training, and information and communication technology. The following section looks at the issues in innovation in more detail.9
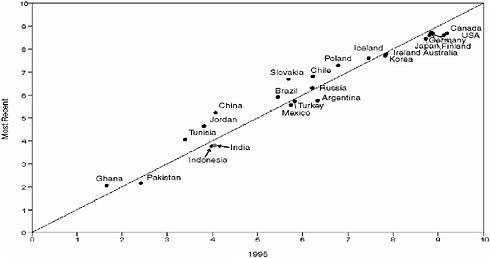
FIGURE 3 Changes to Knowledge Economy Index, 1995–2003.
NOTE: The horizontal axis represents the relative position of the country or a region in 1995. The vertical axis represents the position in the most recent year (generally 2000– 2004). The graph is split by a 45 degree line. Those countries or regions that are plotted below the line indicate a regression in their performance between the two periods. The countries or regions that are marked above the line signify improvement between the two periods, while those countries that are plotted on the line indicate stagnation. The KAM methodology allows the user to check performance in the aggregate Knowledge Economy Index (KEI), as well as the individual pillars: Economic Incentive Regime, Education, Innovation, and ICT (Information Communications Technologies).
SOURCE: World Bank Institute, KAM 2006, <http://www.worldbank.org/kam>.
Key Issues in the Economic and Institutional Regime
The economic and institutional regime is an important aspect of a country’s ability to take advantage of knowledge. It includes the overall regime of policies and institutions that give an economy the incentives to improve efficiency and the flexibility to redeploy capital and labor to their most productive use. It also includes the rule of law and government effectiveness. As was seen from the summary variables in the KAM basic scorecard, this is the second weakest of the four pillars of the knowledge economy in India, and one in which India has actually lost relative standing with respect to the rest of the world. Based on a more detailed analysis, including surveys of foreign and Indian businessmen, some of the key issues that have to be improved in the economic and institutional regime include:10
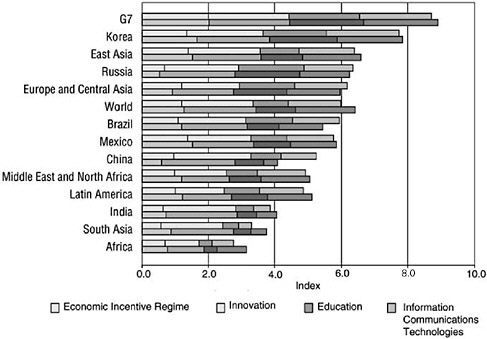
FIGURE 4 KEI: Major world regions and largest country in each, 1995 vs. most recent.
NOTE: Each bar chart represents the most recent aggregate KEI score for a selected region or country, split into the four KE pillars. Each color band represents the relative weight of a particular pillar to the overall country’s or region’s knowledge readiness, measured by the KEI. The first line for each country is its position in the most recent year for which data are available (generally 2002–2005). The second line is for 1995. (See Annex Table A-1 for the actual ranking for each of the pillars. See Annex Figure A-1 for a comparison of the basic scorecard rankings for India with China and the United States.)
SOURCE: World Bank Institute, KAM 2006, <http://www.worldbank.org/kam>.
-
reducing the bureaucracy for the entry and exit of firms,
-
updating physical infrastructure,
-
easing restrictions on the hiring and firing of labor,
-
reducing tariff and nontariff barriers to trade,
-
encouraging foreign direct investment and increasing e-linkages with the rest of the economy,
-
strengthening intellectual property rights and their enforcement, and
-
improving e-governance and encouraging ICT use to increase government’s transparency and accountability.
Key Issues in Education and Training
Educated and skilled persons underlie the ability of an economy to take advantage of knowledge and to create new knowledge to improve economic
performance and welfare. Key elements of education and training for the knowledge economy include the level and quality of educational attainment as well as the relevance for the needs of a rapidly changing economy such as India. This is also a pillar in which India has slipped compared to its relative global ranking in 1995. Some of the key issues that India needs to address in education and training include:
-
expanding quality basic and secondary education to empower India’s rapidly growing young population;
-
raising the quality and supply of higher education institutions, not just the Indian Institutes of Technology and the Indian Institutes of Management;
-
embracing the contribution of private providers of education and training by relaxing bureaucratic hurdles and putting in place better accreditation systems;
-
increasing university–industry partnerships to ensure consistency between education, research, and the needs of the economy;
-
establishing partnerships between Indian and foreign universities to provide internationally recognized credentials;
-
using ICT to meet the double goals of expanding access and improving the quality of education;
-
investing in flexible, cost-effective job training programs that are able to adapt quickly to new and changing skill demands.
Key Issues in ICT
Advances in information processing, storage, and dissemination are making it possible to improve efficiency of virtually all information-intensive activities and to reduce transaction costs of many economic activities. Some of the key elements to make effective use of the potential of this new information infrastructure are the regulatory regime for the information and telecommunications industries and the skills to use the technologies, software, and applications. Some of the key issues that need to be improved in India include:
-
boosting ICT penetration and reducing/rationalizing tariffs on hardware and software imports;
-
massively enhancing ICT literacy and skills;
-
increasing the use of ICT as a competitive tool to improve efficiency of production and marketing (supply chain management, logistics, etc.);
-
moving up the value chain in IT by developing high-value products through R&D, improving the quality of products and services, marketing of products and services, and further positioning the “India” brand name;
-
launching suitable incentives to promote IT applications for the domestic economy, including local language content and application;
-
strengthening partnerships between government agencies, research/ academic institutions, private companies, and nongovernmental organizations (NGOs) to ramp up ICT infrastructure and applications;
-
developing/scaling up, through joint public–private partnerships, ICT applications, community radio, smart cards, Internet, satellite communications, etc.
STRENGTHENING INDIA’S INNOVATION SYSTEM
This section starts by placing India in the international context using the KAM innovation pillar as well as other data. The next subsection develops a brief framework for analyzing a developing country’s innovation system. This framework is then used to assess India’s innovation system. The last section then presents a matrix of key issues that need to be addressed to improve India’s innovation system.
Broad Assessment of India’s Position in Innovation
Figure 5 places India’s innovation system in the global context using the KAM innovation system pillars. This is based on one measure of R&D input (scientists and engineers) and two measures of output (scientific and technical publications, and patents in the United States). By this narrow measure linked primarily to formal R&D, India is in the top 13th percentile of the global distribution of countries.11 Furthermore, it has improved its position relative to the rest of the world.
Clearly, because of India’s large critical mass of scientists and engineers engaged in R&D, India is a major player in global R&D. However, it is instructive to compare India’s share of the world in scientists and engineers, scientific and technical publications, and patents with its share of population and GDP measured in nominal as well as PPP exchange rates (Figure 6). From this figure, it can be seen that, as expected, India’s share of scientists and engineers in R&D is much lower than its share of population or GDP in PPP terms, although it is slightly higher than its GDP share in nominal terms. Its share of scientific and technical publications is smaller than its share of GDP in nominal terms. Its share of all patents in the United States is extremely small (only 0.2 percent—too small to be in the figure). One quick conclusion from this comparison is that India is stronger in its basic scientific inputs that in its outputs of basic scientific and technical knowledge, since its share of publications is smaller than its share of personnel engaged in R&D. It is even weaker in turning that scientific output into commercially relevant knowledge, as suggested by its much smaller share of
|
11 |
However, its position would be much lower if measured relative to its population—see note to Figure 5. |
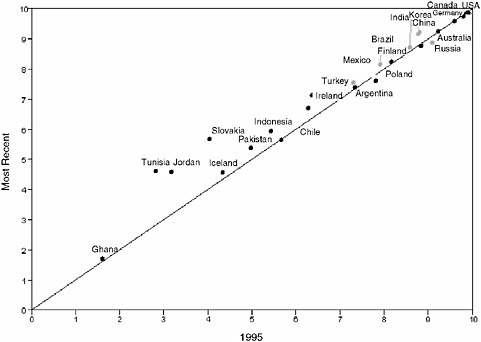
FIGURE 5 Global context of India’s innovation system.
NOTE: This figure is based on the absolute size of India’s innovative effort. If this were to be scaled by population (i.e., scientists and engineers in R&D per million population, scientific and technical publications per million population, patents in the United States per million population), India’s relative position would fall to the 67th percentile of the country distribution.
SOURCE: World Bank Institute, KAM 2006, <http://www.worldbank.org/kam>.
patents in the United States. However, a developing-country’s innovation system should be analyzed in a broader context, as developed below.
Components of a Developing County’s Innovation System
A country’s innovation system consists of the institutions and agents that create, adapt, acquire, disseminate, and use knowledge. It also includes the policies and instruments that affect the efficiency with which this is done. In developing countries, innovation should not be interpreted only as application of knowledge that is new at the level of the world frontier, but as product, process, organization, or business knowledge that is new to the local context. Therefore, in developing countries the innovation system should include not only domestic research and development and its commercialization and application. It should
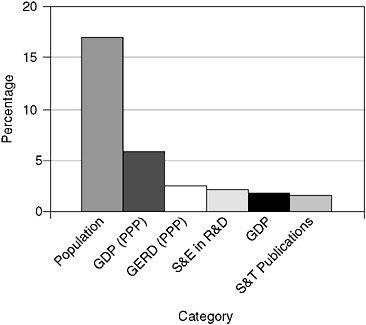
FIGURE 6 Key indicators of India’s share in the world.S&T Publications
SOURCE: Calculated from World Bank, World Development Indicators 2006, Washington, D.C.: World Bank, 2006.
also include the policies, institutions, mechanisms, and agents that affect the extent to which the country taps into and makes effective use of global knowledge that is new to the country.
The innovation system of a developing country such as India can be thought of as consisting of four parts. One is formal R&D that is carried out in India. This is the most visible and most easily measured. A second is the informal innovation in India. This may happen as the result of insights or experience by individuals or groups working in large of small enterprises or informal production. It can also be the result of decades of indigenous informal experimentation or accumulation of knowledge. This is not so visible and there is very little systematic quantification of this type of innovative effort. A third is formal acquisition of foreign knowledge. This includes the knowledge first brought in through direct foreign investment or technology transfer. The fourth is the informal acquisition, adaptation, and use of knowledge acquired through the import of capital goods, component products, and services that are new to the economy. It also includes knowledge obtained by copying, reverse engineering, or otherwise imitating what has already been done by others abroad. Other informal mechanisms include foreign study, travel, or work experience, as well as technical literature. Increasingly,
it also includes all kinds of knowledge that can be acquired through the Internet including detailed manuals, designs, and data sets.12
Assessment of India’s Innovation System
Table 4 compares some of the key indicators of India’s broadly defined innovation system with that of the other BRICKM economies. China is the most relevant country for comparison because it is the closest in size and level of development. Figure 7 presents the main variables for India and China in graphical scorecard mode.13
Formal R&D
In India, the formal R&D effort is quite small. Total expenditures are only 0.8 percent of GDP and have been at that level for 15 years. The bulk of that effort (around 70–80 percent) is carried out by the public sector (federal and state), and most of that is mission-oriented R&D in defense, aerospace, and oceans. Only about 20 percent of that, or roughly 0.16 percent of GDP, is more applied work in agriculture, medicine, and industry.14
R&D spending by the private sector is only 16–20 percent of the total, or about 0.12 percent GDP. It is highly concentrated in a few large enterprises. The sectors that do the most R&D are pharmaceuticals, auto parts, electronics, and software.
A special feature is increasing R&D being done by multinational companies (MNCs) As of the end of 2004, there were nearly 200 R&D centers, including ABB, Astra Zeneca, Bell Labs Boeing, Bosch, Dell, Cummins, Dupont, Ericsson, Google, Honda, IBM, GE, GM Honda, Hyundai, Microsoft, Monsanto, Motorola, Nestle, Nokia, Oracle, Pfizer, Philips, Roche, Samsung, Sharp, Siemens, Unilever, and Whirlpool.15 MNCs are attracted to set up R&D centers in India because of the lower salaries for Indian scientists and engineers, which are one-fourth to one-fifth that of comparable engineers in the United States.
TABLE 4 Innovation comparisons with BRICKMs
|
|
Brazil |
Russia |
India |
China |
Korea |
Mexico |
|
Gross foreign investment as share of GDP (av. 1994–2003) |
3.40 |
1.91 |
0.70 |
5.08 |
1.80 |
2.98 |
|
Royalty and license fee payments ($ million, 2004) |
1,196.9 |
1,095.4 |
420.8 |
3,548.10 |
4,450.3 |
805.0 |
|
Royalty and license fee payments/million population (2004) |
6.70 |
7.66 |
0.40 |
2.75 |
92.52 |
7.76 |
|
Royalty and license fee receipts (2004) |
114.50 |
227.50 |
25.20 |
106.98 |
1,790.50 |
91.50 |
|
Royalty and license fee receipts/million population (2004) |
0.64 |
1.59 |
0.03 |
0.08 |
37.22 |
0.88 |
|
Manufactured trade as % of GDP (2003) |
15.10 |
17.83 |
13.52 |
51.32 |
48.65 |
45.99 |
|
High-technology exports as % of man. trade (2003) |
11.96 |
18.86 |
4.75 |
27.103 |
32.15 |
21.34 |
|
Science and engineering enrollment ratio (% of tertiary students, 1998–2002) |
NA |
NA |
20.08 |
NA |
41.09 |
31.09 |
|
Science enrollment ratio (% of tertiary students, 1998–2003) |
NA |
NA |
15.11 |
NA |
10.25 |
12.52 |
|
Researchers in R&D (2003) |
59,838 |
487,477 |
117,528 |
810,525 |
151,254 |
27,626 |
|
Researchers in R&D/million population (2002) |
351.78 |
3,414.59 |
119.66 |
633.02 |
2,879.94 |
274.01 |
|
Total expenditures on R&D as % of GDP (2002) |
1.04 |
1.24 |
0.85 |
1.23 |
2.91 |
0.43 |
|
Scientific and technical journal articles (2001) |
7,205 |
15,846 |
11,076 |
20,978 |
11,037 |
32.09 |
|
Scientific and technical journal articles/million population (2001) |
41.80 |
109.47 |
10.73 |
16.49 |
233.13 |
32.29 |
|
Patent applications granted by U.S. Patent and Trademark Office (2004) |
161 |
173 |
376 |
597 |
4671 |
102 |
|
Patent applications granted by USPTO/million population (2004) |
0.9 |
1.21 |
0.35 |
0.46 |
97.03 |
0.98 |
|
SOURCE: Compiled from World Bank Institute, KAM 2006, <http://www.worldbank.org/kam>. |
||||||
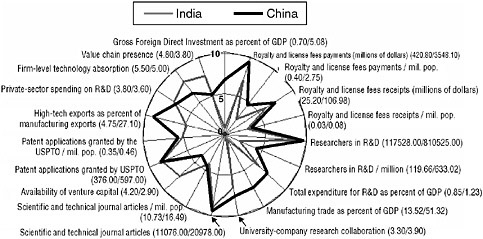
FIGURE 7 India-China comparison on selected indicators of innovation system.
SOURCE: World Bank Institute, KAM 2006, <http://www.worldbank.org/kam>.
Informal Innovation
Informal innovation efforts are quite large. This consists not only of the experimentation and learning by doing that is done in the formal and informal sectors. There is very likely a grassroots innovation effort. Several NGOs have sprung up to support such grassroots innovation. They include Honeybee network, the Society for Research and Initiatives for Sustainable Development (SRISTI), and the Grassroots Innovation Augmentation Network (GIAN). In addition, the government has set up the National Innovation Foundation (NIF) to help document and finance grassroots innovations. The NIF has created a database of over 50,000 grassroots innovations. These consist of improvements in simple agricultural instruments, and agricultural techniques as well as indigenous knowledge. However, despite all these efforts, it has been difficult to develop appropriate funding and mechanisms to support the improvement, scale-up, and broad dissemination of grassroots innovations because of very high transaction costs and limited resources.16
Formal Acquisition of Foreign Knowledge
In India this has been small until relatively recently. For a long time, India has had a very strongly autarkic technology policy. There has been a gradual
opening up of various parts of the economy to foreign investment. Now most sectors are open. The same is true for technology licensing, although there are still controls on the maximum royalty rates that can be charged. Until relatively recently, foreign investment into India was not allowed in many sectors, and was strictly regulated and kept to minority shares in joint ventures in others. There has been significant liberalization over the past 15 years, but India has not received as much foreign investment as the BRICKM countries. As can be seen from Table 4, gross foreign investment inflows as a share of GDP between 1994 and 2003 were the lowest among the six countries. Purchases of foreign technology have also been the lowest among the six countries, both in absolute terms and even more on a per capita basis. In addition, part of the reluctance of foreigners to invest in India, even after the sectors have been opened up, is the high degree of red tape, corruption, and bureaucracy as well as very poor physical infrastructure services. Some also worry about poor intellectual property rights enforcement.
Informal Acquisition of Foreign Knowledge
This is perhaps the most important source of domestic innovation in developing countries (except those that are very dependent on foreign investment such as Singapore and Hong Kong). As can also be seen in Table 4, India is again the least open economy of the six BRICKM countries as measured by degree of integration into the world economy through imports and exports of manufactured products. The share of manifested trade is only 13.5 percent of GDP in India compared to around 50 percent in China, Korea, and Mexico. Brazil and Russia are also less integrated with the global economy. However, these countries are outliers as the rest of the countries of the world are much more integrated into the global system (refer back to Table 3 for the share of merchandise trade and services in India compared to the average for other low-income countries, as well as lower and upper middle income countries, developed countries, and the world).
From Figure 7, comparing the key variables on the innovation system between India and China, it can be seen that China is ahead of India in virtually all the indicators, except the availability of venture capital, as well as some qualitative assessments on firm-level technology absorption and value chain reference where the persons surveyed have put India ahead.
However, in terms of the four-part framework laid out above, the following summary assessment can be made. It is hard to compare the domestic informal efforts, and so, that will be left aside. On acquiring knowledge from abroad informally, China is considerably ahead of India because it is much more integrated into the global system through trade and foreign education, and has a higher level of average educational attainment that facilitates the rapid assimilation of foreign knowledge. On acquiring foreign knowledge formally, China is also ahead because it has had a much more open policy for a longer period of time and has attracted much higher volumes of foreign investment as part of an explicit strategy
to use foreign investment to produce new goods and services new to the Indian market, but also for exporting to the global market. Finally, in formal R&D effort, whereas China’s spending as a share of GDP was comparable to India’s in 1998, by 2005 it had been increased to 1.4 percent of GDP. China also plans to increase it further to 2.0 percent by 2010. In fact, in PPP terms, China in 2006 is probably already the second spender on R&D in the world, ahead of Japan and second only to the United States. Essentially, while China has been very effective at tapping global knowledge informally and informally leveraging these sources of innovation to improve its growth and welfare, it has now decided to do more to innovate on its own account, hence its major drive to increase formal R&D spending. Thus, it will be an even more formidable player on the global stage.
Key Areas for Strengthening India’s Innovation System
Given the foregoing analysis, there is much that India needs to do to strengthen its innovation system. Time is of the essence given the trends and the increasing competitive demands of the global system, and the strategies of other countries—China in particular.
Table 5 summarizes in matrix form the main assessments made in the preceding section and proposes some areas for policy reform. The list is quite extensive. Furthermore, some of the proposed reforms get into areas where there may be considerable opposition and internal debate in India from various groups. Some of this is based on concerns about national sovereignty and ideology. Others are based on the concerns of groups with vested interests who want to maintain their position vis a vis new entrants, domestic as well as foreign. Thus, in a large complex democracy such as India, there will necessarily be a lot of debate. This process will take time. It is hoped that the analysis presented here can contribute to that debate and that concrete policies and investments will soon emerge.
OPPORTUNITIES FOR U.S.–INDIA COLLABORATION
There are many fertile areas for greater U.S.–India collaboration. These include trade, foreign investment, research, and education, and they are likely to increase as India advances in its reforms.
In trade, there is scope for increased exports and imports from each country to the other. Currently, trade levels are quite low, but the products and services produced by each country are very complementary so there is great potential to increase trade in both goods and services, particularly as India further liberalizes its trade regime.
There is also great scope for increased U.S. foreign investment in India as well as for more Indian investment in the United States. U.S. firms are already the largest investors in India, particularly in ICT service-related areas as well as in R&D centers. There is also much scope for increased strategic technological
TABLE 5 Summary of assessment and of areas in need of improvement
|
|
Current Situation in India |
Areas for Improvement |
|
Creating knowledge domestically through formal R&D |
||
|
Government |
Low public R&D expenditures relative to GDP |
Increase public expenditures on R&D |
|
|
Low efficiency of public R&D expenditures |
Improve the allocation and efficient use of public R&D |
|
|
Little transfer of knowledge created in public sector to productive sector |
Strengthen institutions to commercialize knowledge |
|
|
|
Consider: |
|
|
|
Strengthen:
|
|
Indian firms |
Still low but rising spending by productive firms |
Encourage more R&D spending by productive firms through
|
|
MNCs |
Rapid increase in MNC R&D centers in India is creating shortages and increasing costs of scientific and technical personnel |
Increase the supply of high-level scientific and engineering talent |
|
Creating knowledge domestically through informal efforts |
||
|
Firms, formal and informal sector |
Significant informal activity takes place, but there is little information or support |
|
|
Grassroots innovation and traditional knowledge, including NGOs and other networks |
India has one of world’s largest grassroots innovation systems, supported by Honeybee, GIAN, and SRISTI networks. However, there have been problems with scaling up and disseminating the innovations that come through this system |
Strengthen institutional support through
|
|
|
Current Situation in India |
Areas for Improvement |
|
Acquiring knowledge from abroad through explicit contracts |
||
|
–FDI |
FDI inflows into India are still relatively low in spite of increasing liberalization |
Open sectors further to foreign investment. |
|
|
Foreigners are turned off by bureaucratic hurdles, red tape, corruption, poor infrastructure, and concerns about IPR enforcement |
Improve the investment climate by reducing red tape and corruption and improving physical infrastructure and IPR enforcement |
|
Strategic alliances |
Beginning of some strategic alliances between foreign companies and domestic companies and research institutes |
Increase strategic alliances by private and public sector. Requires more proactive marketing strategy |
|
–Technology licensing |
India has not made much use of foreign technology licensing |
Increase formal technology licensing |
|
Acquiring knowledge from abroad informally |
||
|
–Through Trade |
India is still one of most closed economies of the world structurally (share of imports and exports in GDP) and in terms of tariff and nontariff barriers |
Open economy further to trade by reducing tariff and nontariff barriers |
|
–Through foreign education and training |
Large numbers of Indian students go for tertiary education abroad. Many stay abroad. Some are starting to return |
Develop good system to track students who go abroad for study. |
|
|
Launch public and private campaigns to attract them back by improving local salaries and working conditions |
|
|
–Through more extensive use of Indian diaspora |
There have been greater attempts to tap the Indian diaspora |
Strengthen attempts to tap Indian diaspora |
|
–Through technical literature |
Access to foreign technical literature is limited by costs of books, technical publications, and databases |
Exploit economies of scale in subscriptions through digital libraries and ICT network use |
|
|
Current Situation in India |
Areas for Improvement |
|
Through Internet |
There is considerable access for more sophisticated users in large firms, universities, and research institutes, but this is constrained by low bandwidth even at high end, and there is still a low penetration rate of the Internet for the masses |
Set up high-capacity research education network infrastructure |
|
|
Extend mass spread of Internet penetration by lowering costs, and set up multiple-use Internet kiosks and service centers |
alliances between firms from the two countries. Some of the sectors in which there is strong potential for greater collaboration include pharmaceuticals, engineering goods, automobiles and auto parts, telecommunications equipment and services, and software.
There is also potential for greater collaboration between the United States and India in joint research on energy, environment, and space and in fact, several major agreements have recently been initiated between the two countries. Furthermore, given India’s needs and experience and its large public research institute infrastructure, there is scope for joint work on major public good initiatives in health and preventive medicine as well as in agriculture and sustainable livelihoods.
In addition, there are many opportunities in higher education, including joint degrees, joint ventures, wholly owned subsidiaries or franchises. Furthermore, these are not just from the United States into India, but also from India to the United States. For example, NIT has set up many training facilities and developed specialized corporate training activities in the United States.
CONCLUSION
In sum, India has made great progress but faces daunting challenges. India has many strengths, particularly a young and growing population, experience and institutions of a market economy, a critical mass of entrepreneurs and highly skilled professionals, and a large public research infrastructure. It has the potential to leverage its strengths to improve its competitiveness and welfare. It faces many internal challenges as well as a much more demanding and competitive international environment.
This paper has presented a quick overview of the broad range of issues where India needs to deepen its economic reforms and make additional investments. It has assessed in a little more detail some of the key issues in its innovation system, and identified specific areas that need improvement.
There is also tremendous potential for increased U.S.–India cooperation across many areas. This conference is an opportunity to begin to develop this mutually beneficial cooperation. Hopefully this is just part of a series of events that will help to push the reforms and investment forward. Greater mutual understanding will spur greater public–public, public–private, and private–private cooperation, which will strengthen the mutually beneficial and strategic relationships between these two countries.
Annex
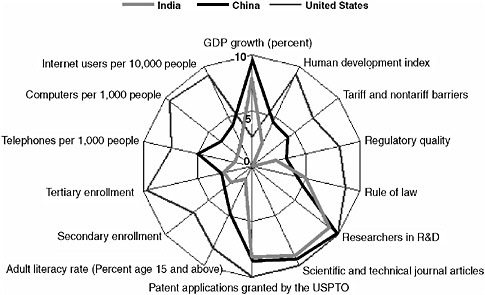
FIGURE A-1 Basic scorecard.
SOURCE: World Bank Institute, KAM 2006, <http://www.worldbank.org/kam>.
TABLE A-1 KAM ranking: How India compares with world regions and BRICKMs
|
Country |
KEI |
Economic Incentive Regime |
Innovation |
Education |
ICT |
KEI 1995 |
Economic Incentive Regime 1995 |
Innovation 1995 |
Education 1995 |
ICT 1995 |
|
G7 |
8.70 |
7.97 |
9.72 |
8.48 |
8.63 |
8.89 |
8.06 |
9.71 |
8.94 |
8.87 |
|
Korea |
7.74 |
5.38 |
9.19 |
7.62 |
8.75 |
7.84 |
6.55 |
8.78 |
8.11 |
7.93 |
|
East Asia |
6.38 |
5.54 |
8.68 |
4.62 |
6.68 |
6.59 |
6.08 |
8.22 |
5.05 |
7.01 |
|
Russia |
6.33 |
2.68 |
8.91 |
7.85 |
5.88 |
6.22 |
2.05 |
9.09 |
7.78 |
5.95 |
|
Europe and Central Asia |
6.17 |
4.77 |
6.95 |
6.67 |
6.27 |
5.96 |
3.66 |
7.32 |
6.45 |
6.41 |
|
World |
5.99 |
4.77 |
8.60 |
4.26 |
6.33 |
6.40 |
5.04 |
8.67 |
4.74 |
7.14 |
|
Brazil |
5.94 |
4.34 |
8.18 |
5.59 |
5.64 |
5.46 |
4.75 |
7.92 |
3.85 |
5.30 |
|
Mexico |
5.74 |
5.43 |
7.59 |
4.37 |
5.58 |
5.82 |
6.07 |
7.31 |
4.40 |
5.52 |
|
China |
5.24 |
3.84 |
9.24 |
3.60 |
4.30 |
4.07 |
2.32 |
8.82 |
3.48 |
1.68 |
|
Middle East and North Africa |
4.93 |
3.91 |
6.24 |
3.71 |
5.84 |
5.05 |
4.76 |
5.67 |
3.83 |
5.93 |
|
Latin America |
4.85 |
4.02 |
5.91 |
4.20 |
5.28 |
5.11 |
4.84 |
5.87 |
4.31 |
5.42 |
|
India |
3.83 |
2.47 |
8.74 |
2.16 |
1.96 |
4.06 |
2.86 |
8.59 |
2.38 |
2.40 |
|
South Asia |
3.30 |
2.27 |
7.46 |
1.88 |
1.58 |
3.74 |
3.49 |
7.56 |
2.03 |
1.88 |
|
Africa |
2.72 |
2.78 |
4.05 |
1.51 |
2.55 |
3.14 |
2.99 |
4.41 |
1.61 |
3.56 |
|
SOURCE: World Bank Institute, KAM 2006, <http://www.worldbank.org/kam>. |
||||||||||


