
3
Childhood Obesity in Texas: An Overview
Eduardo Sanchez, Vice President and Chief Medical Officer, Blue Cross and Blue Shield of Texas, began his presentation by noting that Texas, the second-largest state in the nation, is home to approximately 24 million individuals—roughly 48 percent white, 37 percent Hispanic, 12 percent African American, and 3 percent Asian American. The population is currently growing twice as fast as the U.S. population overall and is projected to increase to 50 million by 2040. With 1,000 babies being born each day, at least half of whom are Hispanic, Hispanics will grow to be the state’s dominant racial/ethnic group by 2040. In this respect, Texas reflects a nationwide demographic trend and serves as a model for the projected racial/ethnic mix of the United States. Sanchez suggested that the obesity challenges faced by Texas today may well become the challenges faced by America in the near future if proactive steps are not taken to reverse the problem.
With 75 percent of its population residing in 25 counties and the remaining 25 percent spread across 229 counties, the state understands the challenges of delivering health care services across urban, suburban, rural, and frontier areas. To facilitate health care delivery, the state has been divided into eight health service regions, each roughly the size of a medium-sized U.S. state and each responsible for administering services to its residents (Figure 3-1).
Demographically, Texas falls slightly below the national average for median household income ($41,645 vs. $44,334 in 2004), and 16.2 percent of Texans fell below the poverty line in 2004, compared with a rate of 12.7 percent for the nation. Poverty appears to be most concentrated
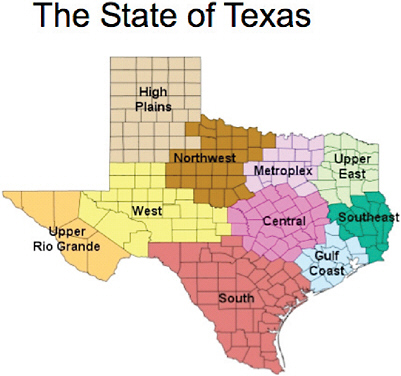
FIGURE 3-1 Texas health service regions, as presented by Sanchez.
among Hispanics and African Americans, as is a lack of health insurance (Table 3-1).
Texas ranks sixth among states in rates of childhood obesity. To emphasize the severity of the problem in the state, Sanchez presented national statistics on childhood obesity and noted that the proportions and trends are higher and more pronounced in Texas. Nationwide, nearly 33 percent of children and adolescents are overweight or obese, 16.3 percent (one in six) of children and adolescents are obese, and 11.3 percent are very obese. Obesity in the United States is particularly prevalent among Latino boys and African American girls aged 6–19 (Table 3-2). These statistics imply a growing obesity problem in Texas given that the proportion of Latino and African American students is increasing, while the proportion of white students is decreasing.
To improve health outcomes and contain future health-related costs, Texas initiated policies designed to address the childhood obesity epidemic (Table 3-3). The first comprised a series of three state Senate bills passed over the course of six years. Senate Bill 19 (2001) featured minimum
TABLE 3-1 Income, Poverty, and Lack of Insurance in Texas
|
Racial/Ethnic Group |
Household Income ($) |
Per Capita Income ($) |
Poverty (%) |
Uninsured (%) |
|
White |
54,920 |
31,051 |
8.2 |
10.4 |
|
Hispanic |
38,679 |
15,603 |
21.5 |
32.1 |
|
African American |
33,916 |
18,428 |
24.5 |
19.5 |
|
Asian American |
66,103 |
29,901 |
10.2 |
16.8 |
|
SOURCE: Information from www.census.gov. |
||||
TABLE 3-2 Prevalence of Overweight and Obesity (body mass index [BMI] >85%)
|
Age, Years |
Boys (%) |
Girls (%) |
||||
|
Whites |
African Americans |
Latinos |
Whites |
African Americans |
Latinos |
|
|
2–6 |
25.4 |
23.2 |
32.4 |
20.9 |
26.4 |
27.3 |
|
6–11 |
31.7 |
33.8 |
47.1 |
31.5 |
40.1 |
38.1 |
|
12–19 |
34.5 |
32.1 |
40.5 |
31.7 |
44.5 |
37.1 |
|
SOURCE: Ogden et al., 2008. |
||||||
TABLE 3-3 Obesity Prevention–Related Policies Targeting Schools in Texas, as Presented by Sanchez
|
Policy |
Year |
Features |
|
Senate Bill 19 |
2001 |
|
|
Texas Public School Nutrition Policy |
2004 |
|
|
Senate Bill 42 |
2005 |
|
|
Senate Bill 530 |
2007 |
|
physical activity requirements for elementary school students, coordinated school health in elementary schools, and instituted School Health Advisory Councils for nutrition and physical activity. Senate Bill 42 (2005) expanded the minimum physical activity requirements to include middle school students. Senate Bill 530 (2007) further enhanced physical activity initiatives for students in grades K–8 and mandated annual testing of physical fitness levels (aerobic capacity, strength, flexibility, body mass index)—known as the Fitnessgram—for youths in grades 3–12 (Box 3-1). This legislation was bolstered by a 2004 mandate of the Texas Department of Agriculture instituting nutrition guidelines and vending machine rules in schools.
Complementing these policy changes, the Texas Department of Health and the Department of State Health Services issued three reports aimed at identifying the scope of and addressing Texas’s obesity problem: Eat Smart Be Active, a strategic plan focused on preventing obesity from 2005
|
BOX 3-1 Fitnessgram: An Overview Fitnessgram was created in 1982 by The Cooper Institute to evaluate children’s fitness levels. (The Cooper Institute was founded in Dallas, Texas, in 1970 by Kenneth H. Cooper, MD, MPH, who is recognized as the leader of the international physical fitness movement.) Fitnessgram is used to assess students in several areas of health-related fitness: cardiovascular fitness, muscle strength, muscular endurance, flexibility, and body composition. Scores are evaluated against objective criteria-based standards, called Healthy Fitness Zones, that indicate the level of fitness necessary for health. The Healthy Fitness Zone standards were established by the Fitnessgram Advisory Board, which includes leading scientists and practitioners in fitness and physical activity. Assessment items include the following:
|
to 2010; Counting Costs and Calories, (Combs, 2007) a report detailing the financial burden of obesity to Texas employers; and the Texas Obesity Policy Portfolio, (Texas Department of State Health Services, 2006) a document chronicling best health policy knowledge associated with obesity prevention and control to serve as a starting point for policy development and implementation.
Concurrently, there were programs under the auspices of the Paso del Norte Health Foundation in two health service regions located in West Texas, which served to reinforce the policy changes and health initiatives instituted by the Texas Legislature. These programs included the Coordinated Approach to Child Health (CATCH) initiative (see Box 3-2), Qué Sabrosa Vida (a healthy-cooking program), and Walk El Paso. These cumulative efforts had a significant impact: the percentage of overweight 4th graders in these health service regions decreased from 25–30 percent for 2000 to 2002 to 15–20 percent for 2004 to 2005.
Despite these encouraging statistics, it is clear that wide-ranging efforts are still needed in Texas. Recent Fitnessgram data reveal that fewer than
|
BOX 3-2 CATCH (Coordinated Approach to Child Health) CATCH is an evidence-based, coordinated school health program designed to promote physical activity and healthy food choices and prevent tobacco use in children from preschool through grade 8. Healthy behaviors are reinforced through a coordinated approach in the classroom, in the cafeteria, in physical education, after school, and at home. CATCH Reach
CATCH Outcomes
|
9 percent of all 12th-grade boys and girls meet the criteria for fitness on all six Fitnessgram tests used in Texas. In addition, border communities appear to be disproportionately affected by the childhood obesity epidemic.
Sanchez concluded his presentation by postulating two possible extremes for the future of Texas. At one extreme, in the absence of positive change, he envisions overweight or obese young adults competing with elderly baby boomers for limited health resources. At the other extreme, he foresees a healthy Texas in which individuals are active and make smart food choices, leading to reduced demand for expensive health resources by young and old alike.
REFERENCES
Combs, S. 2007. Counting Costs and Calories: Measuring the Cost of Obesity to Texas Employers. Texas Comptroller of Public Accounts. http://www.window.state.tx.us/specialrpt/obesitycost/96-1245costs calories.pdf (accessed October 5, 2009).
Ogden, C. L., M. D. Carroll, and K. M. Flegal. 2008. High body mass index for age among U.S. children and adolescents, 2003–2006. Journal of the American Medical Association 299(20):2401–2405.
Texas Department of State Health Services. 2006. Texas Obesity Policy Portfolio. http://www.dshs.state.tx.us/cpcpi/pdf/obesityportfolio.pdf (accessed May 28, 2009).


