
G
Data Sources and Analytical Methods
This appendix presents selected details of the methods used to estimate the food and nutrient intakes of the children and adults.
USUAL FOOD INTAKE ESTIMATION (ESTIMATION OF EPISODICALLY CONSUMED ITEMS)
Foods that are not consumed almost daily present special challenges for estimating usual intakes. If an item is consumed once a week or even less often, then the chances that a respondent will report a positive consumption during one or both of the two survey days is quite small. As a result, the observed daily intakes include a large proportion of zeroes, some of which are “real” (corresponding to the never-consumers) and some of which are “coincidental” (corresponding to the consumers who did not consume the item during the survey days).
Even if the committee did not attempt to separate the real from the coincidental zeroes, the spike in the observed intake distribution introduces some challenges that are difficult to address when attempting to estimate distributions of usual intakes. In particular, this type of intake data violates some of the assumptions that underlie the Iowa State University (ISU) method (Nusser et al., 1996) for estimating usual nutrient intake distributions.
Two approaches have been proposed to address this problem. In 1996, researchers at ISU (Nusser et al., 1996) proposed an extension of the ISU method for nutrients that can be implemented on items that are not consumed almost daily. Much later, in 2006, the National Cancer Institute
(NCI) proposed a different approach to estimate the usual intake distribution of episodically consumed items (Tooze et al., 2006). Both methods have advantages and disadvantages.
The ISU method to estimate the distribution of episodically consumed foods assumes (sometimes unrealistically) that the probability that a person will consume the item is independent of the amount of the item consumed. This is clearly inappropriate for items such as milk and alcohol, where it is clearly seen that persons who tend to consume the items more often also tend to consume more of it when they do consume it. On the other hand, the NCI approach does not easily lend itself to implementation in nationwide food consumption surveys such as the National Health and Nutrition Examination Survey, because incorporating survey weights into the analysis requires additional programming and is quite intensive from a computational viewpoint.
Here, the committee implemented the ISU foods method and tested whether the correlation between probability of consumption and amount consumed was significantly different from zero. If not, then the committee used the estimates that are obtained from the Personal Computer-Software Intake Distribution Estimation (PC-SIDE) Version 1 when the item is declared to be a “food.” If the correlation was significantly different from zero, then the committee implemented the method suggested by Tooze et al. (2006) and then incorporated the survey weights using a parametric bootstrap approach. In most cases, the probability of consumption of the item and the amount consumed did not appear to be correlated and, therefore, the ISU foods method was deemed to be appropriate.
ESTIMATION OF THE PREVALENCE OF INADEQUACY IN AGGREGATED DIETARY REFERENCE INTAKE GROUPS
To estimate prevalence of inadequate intakes in a group that includes a mix of individuals of different ages who have different average requirements for the nutrient, the analysis must be performed using an approach that accounts for the differences. This situation applies to the 2–4-year and the 5–13-year age groups used for developing the recommended Meal Requirements for the Child and Adult Care Food Program (CACFP). Each of these two age groups spans two Dietary Reference Intake (DRI) age groups. The committee describes below two alternative approaches that were used to combine groups.
The first approach is appropriate when the number of persons from each DRI group in the combined group is large enough for estimation of usual intakes. The second approach, which produces prevalence estimates that closely approximate those obtained in the first approach, is more use-
ful when the combined group includes just a few individuals from each of various DRI groups.
Approach 1
Suppose that the committee wished to estimate the prevalence of inadequate intakes of a nutrient with an Estimated Average Requirement (EAR), in a group, and that they had n sample persons, all of whom have provided at least two 24-hour food intake records. Furthermore, suppose that n1 of those persons belong to one DRI group for which the EAR of the nutrient is a units, and that n2 persons belong to a second DRI group for which the EAR of the nutrient equals b units.
The approach the committee implemented in this report to estimate the prevalence of inadequate intakes among the n individuals was the following:
-
The committee first estimated the prevalence of inadequate intakes among the n1 persons by computing the proportion of persons in that subgroup with usual intakes below a. Let p1 denote the estimated prevalence of inadequacy in subgroup 1.
-
The committee then estimated the prevalence of inadequate intakes among the n2 persons by computing the proportion of persons in the second subgroup with usual intakes below b. Let p2 denote the prevalence of inadequacy in subgroup 2.
-
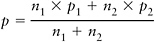
The prevalence of inadequacy in the aggregated group was then estimated as the weighted average of the two prevalences, where the weights were given by the relative sample sizes. If p denoted the overall prevalence, then
The percentiles of the usual intake distribution of the nutrient in the aggregated group are estimated as usual, using the daily intakes reported by persons in both subgroups together.
Approach 2
When the numbers n1 and n2 of persons in each of the two DRI groups was small, the committee could not obtain a reliable estimate of the two prevalences, p1 and p2. In this case, they could still estimate the prevalence of inadequate intakes in the aggregated group as follows:
-
First, select the larger of the two subgroups as the reference group. For example, suppose that n1 > n2. If so, then subgroup 1, with EAR equal to a, is the reference group.
-
Next, scale the daily intakes of persons in subgroup 2, by multiplying them by the factor a/b. By doing this, the committee made the intakes from group 2 comparable to those from subgroup 1. For example, if a = 50 and b = 55, then to compare intakes in subgroup 2 to the EAR in the reference group, the committee decreased them by the factor 50/55.
-
Finally, estimate the proportion of usual intakes below the EAR in the reference subgroup (in our example, subgroup 1) by carrying out calculations using the observed daily intakes in subgroup 1 and the rescaled daily intakes in subgroup 2.
This approximate approach works better when the difference in the EARs in the subgroups is not large (so that the rescaling factor is not much different from 1) and when there is a clearly larger subgroup in the combined group. Both approaches extend in a straightforward manner to the case where the aggregated group consists of more than two DRI subgroups.
PREVALENCE OF IRON INADEQUACY
The distribution of iron requirements in women of child-bearing age is hypothesized to be skewed to the right. As a consequence, the EAR cut-point method cannot be used to estimate the prevalence of inadequate intakes of iron in adolescent and premenopausal women (IOM, 2000). Instead, the probability of iron inadequacy is estimated using the full probability method (NRC, 1986).
For adolescent women ages 14–18 years and for adult premenopausal women ages 19–30 years, the committee estimated the prevalence of iron inadequacy by comparing the women’s usual iron intakes to established at-risk thresholds (see IOM, 2001, Tables I-5 and I-6). In the case of young women ages 11–13 years, the committee assumed that young women were already menstruating and adjusted the risk thresholds corresponding to 14–18-year-olds by shifting the thresholds downward by 0.45 mg. In all cases the committee assumed that the population of women included a mix of oral contraceptive users and nonusers.
To increase the reliability of the prevalence estimate, the committee proceeded as follows:
-
For each DRI subgroup, the committee estimated the parameters of the usual iron intake distribution and generated 5,000 “typical” usual intakes from each of those distributions.
-
Using the typical intakes, the committee estimated prevalence as the average of the 5,000 risks, obtained empirically by comparing the usual intake to the corresponding risk levels.
-
The subgroup specific prevalences were then averaged, using the relative sizes of each DRI subgroup as the weight in the average.
REFERENCES
IOM (Institute of Medicine). 2000. Dietary Reference Intakes: Applications in Dietary Assessment. Washington, DC: National Academy Press.
IOM. 2001. Dietary Reference Intakes for Vitamin A, Vitamin K, Arsenic, Boron, Chromium, Copper, Iodine, Iron, Manganese, Molybdenum, Nickel, Silicon, Vanadium, and Zinc. Washington, DC: National Academy Press.
NRC (National Research Council). 1986. Nutrient Adequacy: Assessment Using Food Consumption Surveys. Washington, DC: National Academy Press.
Nusser, S. M., A. L. Carriquiry, K. W. Dodd, and W. A. Fuller. 1996. A semiparametric transformation approach to estimating usual daily intake distributions. Journal of the American Statistical Association 91(436):1440–1449.
Tooze, J. A., D. Midthune, K. W. Dodd, L. S. Freedman, S. M. Krebs-Smith, A. F. Subar, P. M. Guenther, R. J. Carroll, and V. Kipnis. 2006. A new statistical method for estimating the usual intake of episodically consumed foods with application to their distribution. Journal of the American Dietetic Association 106(10):1575–1587.


