
4
Nutritional Considerations for Infants and Children
This chapter presents the committee’s findings regarding food and nutrient intakes by infants and children. Food intakes by infants and children are compared to findings about current dietary guidance, and nutrient intakes are considered in relation to Dietary Reference Intakes (DRIs). The chapter includes special nutritional considerations relating to weight status, bone health, and iron status. Key foods and nutrients that need to be encouraged or are of concern are identified.
To examine food and nutrient intakes and identify concerns, the committee used the data sets, other source materials, and methods that are described in Chapter 3. In many cases, the committee referred to the analyses conducted for the reports WIC Food Packages: Time for a Change (IOM, 2006) and School Meals: Building Blocks for Healthy Children (IOM, 2010), because those analyses cover the age groups as those served in the Child and Adult Care Food Program (CACFP).
FOOD INTAKES
Infants and Children Younger Than 2 Years of Age
Infants and children younger than 2 years of age are considered together because dietary guidance for this group relies on recommendations of the American Academy of Pediatrics (AAP, 2009). The Dietary Guidelines for Americans does not apply to persons younger than 2 years of age. The age groups of interest are 0–5 months, 6–11 months, and 1 year.
Zero Through 5 Months of Age
Although exclusive breastfeeding is recommended for infants up to 6 months of age (AAP, 2009), breastfeeding proportions in the United States range from 74 percent shortly after birth to 14 percent exclusively breastfeeding at 6 months (CDC, 2010). Breastfeeding prevalence is lower among women in low-income groups than for the general population: 71 percent for those at 100–184 percent of the poverty threshold compared to 78 percent for those at 185–349 percent of poverty (CDC, 2010). The first Feeding Infants and Toddlers Study (FITS), a comprehensive assessment of food and nutrient intakes of infants and toddlers, found that almost 30 percent of infants were fed complementary foods before the age of 4 months, when infants should be consuming only breast milk or formula (Briefel et al., 2004). The AAP, in its most recent recommendations, advises that the introduction of complementary foods be delayed until after 6 months of age (AAP, 2009) (also see Chapter 3, Table 3-1).
Six Months Through 1 Year of Age
A study of participants in the Supplemental Nutrition Program for Women, Infants, and Children (WIC) (USDA/FCS, 1997) found, like the FITS study (Fox et al., 2004), that many 6–11-month-old infants had been introduced to foods earlier than recommended. Almost 25 percent of infants ages 9 through 11 months were fed cow’s milk (Briefel et al., 2004; USDA/FCS, 1997), which AAP (2009) recommends delaying until 1 year of age. Fruit juice intake exceeded AAP recommendations for about 60 percent of the children ages 1–2 years old in FITS (Skinner et al., 2004). Nonjuice fruit and vegetable consumption was low, with approximately 30 percent of infants and toddlers consuming no fruits or vegetables (Fox et al., 2004). The most common vegetable consumed by toddlers 15 months and older was fried potatoes (Fox et al., 2004).
Fox et al. (2006) reported that juice was second only to milk in the amount of energy contributed to the diets of children age 1 year. Among the other foods also reported to contribute significant percentages of the energy intake of children age 1 year were several that are high in solid fat and/or added sugars. These include sweetened beverages (4.7 percent of energy), cookies (3.2 percent), cakes and pies (1.7 percent), and chips and other salty snacks (1.3 percent), among others. Also, notably, more than 60 percent of 1-year-old children enrolled in WIC had usual sodium intakes above the Tolerable Upper Intake Level (UL) (IOM, 2006).
Children Ages 2 Through 18 Years
For each of the MyPyramid food groups, Table 4-1 shows the recommended amounts of food in the MyPyramid patterns and the usual mean intakes at five comparable calorie/age group levels. The basis for comparing food intake data with MyPyramid patterns and for using these age and calorie levels is presented in Chapter 3. Table 4-1 also includes data on the intake of oils and calories from discretionary solid fats and added sugars.
Summary of Food Intake Findings Compared with MyPyramid Amounts
Analysis of the National Health and Nutrition Examination Survey (NHANES 2003–2004) indicates that the intake of dark green vegetables, orange vegetables, and legumes was very low, which is consistent with findings in previous Institute of Medicine reports (IOM, 2006, 2010). Total vegetable intake was low as well, and a substantial portion of the vegetables were in the form of fried potatoes or chips (USDA/FNS, 2008, Table C-22). Compared with vegetable intake, total fruit intake was somewhat closer to the MyPyramid recommendation. However, especially for the younger children, juice accounted for much of the fruit. The consumption of whole grains was very low; however, for most groups, mean total grain intake (nearly all of which was refined grain) was higher than the amount specified in the MyPyramid patterns. The Dietary Guidelines (HHS/USDA, 2005) specifically encourages the intake of a variety of vegetables and three or more ounce-equivalents (or at least half of the grains consumed) as whole grains each day. Total mean milk group intake by the youngest age group exceeded the MyPyramid amount shown in Table 4-1. Although the recommended amount of milk increases from 2 to 3 cups at age 9 years, the mean amount consumed actually decreases with age. Mean intakes of meat and beans were about 60 to 80 percent of MyPyramid amounts.
Intakes of Solid Fats and Added Sugars
As shown in Table 4-1, children’s mean daily intakes of calories from solid fats and added sugars are very high. The 2010 Dietary Guidelines Advisory Committee (USDA/HHS, 2010) emphasizes the importance of reducing intakes of these ingredients in the diet of all Americans, especially children. Estimates from the U.S. Department of Agriculture (USDA) suggest that, for school-age children, the highest contributors of solid fat include sandwiches such as burgers (15 percent), fried potatoes, and pizza with meat, which contributed about 6 percent each (USDA/FNS, 2008,
TABLE 4-1 Comparison of MyPyramid Food Group Patterns with Mean Daily Amounts of MyPyramid Food Groups Consumed by Children, by Age Group
|
Food Group or Componenta |
2–4 Years |
5–13 Years |
14–18 Years |
||||
|
1,300 kcal Patternb |
Mean Intake 2–4 Years |
1,900 kcal Patternc |
Mean Intake 5–10 Yearsd |
Mean Intake 11–13 Yearsd |
2,400 kcal Pattern |
Mean Intake 14–18 Yearsd |
|
|
Total fruit (cup eq) |
1.25 |
1.54 |
1.75 |
1.09 |
0.96 |
2 |
0.94 |
|
Total vegetables (cup eq) |
1.5 |
0.89 |
2.5 |
1.11 |
1.15 |
3 |
1.36 |
|
Dark green |
0.21e |
0.03 |
0.43e |
0.03 |
0.04 |
0.43e |
0.04 |
|
Orange |
0.14e |
0.06 |
0.29e |
0.04 |
0.04 |
0.29e |
0.04 |
|
Dry beans/peas |
0.14e |
0.06 |
0.43e |
0.08 |
0.09 |
0.43e |
0.10 |
|
Starchy |
0.36e |
0.35 |
0.43e |
0.42 |
0.39 |
0.86e |
0.45 |
|
Other |
0.64e |
0.39 |
0.93e |
0.54 |
0.59 |
1e |
0.73 |
|
Total grains (oz eq) |
4.5 |
4.91 |
6 |
6.79 |
7.25 |
8 |
7.57 |
|
Whole grains (oz eq) |
2.25 |
0.49 |
3 |
0.59 |
0.48 |
4 |
0.42 |
|
Total meat and beans (oz eq)f |
3.5 |
2.97 |
5.25 |
3.16 |
3.97 |
6.5 |
4.36 |
|
Total milk group (8 fl oz eq)g |
2 |
2.29 |
3 |
2.46 |
2.17 |
3 |
2.18 |
|
Vegetable oils (g)h |
17 |
12 |
26 |
15 |
17 |
31 |
20 |
|
SoFAS (kcal) |
171 |
567i |
231 |
778i |
781i |
362 |
897i |
|
NOTES: The MyPyramid food intake pattern used is from the Dietary Guidelines for Americans (HHS/USDA, 2005). Eq = equivalent; fl = fluid; g = gram; kcal = calories; oz = ounce; SoFAS = solid fats and added sugars. aSee Appendix Table H-1 for a list of foods in the MyPyramid food groups and subgroups. b1,300-calorie pattern based on an average of the 1,200- and 1,400-calorie patterns. c1,900-calorie pattern based on an average of the 1,800- and 2,000-calorie patterns. dAverage of male and female intake data. eDaily amounts based on the MyPyramid recommendations expressed as cup equivalents per week. fThe MyPyramid meat and beans group includes meat, poultry, fish, eggs, dry beans and peas, and nuts and seeds (http://www.mypyramid.gov/pyramid/meat.html). gThe MyPyramid milk group includes fluid milk; hard, soft, and processed cheese; yogurt; and milk-based desserts (http://www.mypyramid.gov/pyramid/milk.html). The intake data represent mean intake of fluid milk, cheese, and yogurt. Dietary Guidelines advises “3 cups per day of fat-free or low-fat milk or equivalent milk products” for children ages 9 years and older; 2 cups per day for younger children (see HHS/USDA, 2005, p. viii). h5 g = 1 teaspoon. iEstimated on the basis of the number of grams (g) of discretionary solid fat and the number of teaspoons (tsp) of added sugars, as follows: (fat g × 9 calories/g) + (tsp × 4.2 g/tsp 4 × calories/g). SOURCES: Mean intake data from NHANES 2003–2004; MyPyramid patterns from Britten et al., 2006. |
|||||||
TABLE 4-2 Estimated Prevalence of Inadequacy of Selected Micronutrients and Protein Using Usual Intakes in Infants
|
Nutrient |
Estimated Prevalence of Inadequacy (%) |
|
|
WIC Infants, Nonbreastfed, 6–11 Months (n = 275) |
Breastfed Infants, 6–11 Monthsa (n = 143) |
|
|
Iron |
1.7 |
39.5 |
|
Zinc |
0.3 |
60.3 |
|
Protein |
0.6 |
—a |
|
NOTES: n = sample size. aBecause of the lack of data on the quantity of breast milk consumed by breast-fed infants 6–11 months of age, protein adequacy could not be assessed. Iron and zinc adequacy could be estimated because breast milk consumed by breastfed infants has little iron and zinc content. SOURCES: Adapted from IOM, 2006, Table 2-1. Intake data are from 1994–1996 and 1998 Continuing Survey of Food Intake by Individuals (USDA/ARS, 2000); data set does not include intake from dietary supplements (e.g., multivitamin and mineral preparations). Intake distributions were calculated using PC-SIDE (ISU, 1997). Estimated Average Requirements used in the analysis were from the Dietary Reference Intake reports (IOM, 2001, 2002/2005). |
||
Table C-29). By far the largest contributors to children’s intake of added sugars (45 percent of the total amount) are regular soda and noncarbonated sweetened drinks (USDA/FNS, 2008, Table C-30).
NUTRIENT INTAKES
Infants
Data on nutrient intakes by infants, especially very young and/or breastfed infants are limited. Reporting on findings from the first FITS, which included both formula-fed and breastfed infants, Briefel and colleagues (2006) show that Hispanic and non-Hispanic infants ages 4 and 5 months had usual intakes that were all well above the respective Adequate Intakes (AIs) of the 11 micronutrients that were studied.1 For infants ages 6–11 months, mean intakes exceeded the AI for 9 micronutrients.2
Table 4-2, adapted from WIC Food Packages (IOM, 2006), which used data from the 1990s, shows that the prevalence of inadequate iron and zinc intakes were quite high among breastfed compared to formula-fed infants ages 6–11 months. Iron and zinc are the only micronutrients for
which EARs have been set for older infants. The prevalence of inadequacy of protein intake was very low for nonbreastfed infants, ages 6–11 months, and is assumed to be very low for breastfed infants.
Children and Adolescents
Estimates of Energy Intake
In several recent reports (IOM, 2006, 2010; Ziegler et al., 2006), major discrepancies were found between the mean energy intake that was estimated using nationally representative data and the mean Estimated Energy Requirement (EER) that was calculated as described in Chapter 3. For example, reported usual energy intakes exceeded the mean EER by about 400 calories for the younger school-age children, and the energy intakes were lower than the EER for adolescents ages 14–18 years (IOM, 2010). Possible reasons for these discrepancies in estimated energy intake and expenditure include (1) over-reporting of total food intake and underestimation of physical activity level for younger children and (2) under-reporting of total food intake and overestimation of physical activity level by the adolescents. These discrepancies limited the committee’s ability to draw conclusions about the adequacy of energy intake using survey data, but nationally representative data on the prevalence of childhood overweight and obesity provide strong reason for concern about excessive calorie intake (see “Weight Status” under “Special Nutritional Considerations” later in this chapter).
Estimates of Nutrient Inadequacy
Using methods described in Chapter 3, the committee estimated the prevalence of inadequacy of protein and selected vitamins and minerals among children ages 1–18 years. The results are presented by age group in Table 4-3.
In agreement with findings reported in earlier IOM publications (IOM, 2006, 2010), a high prevalence of inadequacy was found for vitamins A, C, and E; phosphorus; and, for adolescents, magnesium (bold values in Table 4-3). In general, the prevalence of inadequacy increased with age and was higher for females than for males. Notably, females ages 14–18 years had a high prevalence of inadequacy for 10 of the 14 nutrients examined. The findings for this group of females are consistent with their low reported mean energy intakes.
TABLE 4-3 Estimated Prevalence of Inadequacy of Protein and Selected Vitamins and Minerals Among Children Based on Usual Nutrient Intakes from NHANESa
|
|
Estimated Prevalence of Inadequate Usual Intakes (%) |
|||||||
|
|
|
5–10 Years |
11–13 Years |
14–18 Years |
||||
|
1 Year |
2–4 Years |
Males |
Females |
Males |
Females |
Males |
Females |
|
|
Protein |
0 |
0 |
0.6 |
3.3 |
1.8 |
6 |
6 |
12 |
|
Vitamin A |
1.6 |
1.8 |
11 |
13 |
29 |
32 |
62 |
56 |
|
Vitamin C |
0.2 |
1.2 |
6 |
5 |
9 |
8 |
39 |
42 |
|
Vitamin E |
82 |
82 |
86 |
88 |
88 |
95 |
94 |
100 |
|
Thiamin |
0 |
0 |
0 |
0 |
0.1 |
0 |
4.9 |
0 |
|
Riboflavin |
0 |
0 |
0 |
0.2 |
0.1 |
0.5 |
2.2 |
1.0 |
|
Niacin |
0.3 |
0.2 |
0.1 |
0.1 |
0.2 |
0.2 |
0.4 |
0.2 |
|
Vitamin B6 |
0 |
0 |
0.2 |
0.4 |
0.6 |
1.1 |
5 |
10 |
|
Folate |
0.2 |
0.1 |
0.2 |
0.1 |
0.6 |
0.3 |
8 |
14 |
|
Vitamin B12 |
0 |
0 |
0 |
0.1 |
0.1 |
0.3 |
0.3 |
2.4 |
|
Phosphorus |
0.2 |
0.1 |
4.0 |
13 |
12 |
39 |
14 |
37 |
|
Magnesium |
0.1 |
0.2 |
7 |
15 |
20 |
45 |
79 |
95 |
|
Iron |
1.5 |
0.7 |
0.2 |
0.2 |
0 |
7b |
1.2 |
9 |
|
Zinc |
0.1 |
0.1 |
0.6 |
2.9 |
1.8 |
9 |
5 |
11 |
|
NOTES: Bold font indicates values with a prevalence of inadequacy greater than 5 percent. Includes pregnant and lactating women. aAll nutrients in this table have an Estimated Average Requirement (EAR). bMethods used to calculate iron values for females 11–13 years old are described in Chapter 3. SOURCES: Intake data from NHANES 2003–2004. The EARs used in the analysis were from the Dietary Reference Intake reports (IOM, 1997, 1998, 2000, 2001, 2002/2005). |
||||||||
Estimates for Nutrients with an Adequate Intake Value
The mean and median intakes for five nutrients (calcium, potassium, fiber, linoleic acid, and α-linolenic acid) were identified by age group and are shown in relation to the AI (see Table 4-4). Sodium is not included in Table 4-4 because the concern is for excessive rather than inadequate sodium intake. Data on vitamin D intakes were not available for the age groups used in this study. However, the recent What We Eat in America survey (USDA/ARS, 2009) includes estimates of vitamin D intakes (for different age groups) and indicates low intakes, especially for adolescent females.
Table 4-4 shows that mean intakes of potassium and fiber were below the AI for all five age groups and that mean intake of calcium was below the AI for the older two age groups and for the 5–10-year-old girls (bold values in Table 4-4). The mean intakes of linoleic and α-linolenic acids were above the AI for all five age groups. It is important to note a concurrent IOM study is reviewing the DRIs for vitamin D and calcium; and
TABLE 4-4 Comparison of Mean and Median Nutrient Intakes from NHANES with the Adequate Intake (AI), by Age Group and Gender
the recommendations from this study may have implications for CACFP participants’ requirements of these nutrients.
Usual Intakes of Macronutrients
Intakes of protein and total carbohydrate generally were within the respective Acceptable Macronutrient Distribution Range (AMDR) (IOM, 2006, 2010). For total fat intakes, about 18 percent of children ages 2–4 years who participated in WIC had intakes below the lower bound of the AMDR (IOM, 2006), whereas nearly the same percentage of school-age children had total fat intakes that were above the upper bound (35 percent) of the AMDR (IOM, 2010). Notably, however, over 3 percent of females ages 14–18 years had low reported fat intakes (USDA/FNS, 2008).
Excessive Intake Levels
In general, the risk of excessive nutrient intakes was low for children. Some notable exceptions follow:
-
Intakes of sodium were clearly excessive for all children ages 2 years and older. Analysis of data from NHANES 2003–2004 shows that more than 80 percent of children ages 1 through 4 years and 83 to 97 percent of school-age children had usual sodium intakes above the UL. This may be an underestimate in that the data sets used for these analyses did not include dietary sodium added in the form of table salt.
-
Approximately 58 percent of WIC children ages 2–4 years had usual zinc intakes above the UL, and about 16 percent of WIC children also had usual intakes of preformed vitamin A above the UL (IOM, 2006). For school-age children, intakes at the 95th percentile of the distribution were well below the ULs for all nutrients with a UL except zinc (IOM, 2010). The zinc intakes that exceeded the UL were observed primarily among children ages 6–8 years. These estimates of children with zinc intakes above the UL are likely low because the data set for these analyses did not include intake from dietary supplements.
-
As found in other reports (IOM, 2006, 2010; USDA/HHS, 2010), analysis of NHANES 2003–2004 data revealed that high percentages (77 to 88 percent) of children ages 3 years and older had saturated fat intakes above the maximum of 10 percent of total food energy advised in the Dietary Guidelines for Americans (HHS/USDA, 2005). The 2010 Dietary Guidelines Advisory Committee (USDA/HHS, 2010) recommended moving toward a goal of no more than 7 percent of total food energy from saturated fat.
-
The 2005 Dietary Guidelines (HHS/USDA, 2005) recommends 300 mg of cholesterol as the maximum daily intake (for all persons who are at least 2 years of age). Cholesterol intakes were fairly consistent with the recommendation, but the prevalence of NHANES 2003–2004 intakes in excess of 300 mg per day increased with increasing energy intake. The prevalence of excessive intake was highest among adolescent males (nearly 16 percent for males ages 11–13 years and nearly 47 percent for males ages 14–18 years). The preliminary report from the 2010 Dietary Guidelines Advisory Committee (USDA/HHS, 2010) recommends moving toward a goal of no more than 200 mg of cholesterol per day. Many children have intakes that would exceed this level.
SPECIAL NUTRITIONAL CONSIDERATIONS
The food- and nutrient-related reference standards that the committee used for examining diet—namely, the American Academy of Pediatrics (AAP) (2009) feeding recommendations for infants and children younger than 2 years (see Chapter 3, Table 3-1), the 2005 Dietary Guidelines (including the MyPyramid patterns, which interpret the guidelines into meals and snacks), and the DRIs—allow a nearly complete examination of foods and nutrients that need to be encouraged or are of concern. It is essential, however, to consider several additional nutrition and health topics: weight status and selected related conditions, and bone health, as discussed below.
Weight Status
The Dietary Guidelines (HHS/USDA, 2005) place a strong emphasis on healthy weight, and the 2010 Dietary Guidelines Advisory Committee (USDA/HHS, 2010), in its preliminary report, emphasizes healthy weight even more strongly. The current guidelines encourage eating and physical activity practices that help reduce the risk of becoming overweight or obese, as defined below. Among the many reasons to emphasize healthy body weight in childhood are the strong associations between obesity and cardiovascular disease risk, hypertension, dyslipidemias (abnormal blood lipid values), and type 2 diabetes—conditions that may begin in childhood and continue into adulthood.
Assessment of Weight Status
The examination of weight status requires the use of stature (length in infants and toddlers, height for children over 2 or 3 years of age) and weight measurements. For infants and toddlers, the committee used the National Center for Health Statistics definition for excess weight, namely, the gender-specific 2000 Centers for Disease Control and Prevention (CDC) weight-for-length growth charts (NCHS, 2007) to define obesity. For children and adolescents ages 2–18 years, the committee used body mass index (BMI) to categorize weight status. The BMI is calculated by dividing the weight in kilograms by the height in meters squared (kg/m2). This index is a good proxy for body fatness at the population level. The committee used the age- and gender-specific reference data for BMI for children published by the CDC (Kuczmarski et al., 2000) as the standard and adopted the CDC terms obese for children and adolescents with a BMI over the 95th percentile and overweight for those with a BMI between the 85th and 95th percentiles (CDC, 2009).
Obesity is prevalent among U.S. children from infancy through adoles-
TABLE 4-5 Prevalence of Overweight and Obesity Among U.S. Children, by Age, 2007–2008
cence. Data from the 2007–2008 NHANES reveal that 9.5 percent of all U.S. children from birth to 2 years of age had high weight for length (>95th percentile) (Ogden et al., 2010). Table 4-5 shows that, during the same period, the prevalence of overweight and of obesity was high for all children ages 2 years and older and was highest in the group ages 6–11 years.
In another analysis of the NHANES 2007–2008 data, Koebnick et al. (2010) found that, of all the ethnic-racial groups considered, non-Hispanic black adolescent children had the highest prevalence of BMI (≥ 85th percentile; 44.5 percent), and Hispanic boys had significantly higher odds of being overweight or obese compared with non-Hispanic white boys (odds ratio [OR] = 1.65 [95% confidence interval (CI): 1.14–2.38]). Non-Hispanic black girls were significantly more likely to have high BMI compared with non-Hispanic white girls (OR for ≥ 85th percentile = 1.58 [95% CI: 0.36–0.65]). Extreme obesity, defined by Koebnick and colleagues as a BMI-for-age ≥ 1.2 times the 95th percentile by the CDC, was observed in 7.3 percent of boys and 5.5 percent of girls. The prevalence of extreme obesity varied among ethnic-racial and age groups, with the highest prevalence in Hispanic boys (as high as 11.2 percent) and African-American girls (up to 11.9 percent).
Data covering the four decades from 1963 to 2005 show that the proportion of obese children ages 2 to 19 years increased substantially (see Figure 4-1). An examination of NHANES data across the period 1999–2008 (Figure 4-2), however, demonstrates that the only statistically significant trend indicating an increased prevalence of obesity occurred at BMIs of ≥ 97th percentile for boys ages 6 through 19 years (data not shown). Even if the prevalence of obesity is no longer rising among children, the high prevalence remains of great concern to the health of the nation’s children.
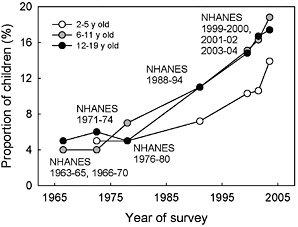
FIGURE 4-1 Prevalence of obesity (≥ 95th percentile) in boys and girls ages 2 to 19 years, 1963–2006.
SOURCE: Derived from Ogden et al., 2006, 2008.
Reasons for Concerns About Obese Weight Status in Childhood
The committee recognizes limitations in the use of BMI as a measure of pediatric obesity (see, e.g., Ebbeling and Ludwig, 2008); however, a number of studies provide evidence that childhood obesity, defined by BMI ≥ 95th percentile, is associated with certain chronic diseases and conditions. These diseases include, for example, type 2 diabetes (Messiah et al., 2008; Weiss and Caprio, 2005), hypertension (high blood pressure) (Jago et al., 2006),
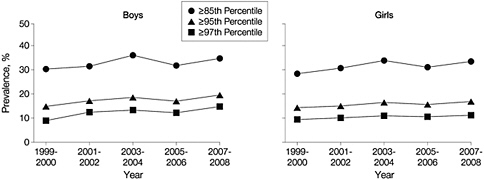
FIGURE 4-2 Prevalence of high BMI-for-age in boys and girls ages 6 through 19 years (all races), data from the 1999–2008 NHANES.
SOURCE: Ogden et al., 2010. Reprinted with permission from the Journal of the American Medical Association. January 2010. 303(3): 247. Copyright © (2010) American Medical Association. All rights reserved.
and metabolic syndrome (De Ferranti et al., 2006) in the short term, and both diabetes and cardiovascular disease over the long term (Baker et al., 2007). Obesity and the associated adverse effects tend to persist: children who are overweight are at increased risk of becoming overweight as adults, and overweight and obesity in adulthood increases chronic disease risk (Ferraro et al., 2003). Earlier IOM reports (IOM, 2007, 2010) on childhood obesity speak to hypertension, type 2 diabetes, metabolic syndrome, cardiovascular disease, and other conditions that are associated with obesity in more detail.
Bone Health
Nutrition and physical activity throughout life are important to bone health, but these factors are especially important during the years of bone growth and calcium accretion. About 40 percent of total skeletal bone mass is acquired within a window of 3–5 years during adolescence, when gonadal steroids and growth hormone secretion are maximal (Weaver and Heaney, 2005). Recent estimates of average calcium accretion suggest that 9–18-year-old boys and girls acquire from 92 to 210 mg of calcium per day (Vatanparast et al., 2010) and can reach peak bone calcium accretion levels ranging from 260 to 400 mg per day (Abrams et al., 2000; Bailey et al., 2000). This period of bone accretion determines adult bone mass, which may be a significant predictor of fracture risk later in life. Meals and snacks provided by the CACFP play an important role in helping children and adults consume an adequate amount of both calcium and vitamin D for bone health.
Foods and Nutrients to Be Encouraged or Limited
Infants and 1-Year-Old Children
Upon reviewing the data concerning the food and nutrient intake and weight status of children from birth through the first year, the committee determined that, in CACFP, priority should be given to promoting breastfeeding and to limiting fruit juice and foods high in solid fats, added sugars, and sodium.
Children Ages 2 Years and Older
Overall, the data on children ages 2 years and older indicate that dietary changes to improve consistency with the Dietary Guidelines and to improve nutrient intake would feature increased intake of a variety of vegetables, whole fruits, and whole grains; increased emphasis on low-fat or fat-free milk products; increased emphasis on very lean meats and/or beans;
and decreased intake of foods high in solid fats, added sugars, and sodium. Especially for females ages 14–18 years, the meals and snacks need to be rich in nutrients but moderate in energy content.
REFERENCES
AAP (American Academy of Pediatrics). 2009. Pediatric Nutrition Handbook, 6th ed. Elk Grove Village, IL: AAP.
Abrams, S. A., K. C. Copeland, et al. 2000. Calcium absorption, bone mass accumulation, and kinetics increase during early pubertal development in girls. Journal of Clinical Endocrinology and Metabolism 85(5):1805–1809.
Bailey, D. A., A. D. Martin, H. A. McKay, S. Whiting, and R. Mirwald. 2000. Calcium accretion in girls and boys during puberty: A longitudinal analysis. Journal of Bone and Mineral Research 15(11):2245–2250.
Baker, J. L., L. W. Olsen, and T. I. A. Sørensen. 2007. Childhood body-mass index and the risk of coronary heart disease in adulthood. New England Journal of Medicine 357(23):2329–2337.
Briefel, R. R., K. Reidy, V. Karwe, and B. Devaney. 2004. Feeding Infants and Toddlers Study: Improvements needed in meeting infant feeding recommendations. Journal of the American Dietetic Association 104(Suppl 1):S31–S37.
Briefel, R., P. Ziegler, T. Novak, and M. Ponza. 2006. Feeding Infants and Toddlers Study: Characteristics and usual nutrient intake of Hispanic and non-Hispanic infants and toddlers. Journal of the American Dietetic Association 106 (1 Suppl 1):S84–S95.
Britten, P., K. Marcoe, S. Yamini, and C. Davis. 2006. Development of Food Intake Patterns for the MyPyramid Food Guidance System. Journal of Nutrition Education and Behavior 38(6 Suppl.):S78–S92.
CDC (Centers for Disease Control and Prevention). 2009. Defining Childhood Overweight and Obesity. http://www.cdc.gov/obesity/childhood/defining.html (accessed July 10, 2009).
CDC. 2010. National Immunization Survey, Provisional Data, 2006 births. http://www.cdc.gov/breastfeeding/data/NIS_data/index.htm (accessed July 1, 2010).
De Ferranti, S. D., K. Gauvreau, D. S. Ludwig, J. W. Newburger, and N. Rifai. 2006. Inflammation and changes in metabolic syndrome abnormalities in US adolescents: Findings from the 1988–1994 and 1999–2000 National Health and Nutrition Examination Surveys. Clinical Chemistry 52(7):1325–1330.
Ebbeling, C. B., and D. S. Ludwig. 2008. Tracking pediatric obesity: An index of uncertainty? Journal of the American Medical Association 299(20):2442–2443.
Ferraro, K. F., R. J. Thorpe Jr, and J. A. Wilkinson. 2003. The life course of severe obesity: Does childhood overweight matter? Journals of Gerontology, Series B: Psychological Sciences and Social Sciences 58(2):S110–S119.
Fox, M. K., S. Pac, B. Devaney, and L. Jankowski. 2004. Feeding Infants and Toddlers study: What foods are infants and toddlers eating? Journal of the American Dietetic Association 104(Suppl 1):S22–S30.
Fox, M. K., K. Reidy, T. Novak, and P. Ziegler. 2006. Sources of energy and nutrients in the diets of infants and toddlers. Journal of the American Dietetic Association 106 (1 Suppl):S28–S42.
HHS/USDA (U.S. Department of Health and Human Services/U.S. Department of Agriculture). 2005. Dietary Guidelines for Americans, 6th ed. Washington, DC: U.S. Government Printing Office. http://www.health.gov/DietaryGuidelines/dga2005/document/ (accessed July 23, 2008).
IOM (Institute of Medicine). 1997. Dietary Reference Intakes for Calcium, Phosphorus, Magnesium, Vitamin D, and Fluoride. Washington, DC: National Academy Press.
IOM. 1998. Dietary Reference Intakes for Thiamin, Riboflavin, Niacin, Vitamin B6, Folate, Vitamin B12, Pantothenic Acid, Biotin, and Choline. Washington, DC: National Academy Press.
IOM. 2000. Dietary Reference Intakes for Vitamin C, Vitamin E, Selenium, and Carotenoids. Washington, DC: National Academy Press.
IOM. 2001. Dietary Reference Intakes for Vitamin A, Vitamin K, Arsenic, Boron, Chromium, Copper, Iodine, Iron, Manganese, Molybdenum, Nickel, Silicon, Vanadium, and Zinc. Washington, DC: National Academy Press.
IOM. 2002/2005. Dietary Reference Intakes for Energy, Carbohydrate, Fiber, Fat, Fatty Acids, Cholesterol, Protein, and Amino Acids. Washington, DC: The National Academies Press.
IOM. 2005. Dietary Reference Intakes for Water, Potassium, Sodium, Chloride, and Sulfate. Washington, DC: The National Academies Press.
IOM. 2006. WIC Food Packages: Time for a Change. Washington, DC: The National Academies Press.
IOM. 2007. Nutrition Standards for Foods in Schools: Leading the Way Toward Healthier Youth. Washington, DC: The National Academies Press.
IOM. 2010. School Meals: Building Blocks for Healthy Children. Washington, DC: The National Academies Press.
ISU (Iowa State University). 1997. Software for Intake Distribution Estimation (PC-SIDE), Version 1.02. ISU, Ames.
Jago, R., J. S. Harrell, R. G. McMurray, S. Edelstein, L. El Ghormli, and S. Bassin. 2006. Prevalence of abnormal lipid and blood pressure values among an ethnically diverse population of eighth-grade adolescents and screening implications. Pediatrics 117(6):2065–2073.
Koebnick, C., N. Smith, K. J. Coleman, D. Getahun, K. Reynolds, V. P. Quinn, A. H. Porter, J. K. Der-Sarkissian, and S. J. Jacobsen. 2010. Prevalence of extreme obesity in a multiethnic cohort of children and adolescents. Journal of Pediatrics 157(1):26–31.e2.
Kuczmarski, R. J., C. L. Ogden, L. M. Grummer-Strawn, K. M. Flegal, S. S. Guo, R. Wei, Z. Mei, L. R. Curtin, A. F. Roche, and C. L. Johnson. 2000. CDC growth charts: United States. Advance Data from Vital and Health Statistics (314):1–28, http://www.cdc.gov/nchs/data/ad/ad314.pdf (accessed July 28, 2009).
Messiah, S. E., K. L. Arheart, B. Luke, S. E. Lipshultz, and T. L. Miller. 2008. Relationship between body mass index and metabolic syndrome risk factors among U.S. 8- to 14-year-olds, 1999 to 2002. Journal of Pediatrics 153(2):215–221.
NCHS (National Center for Health Statistics). 2007. Prevalence of Overweight, Infants and Children Less Than 2 Years of Age: United States, 2003–2004. http://www.cdc. gov/nchs/data/hestat/overweight/overweight_child_under02.htm (accessed March 11, 2010).
Ogden, C. L., M. D. Carroll, L. R. Curtin, M. A. McDowell, C. J. Tabak, and K. M. Flegal. 2006. Prevalence of overweight and obesity in the United States, 1999–2004. Journal of the American Medical Association 295(13):1549–1555.
Ogden, C. L., M. D. Carroll, and K. M. Flegal. 2008. High body mass index for age among U.S. children and adolescents, 2003–2006. Journal of the American Medical Association 299(20):2401–2405.
Ogden, C. L., M. D. Carroll, L. R. Curtin, M. M. Lamb, and K. M. Flegal. 2010. Prevalence of high body mass index in US children and adolescents, 2007–2008. Journal of the American Medical Association 303(3):242–249.
Skinner, J. D., P. Ziegler, and M. Ponza. 2004. Transitions in infants’ and toddlers’ beverage patterns. Journal of the American Dietetic Association 104(Suppl. 1):S45–S50.
USDA/ARS (U.S. Department of Agriculture/Agricultural Research Service). 2000. 1994–1996 Continuing Survey of Food Intakes by Individuals (CSFII 1994–1996) and 1998 Supplemental Children’s Survey (CSFII 1998). Beltsville, MD: ARS.
USDA/ARS. 2009. What We Eat in America, NHANES 2005–2006: Usual Nutrient Intakes from Food and Water Compared to 1997 Dietary Reference Intakes for Vitamin D, Calcium, Phosphorus, and Magnesium. Washington, DC: USDA/ARS.
USDA/FCS (U.S. Department of Agriculture/Food and Consumer Service). 1997. WIC Infant Feeding Practices Study. Final Report. Alexandria, VA: USDA/FCS. http://www.fns.usda. gov/oane/menu/published/wic/files/wicifps.pdf (accessed July 12, 2010).
USDA/FNS (U.S. Department of Agriculture/Food and Nutrition Service). 2008. Diet Quality of American School-Age Children by School Lunch Participation Status: Data from the National Health and Nutrition Examination Survey, 1999–2004. Alexandria, VA: USDA/FNS. http://www.fns.usda.gov/OANE/menu/published/CNP/FILES/NHANES-NSLP.pdf (accessed August 20, 2008).
USDA/HHS (U.S. Department of Agriculture/U.S. Department of Health and Human Services). 2010. Report of the Dietary Guidelines Advisory Committee on the Dietary Guidelines for Americans, 2010. http://www.cnpp.usda.gov/DGAs2010-DGACReport.htm (accessed June 29, 2010).
Vatanparast, H., D. A. Bailey, A. D. G. Baxter-Jones, and S. J. Whiting. 2010. Calcium requirements for bone growth in Canadian boys and girls during adolescence. British Journal of Nutrition 103 (4):575–580.
Weaver, C. M., and R. P. Heaney. 2006. Calcium. In Modern Nutrition in Health and Disease, edited by M. E. Shils, M. Shike, A. C. Ross, B. Caballero and R. J. Cousins. Philadelphia, PA: Lippincott, Williams, and Wilkins.
Weiss, R., and S. Caprio. 2005. The metabolic consequences of childhood obesity. Best Practice and Research: Clinical Endocrinology and Metabolism 19(3):405–419.
Ziegler, P., R. Briefel, N. Clusen, and B. Devaney. 2006. Feeding Infants and Toddlers Study (FITS): Development of the FITS survey in comparison to other dietary survey methods. Journal of the American Dietetic Association 106(1 Suppl):S12–S27.


