Appendix E
Demographic Projections of the Research Workforce in the Biomedical, Clinical, and Behavioral Sciences, 2006-2016 (Using the System Dynamics Simulation Methodology)
OVERVIEW
Appendix D provides demographic projections of the research workforce in the biomedical, clinical, and behavioral sciences for the years 2006-2016 using a traditional statistical (actuarial) approach. This appendix provides additional demographic projections for the same workforces using an alternative approach called system dynamics that is based on the “structure” of the system (i.e., the interconnections among the various entities or parts of the system). In this case, the system under study is the scientific research workforce.
For each of the biomedical, clinical, and behavioral sciences workforces, projections will be shown for the total population along with the populations in the following four (4) demographic categories:
-
U.S.-trained males
-
U.S.-trained females
-
Foreign-trained males
-
Foreign-trained females
In each projection, the beginning population values are the actual values for 2006, the latest published set of data points. For each of the three major workforces (i.e., biological, clinical, and behavioral sciences), three (3) scenarios will be considered.
-
Scenario 1 (Moderate Risk): Use 50 percent of the value of the specified annual growth rate for each subgroup of the workforce. This is rated moderate risk because it is the most likely scenario and has the workforce projections that are most expected.
-
Scenario 2 (High Risk): Use 75 percent of the value of the specified annual growth rate for each subgroup of the workforce. This is rated high risk because it produces very large workforces over the 10-year simulation.
-
Scenario 3 (Low Risk): Use Ph.D. student growth rates in a “pipeline” model into the workforce. This is rated low risk because it is the most conservative set of projections for the workforces.
Figure E-1 shows the projections for the three major workforces for Scenario 1, the most likely scenario.
SUMMARY PROJECTIONS FOR ALL THREE SCENARIOS
Figures E-2 through E-4 show the projections for each of the three major workforces for each of the three scenarios in line-graph form. Tables E-1 through E-3 then show the projections for each of the three major workforces for each of the three scenarios in table form.
DEMOGRAPHIC DETAILS FOR SCENARIO 1 (MODERATE RISK)
Figure E-5 shows the projections for each of the four demographic groups for the biomedical sciences workforce for Scenario 1 in bar-graph form, and Table E-4 shows the same projections in table form.
Figure E-6 shows the projections for each of the four demographic groups for the behavioral sciences workforce for Scenario 1 in bar-graph form, and Table E-5 shows the same projections in table form.
Figure E-7 shows the projections for each of the four demographic groups for the clinical sciences workforce for Scenario 1 in bar-graph form, and Table E-6 shows the same projections in table form.
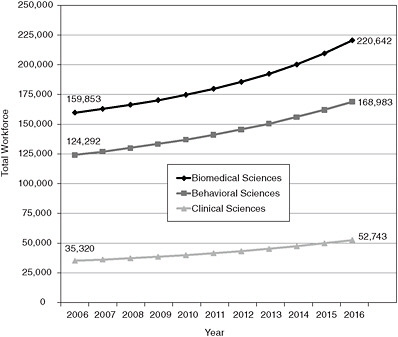
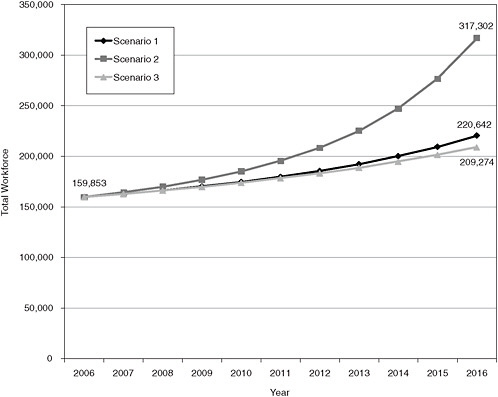
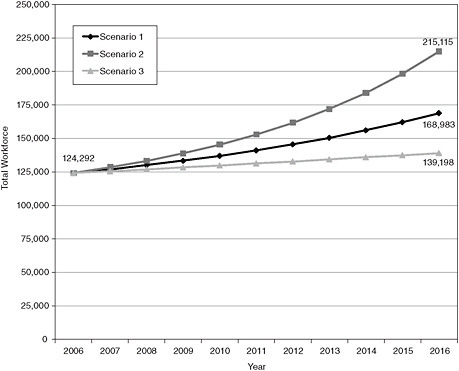
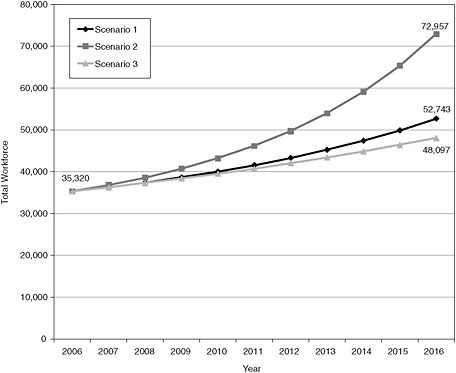
TABLE E-1 Biomedical Sciences Workforce Projections for All Scenarios
|
|
BIOMEDICAL |
||
|
|
Scenario 1 |
Scenario 2 |
Scenario 3 |
|
2006 |
159,853 |
159,853 |
159,853 |
|
2007 |
162,950 |
164,598 |
162,926 |
|
2008 |
166,423 |
170,244 |
166,296 |
|
2009 |
170,339 |
177,046 |
169,995 |
|
2010 |
174,782 |
185,354 |
174,063 |
|
2011 |
179,854 |
195,662 |
178,543 |
|
2012 |
185,684 |
208,677 |
183,489 |
|
2013 |
192,437 |
225,425 |
188,959 |
|
2014 |
200,321 |
247,417 |
195,024 |
|
2015 |
209,607 |
276,908 |
201,764 |
|
2016 |
220,642 |
317,302 |
209,274 |
|
SOURCE: NRC analysis. |
|||
TABLE E-2 Behavioral Sciences Workforce Projections for All Scenarios
|
|
BEHAVIORAL |
||
|
|
Scenario 1 |
Scenario 2 |
Scenario 3 |
|
2006 |
124,292 |
124,292 |
124,292 |
|
2007 |
127,049 |
128,501 |
125,660 |
|
2008 |
130,079 |
133,351 |
127,051 |
|
2009 |
133,414 |
138,958 |
128,465 |
|
2010 |
137,091 |
145,459 |
129,906 |
|
2011 |
141,149 |
153,018 |
131,373 |
|
2012 |
145,634 |
161,832 |
132,871 |
|
2013 |
150,599 |
172,137 |
134,399 |
|
2014 |
156,100 |
184,214 |
135,962 |
|
2015 |
162,203 |
198,404 |
137,561 |
|
2016 |
168,983 |
215,115 |
139,198 |
|
SOURCE: NRC analysis. |
|||
TABLE E-3 Clinical Sciences Workforce Projections for All Scenarios
|
|
CLINICAL |
||
|
|
Scenario 1 |
Scenario 2 |
Scenario 3 |
|
2006 |
35,320 |
35,320 |
35,320 |
|
2007 |
36,327 |
36,859 |
36,291 |
|
2008 |
37,441 |
38,654 |
37,319 |
|
2009 |
38,680 |
40,763 |
38,408 |
|
2010 |
40,061 |
43,256 |
39,562 |
|
2011 |
41,605 |
46,221 |
40,785 |
|
2012 |
43,335 |
49,765 |
42,082 |
|
2013 |
45,279 |
54,024 |
43,456 |
|
2014 |
47,470 |
59,162 |
44,913 |
|
2015 |
49,943 |
65,388 |
46,458 |
|
2016 |
52,743 |
72,957 |
48,097 |
|
SOURCE: NRC analysis. |
|||
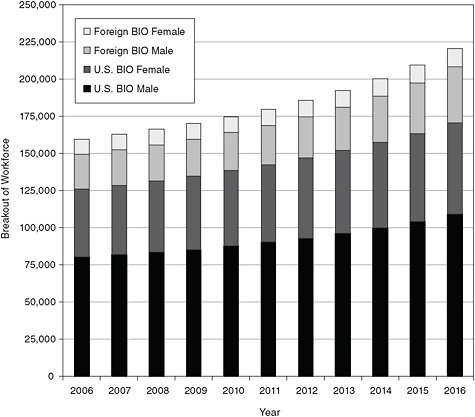
FIGURE E-5 Breakout of biomedical sciences workforce, 2006-2016, scenario 1.
SOURCE: NRC analysis.
TABLE E-4 Breakout of Biomedical Sciences Workforce, 2006-2016, Scenario 1
|
|
BIOMEDICAL - SCENARIO 1 DETAILS |
|||
|
|
US Male |
US Female |
Foreign Male |
Foreign Female |
|
2006 |
80,268 |
45,828 |
23,636 |
10,121 |
|
2007 |
81,782 |
46,989 |
23,943 |
10,236 |
|
2008 |
83,502 |
48,218 |
24,337 |
10,366 |
|
2009 |
85,455 |
49,522 |
24,848 |
10,515 |
|
2010 |
87,675 |
50,906 |
25,517 |
10,684 |
|
2011 |
90,198 |
52,378 |
26,401 |
10,876 |
|
2012 |
93,066 |
53,946 |
27,577 |
11,095 |
|
2013 |
96,327 |
55,618 |
29,147 |
11,345 |
|
2014 |
100,034 |
57,403 |
31,254 |
11,629 |
|
2015 |
104,250 |
59,312 |
34,091 |
11,953 |
|
2016 |
109,044 |
61,356 |
37,919 |
12,322 |
|
SOURCE: NRC analysis. |
||||
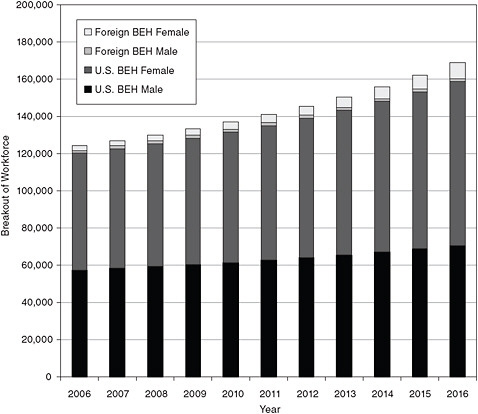
FIGURE E-6 Breakout of behavioral sciences workforce, 2006-2016, scenario 1.
SOURCE: NRC analysis.
TABLE E-5 Breakout of Behavioral Sciences Workforce, 2006-2016, Scenario 1
|
|
BEHAVIORAL - SCENARIO 1 DETAILS |
|||
|
|
US Male |
US Female |
Foreign Male |
Foreign Female |
|
2006 |
57,593 |
62,758 |
1,457 |
2,484 |
|
2007 |
58,495 |
64,335 |
1,464 |
2,755 |
|
2008 |
59,471 |
66,066 |
1,471 |
3,071 |
|
2009 |
60,525 |
67,971 |
1,478 |
3,440 |
|
2010 |
61,665 |
70,069 |
1,485 |
3,871 |
|
2011 |
62,897 |
72,384 |
1,492 |
4,375 |
|
2012 |
64,230 |
74,941 |
1,499 |
4,964 |
|
2013 |
65,671 |
77,770 |
1,507 |
5,652 |
|
2014 |
67,229 |
80,901 |
1,514 |
6,457 |
|
2015 |
68,914 |
84,371 |
1,521 |
7,398 |
|
2016 |
70,736 |
88,221 |
1,529 |
8,498 |
|
SOURCE: NRC analysis. |
||||
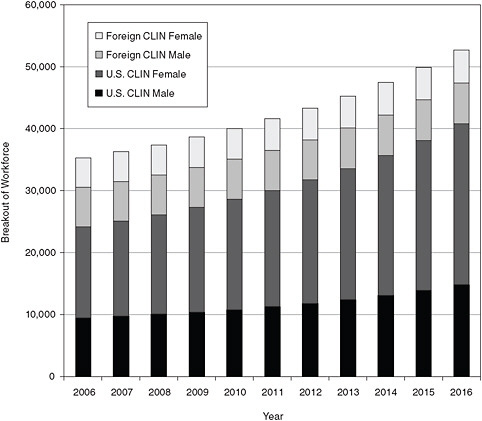
FIGURE E-7 Breakout of clinical sciences workforce, 2006-2016, scenario 1.
SOURCE: NRC analysis.
TABLE E-6 Breakout of Clinical Sciences Workforce, 2006-2016, Scenario 1
|
|
CLINICAL - SCENARIO 1 DETAILS |
|||
|
|
US Male |
US Female |
Foreign Male |
Foreign Female |
|
2006 |
9,457 |
14,706 |
6,359 |
4,798 |
|
2007 |
9,737 |
15,368 |
6,378 |
4,844 |
|
2008 |
10,055 |
16,096 |
6,398 |
4,893 |
|
2009 |
10,417 |
16,902 |
6,417 |
4,944 |
|
2010 |
10,829 |
17,797 |
6,436 |
4,998 |
|
2011 |
11,299 |
18,794 |
6,456 |
5,056 |
|
2012 |
11,835 |
19,909 |
6,475 |
5,116 |
|
2013 |
12,446 |
21,159 |
6,495 |
5,179 |
|
2014 |
13,143 |
22,566 |
6,515 |
5,246 |
|
2015 |
13,938 |
24,154 |
6,534 |
5,317 |
|
2016 |
14,846 |
25,952 |
6,554 |
5,391 |
|
SOURCE: NRC analysis. |
||||
DEMOGRAPHIC DETAILS FOR SCENARIO 2 (HIGH RISK)
Figure E-8 shows the projections for each of the four demographic groups for the biomedical sciences workforce for Scenario 2 in bar-graph form, and Table E-7 shows the same projections in table form.
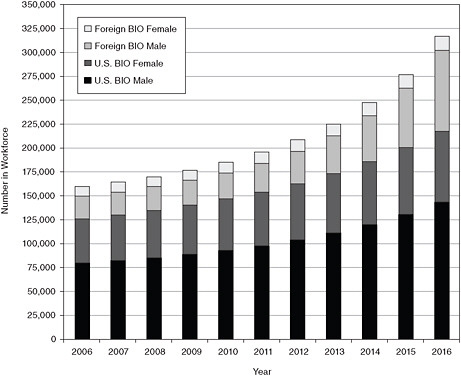
FIGURE E-8 Breakout of biomedical sciences workforce, 2006-2016, scenario 2.
SOURCE: NRC analysis.
TABLE E-7 Breakout of Biomedical Sciences Workforce, 2006-2016, Scenario 2
|
|
BIOMEDICAL - SCENARIO 2 DETAILS |
|||
|
|
US Male |
US Female |
Foreign Male |
Foreign Female |
|
2006 |
80,268 |
45,828 |
23,636 |
10,121 |
|
2007 |
82,594 |
47,588 |
24,119 |
10,297 |
|
2008 |
85,406 |
49,507 |
24,820 |
10,511 |
|
2009 |
88,808 |
51,605 |
25,863 |
10,770 |
|
2010 |
92,923 |
53,908 |
27,439 |
11,084 |
|
2011 |
97,903 |
56,441 |
29,852 |
11,466 |
|
2012 |
103,933 |
59,238 |
33,578 |
11,929 |
|
2013 |
111,235 |
62,333 |
39,367 |
12,490 |
|
2014 |
120,078 |
65,769 |
48,398 |
13,171 |
|
2015 |
130,791 |
69,591 |
62,528 |
13,998 |
|
2016 |
143,771 |
73,855 |
84,676 |
15,000 |
|
SOURCE: NRC analysis. |
||||
Figure E-9 shows the projections for each of the four demographic groups for the behavioral sciences workforce for Scenario 2 in bar-graph form, and Table E-8 shows the same projections in table form.
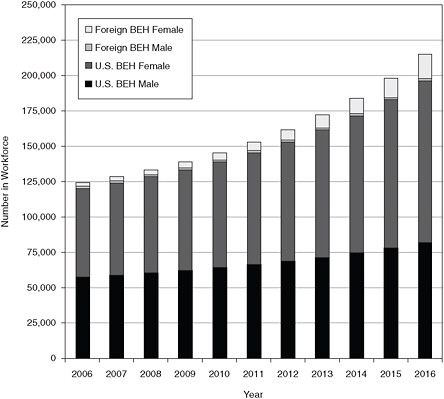
FIGURE E-9 Breakout of behavioral sciences workforce, 2006-2016, scenario 2.
SOURCE: NRC analysis.
TABLE E-8 Breakout of Behavioral Sciences Workforce, 2006-2016, Scenario 2
|
|
BEHAVIORAL - SCENARIO 2 DETAILS |
|||
|
|
US Male |
US Female |
Foreign Male |
Foreign Female |
|
2006 |
57,593 |
62,758 |
1,457 |
2,484 |
|
2007 |
58,966 |
65,165 |
1,467 |
2,902 |
|
2008 |
60,509 |
67,936 |
1,478 |
3,429 |
|
2009 |
62,242 |
71,135 |
1,489 |
4,092 |
|
2010 |
64,190 |
74,842 |
1,499 |
4,928 |
|
2011 |
66,378 |
79,148 |
1,510 |
5,982 |
|
2012 |
68,838 |
84,162 |
1,521 |
7,311 |
|
2013 |
71,602 |
90,014 |
1,532 |
8,988 |
|
2014 |
74,710 |
96,856 |
1,544 |
11,105 |
|
2015 |
78,204 |
104,868 |
1,555 |
13,778 |
|
2016 |
82,132 |
114,264 |
1,567 |
17,154 |
|
SOURCE: NRC analysis. |
||||
Figure E-10 shows the projections for each of the four demographic groups for the clinical sciences workforce for Scenario 2 in bar-graph form, and Table E-9 shows the same projections in table form.
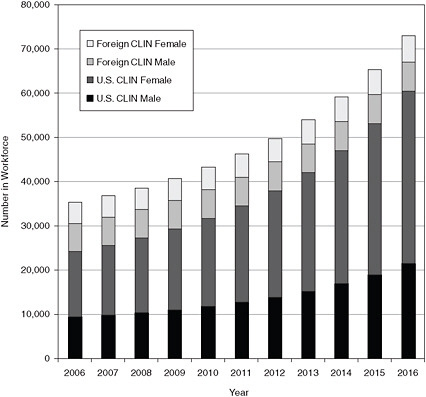
FIGURE E-10 Breakout of clinical sciences workforce, 2006-2016, scenario 2.
SOURCE: NRC analysis.
TABLE E-9 Breakout of Clinical Sciences Workforce, 2006-2016, Scenario 2.
|
|
CLINICAL - SCENARIO 2 DETAILS |
|||
|
|
US Male |
US Female |
Foreign Male |
Foreign Female |
|
2006 |
9,457 |
14,706 |
6,359 |
4,798 |
|
2007 |
9,887 |
15,716 |
6,388 |
4,868 |
|
2008 |
10,408 |
16,886 |
6,417 |
4,944 |
|
2009 |
11,040 |
18,252 |
6,446 |
5,026 |
|
2010 |
11,808 |
19,859 |
6,475 |
5,115 |
|
2011 |
12,741 |
21,765 |
6,505 |
5,211 |
|
2012 |
13,877 |
24,040 |
6,534 |
5,315 |
|
2013 |
15,259 |
26,773 |
6,564 |
5,427 |
|
2014 |
16,943 |
30,076 |
6,594 |
5,549 |
|
2015 |
18,995 |
34,088 |
6,624 |
5,682 |
|
2016 |
21,496 |
38,982 |
6,654 |
5,825 |
|
SOURCE: NRC analysis. |
||||
DEMOGRAPHIC DETAILS FOR SCENARIO 3 (LOW RISK)
Figure E-11 shows the projections for each of the four demographic groups for the biomedical sciences workforce for Scenario 3 in bar-graph form, and Table E-10 shows the same projections in table form.
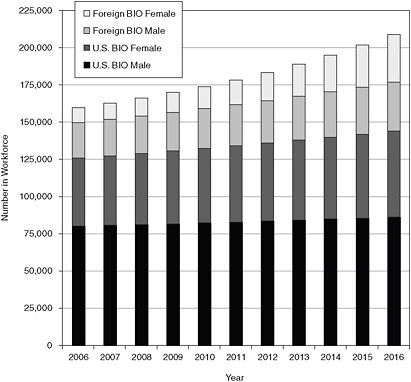
FIGURE E-11 Breakout of biomedical sciences workforce, 2006-2016, scenario 3.
SOURCE: NRC analysis.
TABLE E-10 Breakout of Biomedical Sciences Workforce, 2006-2016, Scenario 3
|
|
BIOMEDICAL - SCENARIO 3 DETAILS |
|||
|
|
US Male |
US Female |
Foreign Male |
Foreign Female |
|
2006 |
80,268 |
45,828 |
23,636 |
10,121 |
|
2007 |
80,747 |
46,823 |
24,295 |
11,060 |
|
2008 |
81,255 |
47,858 |
25,008 |
12,175 |
|
2009 |
81,792 |
48,934 |
25,776 |
13,494 |
|
2010 |
82,358 |
50,051 |
26,602 |
15,052 |
|
2011 |
82,953 |
51,211 |
27,490 |
16,889 |
|
2012 |
83,577 |
52,416 |
28,444 |
19,052 |
|
2013 |
84,230 |
53,666 |
29,465 |
21,597 |
|
2014 |
84,913 |
54,963 |
30,559 |
24,588 |
|
2015 |
85,626 |
56,308 |
31,730 |
28,101 |
|
2016 |
86,369 |
57,702 |
32,981 |
32,223 |
|
SOURCE: NRC analysis. |
||||
Figure E-12 shows the projections for each of the four demographic groups for the behavioral sciences workforce for Scenario 3 in bar-graph form, and Table E-11 shows the same projections in table form.
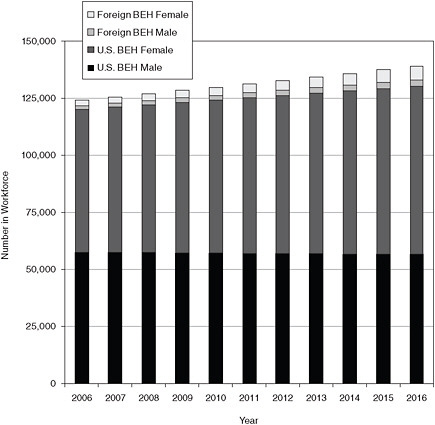
FIGURE E-12 Breakout of behavioral sciences workforce, 2006-2016, scenario 3.
SOURCE: NRC analysis.
TABLE E-11 Breakout of Behavioral Sciences Workforce, 2006-2016, Scenario 3
|
|
BEHAVIORAL - SCENARIO 3 DETAILS |
|||
|
|
US Male |
US Female |
Foreign Male |
Foreign Female |
|
2006 |
57,593 |
62,758 |
1,457 |
2,484 |
|
2007 |
57,491 |
63,830 |
1,605 |
2,735 |
|
2008 |
57,391 |
64,907 |
1,750 |
3,003 |
|
2009 |
57,293 |
65,990 |
1,892 |
3,291 |
|
2010 |
57,197 |
67,078 |
2,031 |
3,600 |
|
2011 |
57,102 |
68,172 |
2,167 |
3,932 |
|
2012 |
57,010 |
69,273 |
2,301 |
4,287 |
|
2013 |
56,920 |
70,379 |
2,432 |
4,669 |
|
2014 |
56,831 |
71,493 |
2,560 |
5,078 |
|
2015 |
56,744 |
72,613 |
2,686 |
5,518 |
|
2016 |
56,659 |
73,739 |
2,809 |
5,991 |
|
SOURCE: NRC analysis. |
||||
Figure E-13 shows the projections for each of the four demographic groups for the clinical sciences workforce for Scenario 3 in bar-graph form, and Table E-12 shows the same projections in table form.
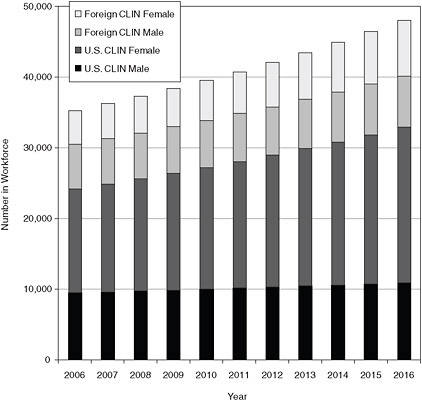
FIGURE E-13 Breakout of clinical sciences workforce, 2006-2016, scenario 3.
SOURCE: NRC analysis.
TABLE E-12 Breakout of Clinical Sciences Workforce, 2006-2016, Scenario 3
|
|
CLINICAL - SCENARIO 3 DETAILS |
|||
|
|
US Male |
US Female |
Foreign Male |
Foreign Female |
|
2006 |
9,457 |
14,706 |
6,359 |
4,798 |
|
2007 |
9,591 |
15,283 |
6,439 |
4,978 |
|
2008 |
9,728 |
15,890 |
6,520 |
5,181 |
|
2009 |
9,869 |
16,528 |
6,604 |
5,408 |
|
2010 |
10,013 |
17,199 |
6,689 |
5,661 |
|
2011 |
10,160 |
17,904 |
6,777 |
5,944 |
|
2012 |
10,311 |
18,645 |
6,866 |
6,259 |
|
2013 |
10,466 |
19,424 |
6,958 |
6,608 |
|
2014 |
10,624 |
20,242 |
7,052 |
6,995 |
|
2015 |
10,785 |
21,101 |
7,148 |
7,424 |
|
2016 |
10,950 |
22,004 |
7,246 |
7,897 |
|
SOURCE: NRC analysis. |
||||
DESCRIPTION OF DATA USED FOR WORKFORCE PROJECTIONS
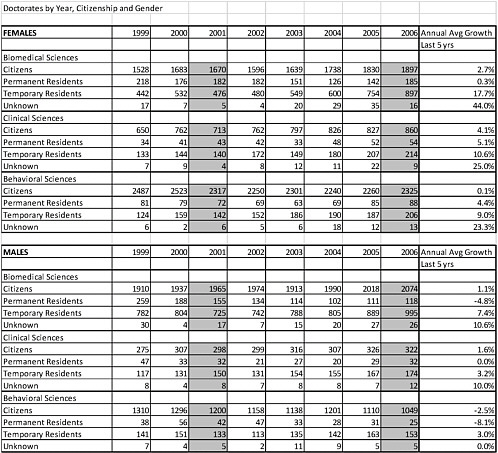
Table E-13 shows the data for U.S.-trained Ph.D.s. In Table E-13, the values in the rightmost columns are the average annual growth rates using the past 5 years of data (i.e., 2001 to 2006) and the past 7 years of data (i.e., 1999 to 2006). The numbers in these columns that are shaded gray are the annual growth rates used for those demographic groups in the workforce projections. To mitigate large changes, the smaller of the two annual growth rates is typically used, or the most reasonable value is used based on inspection.
TABLE E-13 Data for U.S.-Trained Ph.D.s
|
|
|
SOURCE: Data adapted from National Science Foundation Survey of Doctoral Recipients, 1995-2006. |
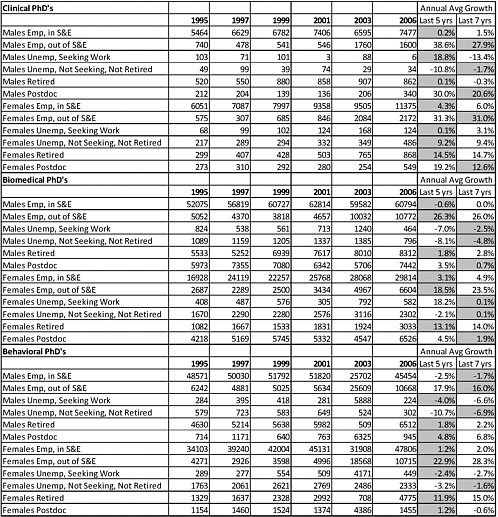
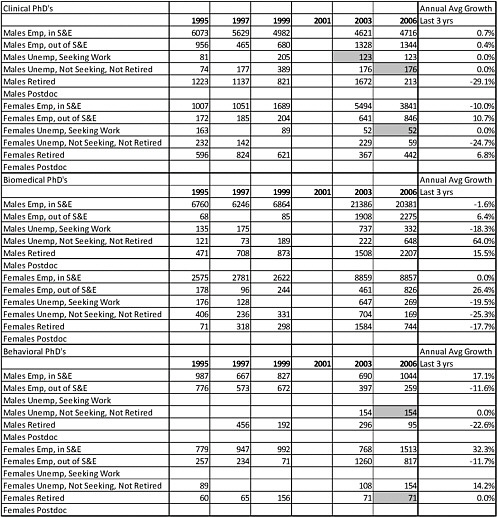
Table E-14 shows the data for foreign-trained Ph.D.s. It should be noted that information regarding foreign-trained Ph.D. students is not as well documented as the information for U.S.-trained Ph.D. students. In Table E-14, the values in the rightmost column are the average annual growth rates using the past 3 years of data (e.g., 2003 to 2006) because there are no data available for 2001. These are the annual growth rates used for the various foreign-trained Ph.D. groups in the workforce projections. Where there are “blanks” in the 2003 or 2006 data, values have been assumed to be the same as either the preceding data or the succeeding data. These cells are shaded gray and will show no growth between 2003 and 2006 because the same numbers are used for both years.
TABLE E-14 Data for Foreign-Trained Ph.D.s
|
|
|
SOURCE: Dara adopted from National Science Foundation Survey of College Graduates, 1995-2006. |
DESCRIPTION OF SYSTEM DYNAMICS MODELS
System dynamics (SD) is the application of feedback control systems principles and techniques to managerial, organizational, and socioeconomic problems. As such, the methodology seeks to bring together multiple views or aspects of the same problem under study and integrate them into a conceptual and meaningful whole. In fact, most difficulties to fully understanding complex issues arise from looking independently at various elements of an issue instead of considering pertinent interrelations. Consequently, optimization is sought for each separate element in the system, which inadvertently leads to sub-optimization of total system performance. With SD, it is possible to take hypotheses about the separate parts of a system, to combine them in a computer simulation model, and to learn both the “local” and “global” consequences of decisions and actions, as well as the impact of these decisions and actions on short-term and long-term performance. Most of the time, the impact on short-term and long-term performance are opposite: an action that looks positive in the short-term is often very detrimental in the long-term. Conversely, an action that produces favorable long-term performance must usually suffer poor performance in the short-term.
SD extends modeling methods traditionally associated with engineering design and feedback control theory into the arena of policy evaluation and management decision making. The following characteristics distinguish SD models from traditional decision support methodologies:
-
Its building blocks are feedback loops;
-
It can accommodate non-linear relationships among variables;
-
It enforces causality;
-
It can include delays;
-
It can model “soft” variables;
-
It can model management policies; and
-
It presents a dynamic environment for decision analysis.
These characteristics are important because they allow SD models to capture the key structural relationships that define a social system. The structure, in turn, produces the dynamic behavior of interest. The resulting simulation mirrors reality because the underlying model structure includes the appropriate feedback loops, causality, delays, and other relationships. SD models include real-world causal logic, which allows someone to trace through the model to see why things happen the way they do.
The SD modeling and simulation approach is different from traditional statistical approaches in several ways. First, the models are more realistic because they capture cause-and-effect linkages, feedback loops, delays, non-linear relationships, and management policies. Second, the simulations are more accurate and reliable because they provide a sanity check on assumptions and are more rigorous than mental models or spreadsheets, allow for analysis of a wider range of issues, and identify the actions that are most effective (and least effective) for improving performance. Third, communication is more effective because the approach is graphical (the connections are easily seen and understood), logical (the results can be traced back to their root causes), and experiential (we learn best by doing and simulation is a good substitute for the real world).
In SD models, a “stock” and “flow” methodology is used in which stocks represent accumulations of “things” (e.g., people, inventory), and flows are the movement of these “things” into, out of, and between stocks (Figure E-14). For Scenario 1 (moderate risk) and Scenario 2 (high risk), a very basic SD model was used in which the stocks represent groups of people in the following categories (which were established based on available data):
-
In Science and Engineering (S&E)—The number of people employed in science and engineering positions (not considered postdoctorates).
-
Out of S&E—The number of people employed in areas other than science and engineering.
-
Unemp Seeking Work—The number of people currently unemployed but are seeking work.
-
Unemp Not Seeking Work—The number of people currently unemployed but not seeking work, but are not retired.
-
Retired—The number of people currently retired.
-
Postdoctorate—The number of people employed as postdoctorates.
The total number of people considered in the “workforce” is the sum of all people that are not retired. Thus, the workforce for any particular demographic group (e.g., U.S.-trained males in biomedical science) is the following:
Workforce = In S&E + Out of S&E + Unemp Seeking Work + Unemp Not Seeking Work + Postdoctorate
The flows in and out of the stocks (e.g., In 1, Out 1) are based on growth rates determined from the data for the specific demographic group and shown earlier in Tables E-13 and E-14. If the growth rate is greater than zero (i.e., positive), then people are added to the stock through the In flow. If the growth rate is less than zero (i.e., negative), then people are removed from the stock through the Out flow. The amount of people that are added or removed is based on the percentage growth rate multiplied by the current number of people in the stock. For example, if 100 people were in a stock and the growth rate is 5 percent, then 5 people would be added to the stock during that simulation step.
Figure E-14 below shows this stock-and-flow diagram for the U.S.-trained males in biomedical science. This exact same model structure is used for all other demographic
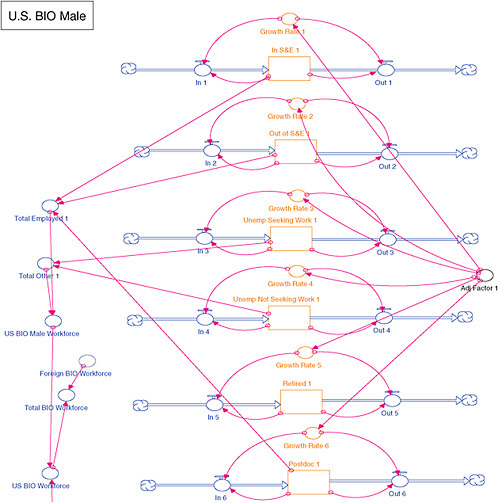
FIGURE E-14 Model for U.S.-trained males in biomedical science for scenarios 1 and 2.
groups (e.g., U.S.-trained females in biomedical science, foreign-trained males in clinical science, etc.). However, different data are used to initialize the model based on which specific demographic group is being modeled.
For Scenario 3, a slightly different stock-and-flow structure is used that includes more of the “supply pipeline” (Figure E-15). For each demographic group, a stock of Ph.D. students is also included that precedes the stock for the entire workforce. (At this point, because the data for Ph.D. students is aggregate, the workforce is represented as aggregate to maintain consistency, as opposed to multiple portions of the workforce as in Scenarios 1 and 2 and in Figure E-14.) The inclusion of the supply pipeline in Scenario 3 is the reason that this scenario is considered low risk. Adding the Ph.D. student pool produces limits to the growth of the following workforce, which is more realistic than letting the workforce
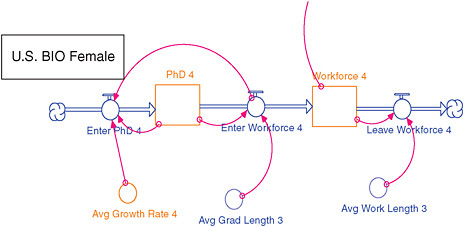
FIGURE E-15 Model for U.S.-trained females in biomedical science for scenario 3.
continue to grow (or shrink) at its current pace. Consequently, the workforce projection numbers are lower for all three major workforces (i.e., biomedical science, clinical science, and behavioral science).
In the pipeline model for each demographic group, the model starts with the number of Ph.D. students and uses the growth rate for Ph.D. students to determine how many Ph.D. students enter the Ph.D. pool. The Avg Grad Length then determines how quickly students move through the Ph.D. pool to enter the workforce. For the purposes of this analysis, the average graduation time is assumed to be 7 years. Thus, 1/7th of the Ph.D. pool enters the workforce each year. For the Workforce, the Avg Work Length determines how many people retire or move out of the workforce each year. For the purposes of this analysis, the average time that someone spends in the workforce is assumed to be 50 years. Thus, 1/50th of the people leave the workforce each year of the simulation.
Table E-15 shows the data used for the Ph.D. pipeline model. The values in the rightmost columns are the average annual growth rates using the past 5 years of data (i.e., 2001 to 2006), as highlighted by the gray shaded cells. The 5-year average annual growth rates are the ones used in the Scenario 3 model for the growth of the Ph.D. student population.
It should be noted that the pipeline model is not complete. Additional stocks could precede the Ph.D. pool (e.g., undergraduate students, K-12 students, etc.) to represent the full pipeline of students progressing up to employment in the workforce. In addition, based on detailed data for the Ph.D. pool, several pipeline models could be used to show the movement through the pipelines for the fields of science, engineering, etc. in addition to the separation of male/female and U.S./foreign.