
Appendix C
The Effects of Play Mixing in the Permian Basin
In the Permian Basin, the USGS defined 10 plays made up of from 1 to 10 clusters from the Significant Oil and Gas Fields of the United States Data Base (see Table C-1). In plays 2, 3, play 5 and play 6, the committee found notable mixing of sandstone and carbonate lithologies. In plays 2 and 3, for example, 17 percent of the fields had sandstone lithologies, while 24 percent had carbonate lithologies. Play 5 (Delaware/Val Verde Basin Gas Play) contained 30 percent carbonate fields and the balance were sandstone fields. Play 6 (Eastern Shelf and Midland Basin Shelf Sequence) contained 31 percent sandstone fields, with the rest carbonate. As the differences in lithology suggest, these plays also contained significant mixing of different types of depositional systems. This mixing of lithologies and depositional systems appears to violate the common definition of “play.”
The following discussion compares the discovery histories as they appear when analyzed according to the USGS's grouping of fields into plays with the discovery histories as they appear when fields grouped into plays have more consistent lithologies and depositional systems. The committee did not review the makeup of the clusters in the data base, nor was it charged to do so. This analysis presents a qualitative, non-statistical review of the use of clusters to formulate plays that suggests the need for more rigorous sensitivity studies of play formulation. The pattern established by the discovery histories varies between the plays as the USGS defined them and the plays as redefined for this analysis; it is very likely that the assessment of resources would also change with a different play grouping.
TABLE C-1. NRG Clusters Included in Permian Basin Plays
|
Play |
Number |
Clusters Included in Play |
|
1 |
301, 303, 313 |
|
|
2 |
305, 307, 309, 323, 333 335, 337, 339, 357, 359 |
|
|
3 |
311, 317, 319, 321, 341 347, 365 |
|
|
4 |
343 |
|
|
5 |
345, 355, 361, 363, 373 |
|
|
6 |
315, 325, 331, 349, 369 371, 375, 377 |
|
|
7 |
367 |
|
|
8 |
379, 381, 383, 399, 401 |
|
|
9 |
385, 387, 395 |
|
|
10 |
389, 391, 393 |
PLAY 5
Analysis of Clusters 361 and 363
In play 5, clusters 355 and 361 contain major carbonate reservoirs, while clusters 363 and 373 contain major sandstone reservoirs. Clusters 361 and 363 represent different depositional systems: cluster 361 represents patch-reef to open-platform carbonate deposition, whereas cluster 363 represents fluvial-deltaic to barrier-strandplain sandstones.
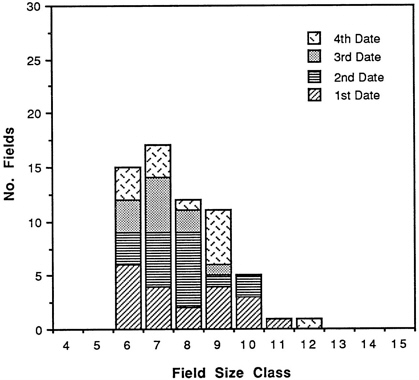
For this analysis, the field discovery histories for clusters 361 and 363 were partitioned into thirds using the same dates as those used by the USGS (the last third of fields discovered was also divided into halves to give four dates). Field-size class versus number of fields in each date bin were then plotted as histograms for each date and also as a cumulative total. This procedure is the same for the several analyses that follow.
Comparing histograms shows some notable differences among them, especially in the cumulative plot for all four dates for each cluster (see Figure C.1, Figure C.2 to Figure C.3). Cluster 363 is skewed toward smaller field sizes; it has a maximum number in class 6 and no class 11 fields, while cluster 361 has a maximum
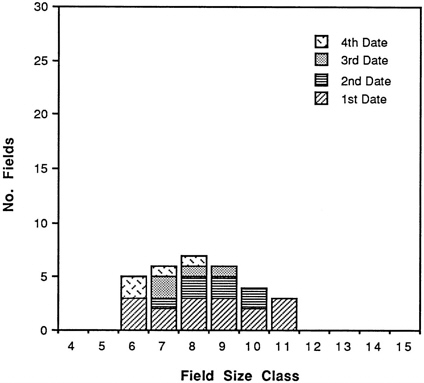
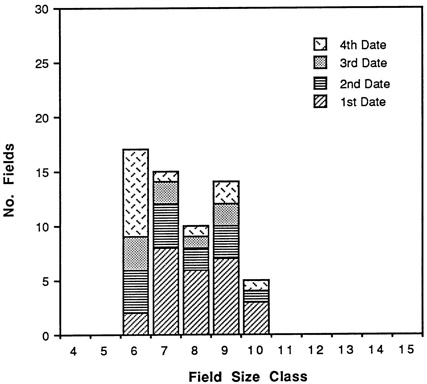
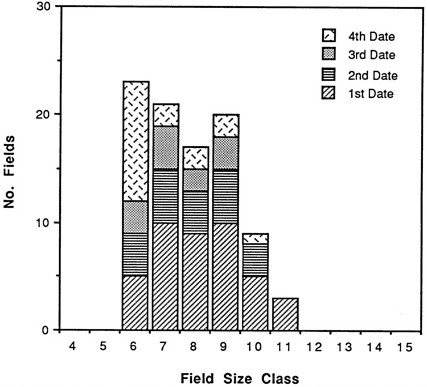
frequency in class 8 and has 3 fields in class 11. The combined data for clusters 361 and 363 are dominated by the pattern for cluster 363 (n = 61 compared with n=31 for cluster 361), which may tend to mask the potential for the remaining smaller fields in cluster 361.
PLAY 6
Analysis of Cluster 375 and the Combination of Clusters 369 and 371
In play 6, cluster 369 includes fields developed in carbonate-open-platform to patch-reef reservoirs, and 371 includes shelf- edge carbonates containing minor basinal sandstones. These contrast with cluster 375, which is made up of submarine-fan/canyon-fill sandstones and was also placed in play 6. Note on the cluster list that cluster 373, which consists of fields in the same depositional system as cluster 375, is part of play 5 rather than play 6. Clusters 373 and 375 may also be analyzed as a combination of clusters within the same depositional system (as is done in the next section), but these clusters were divided between different USGS plays.
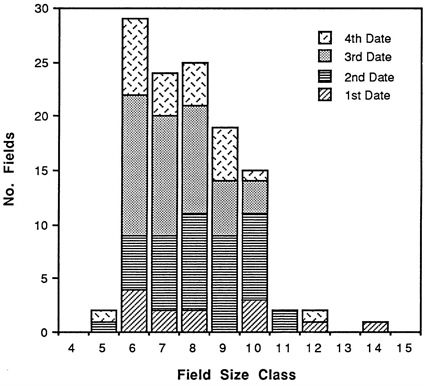
In this analysis, the number of fields in each grouping is almost the same: n = 58 for the combination of clusters 369 and 371 and n = 63 for cluster 375. For the combination of clusters 369 and 371, compared with cluster 375, the field-size/discovery- history histogram looks very different through the first and second thirds (labeled as first date, second date, etc.; see Figure C.4 and Figure C.5). The cumulative plots for the third and fourth dates show the development of a much more filled-out pattern having the expected skew toward smaller field sizes for cluster 375, but the combination of clusters 369 and 371 shows somewhat low field numbers in classes 6 and 7, compared with cluster 375. This may mean that more fields in these size classes might be expected in the future. When the data are combined across all three classes, the cumulative plot takes on a shape in which the combination of clusters 369 and 371 appears as a “base” and cluster 375 appears to shape the frequency peaks (see Figure C.6).
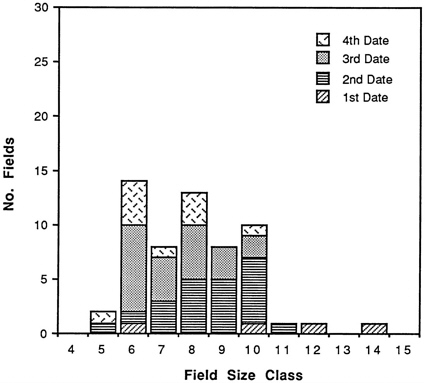
FIGURE C.4 Field-size distribution by discovery date for clusters 369 and 371. These clusters represent primarily carbonate lithologies. The histogram shows somewhat low field numbers in classes 6 and 7, compared with the histogram for cluster 375 (see Figure C.5).
Analysis of Clusters 373 and 375 and the Combination of the Two
To compare the preceding plays that include dissimilar depositional systems with those that may fit together better, we analyzed individually, and in combination, two submarine-fan/canyon-fill sandstone clusters: 373 and 375. We partitioned the discovery history on a barrels of oil equivalent basis, and derived the four dates for the analysis in the same way the USGS derived them.
Patterns shown for each single discovery period are not highly similar for 373 (n = 43) and 375 (n = 63), but the cumulative analyses show generally similar patterns when the first and second periods of discovery are added (see Figure C.7 and Figure C.8). Through the third and fourth periods, the histograms become quite similar for the individual clusters and for the combination of the two. Comparing the cumulative histograms of the two combined clusters with the cumulative histograms of either of the individual clusters shows more similarity, whereas the analyses placing clusters 373 and 375 in different plays show greater differences in the character of the histogram (see Figure C.9). The approach of grouping clusters 373 and 375 together derives from their similar depositional systems. Indeed, the “Atlas of Major Texas Gas Reservoirs” includes a play made up of “Upper Pennsylvanian and Lower Permian Slope and Basinal Sandstones,” very similar to the combination of clusters 373 and 375 (Kosters et al., 1989).
The series of histograms evaluated here shows that a play's discovery history appears different when the play is composed of clusters with different depositional systems and lithologies than it does when the clusters are more homogeneous. This is not a statistically rigorous analysis, but it demonstrates qualitatively that the combination of dissimilar depositional systems within plays could mask additional potential discoveries by suggesting a more complete distribution of discovered fields, especially toward field-size classes 6 and 7. Several large plays developed for Gulf Coast analysis may be equally subject to this phenomenon because of the heterogeneity of the depositional systems included. In the Gulf Coast, the lithology screening (carbonate versus sandstone) may not be as easily applied because these reservoirs are dominantly sandstones. In East Texas, however, the same concerns exist as raised here about the Permian Basin. The fact that the impact of grouping clusters into plays in different ways was not evaluated as part of the assessment suggests that the play content will need analysis and refinement before the next assessment .
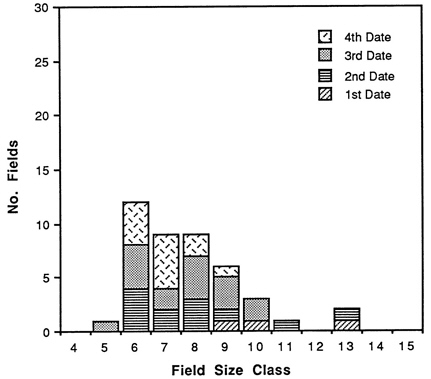
FIGURE C.7 Field-size distribution by discovery date for cluster 373, which represents submarine-fan/canyon-fill sandstone. Note the similarity in shape of this histogram to the histogram for cluster 375 (Figure C.8).
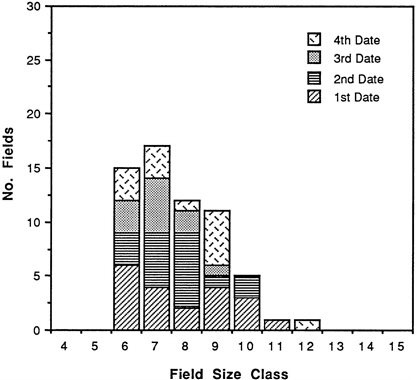
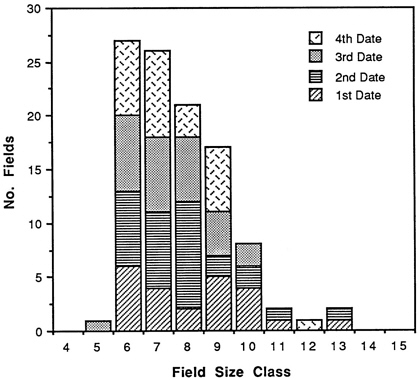
FIGURE C.9 Combined histogram for clusters 373 and 375. Note the similarity in shape of this combined histogram with the individual histograms for the two clusters (Figure C.7 and Figure C.8).


