
Mortality among the Offspring (F1) of Atomic Bomb Survivors, 1946–85
Yasuhiko Yoshimoto, Ph.D.; William J.Schull, Ph.D.; Hiroo Kato, M.D.; James V.Neel, Ph.D., M.D., Sc.D.
Reproduced, with permission, from the Technical Report Series, Radiation Effects Research Foundation, Hiroshima and Nagasaki, Japan.
Mortality among the Offspring (F1) of Atomic Bomb Survivors, 1946–85 §
Yasuhiko Yoshimoto, Ph.D.1; William J.Schull, Ph.D.2; Hiroo Kato, M.D.3; James V.Neel, Ph.D., M.D., Sc.D.4
1RERF Department of Epidemiology;2RERF Permanent Director;3RERF Consultant and Director-General, National Institute for Minamata Disease;4RERF Consultant Emeritus and Department of Human Genetics, University of Michigan Medical School
Summary
We compare deaths occurring in the years 1946–85 in a cohort of 31,159 children born to parents one or both of whom were exposed to the atomic bombing of Hiroshima or Nagasaki, and received a combined (i.e., joint) gonadal dose of 0.01 Sv or more, with deaths in a comparable control group, totaling 41,069 children. The average combined gonadal dose equivalent for the exposed parents was 0.435 Sv. Gonadal doses were calculated using the recently established DS86 system, supplemented by an ad hoc system for those children for whom a DS86 dose could not be computed for one or both parents. At the end of 1985, those members of the study groups born in 1946 had reached 39 years of age, whereas those born in the years 1966 through 1984 had not yet reached their 20th birthday. The mean age of living members of the cohorts was 28.8 years.
When a linear relative risk model is fitted to the data, no statistically significant increase in the risk of mortality attributable to diseases other than neoplasms is noted following parental exposure, the excess relative risk being 0.030 (±0.046) per sievert based on the subset of individuals with DS86 doses, assuming the RBE of neutrons to be 20. For fatal cancer, in confirmation of an earlier report on cancer incidence below the age of 20 in this same group, again no statistically significant effect was observed as parental radiation dose increased. Finally, although the present method of analysis using Poisson regression and person-years at risk of death seems more appropriate now, particularly as the cohort ages—since earlier analyses of mortality in the F1 cohort have been based on a simple linear regression of the frequency of death on parental dose—this model was also fitted to the data used in the relative risk estimate to provide some continuity with the past. The results give an intercept of 0.0420 (±0.0015) and a linear regression coefficient of 0.00169 (±0.00157) per sievert. This leads to the calculation of a (statistically nonsignificant) excess relative risk of 0.040, in good agreement with the excess
|
§ |
The complete text of this report will not be available in Japanese. Approved 28 January 1991 Printed February 1991 |
obtained by fitting the relative risk model. An analysis based on the full sample, using not only the DS86 dose group but also the ad hoc dose group, yields essentially the same result as the analysis restricted to the DS86 dose group.
Introduction
An extensive literature on the genetic effects of exposure to ionizing radiation in experimental situations supports the belief that exposure of human germ cells to ionizing radiation will result in deleterious mutations that may lead to disease, disability, or premature death. 1,2 The collection of the epidemiological evidence which will permit a precise estimate of the extent and nature of the genetic effects to be anticipated in human populations has proceeded much more slowly than the experimental studies. The principal sources of such evidence are the cohorts of children born to survivors of the atomic bombings (A-bombings) of Hiroshima and Nagasaki, who for some 40 years have been the subjects of an investigation into the possible genetic effects attributable to the exposure of human populations to ionizing radiation.
These investigations began in 1948 and in the succeeding six years some 70,000 pregnancies occurring in Hiroshima and Nagasaki were studied with respect to congenital malformations, stillbirths, and deaths in the first 14 days following parturition.3,4 In addition to these early clinical studies, this series of investigations later assessed the frequency of biochemical mutations,5,6 cytogenetic abnormalities,7 and survival8–10 among the children of A-bomb survivors and of controls, collectively referred to as the F1. Recently the incidence of cancer with onset prior to age 20 among the children of survivors has also been investigated.11 Each of these studies has failed to show a significant genetic effect of exposure to A-bomb radiation with the single exception of an early report12 of changes in the sex ratio of the children of exposed survivors, a report not confirmed by later studies.13 However, the interpretation of the biological significance of the early changes observed in the sex ratio among these children has been complicated by later discoveries of the Lyonization phenomenon (mosaic inactivation of one X-chromosome in females) and the occurrence of sex chromosomal aneuploidies.13,14
In 1990, Gardner et al.15 reported an increased frequency of leukemia in children of fathers employed at the Sellafield nuclear reprocessing facility in England, an increase which had not been observed in an earlier Japanese study. 16 This report has prompted a renewed interest in the genetic effects of radiation, and in particular, in the risk of cancer among the F1 children. In this paper, we focus on updating the earlier studies on mortality among liveborn infants, the data now encompassing the years 1946–1985. This is the first analysis of these data based on the revised estimates of the A-bomb survivors'radiation exposures which became available in 1986 (DS86). With particular reference to the Gardner report, this paper contains data on death from malignancies, including leukemia, not available in the earlier studies on A-bomb effects.11,16
Design of the Study
The study of the survival of children born alive to survivors of the A-bombings uses as the basis for death ascertainment the obligatory family registries (koseki) that exist in Japan. Some characteristics of these children and their parents obtained during the early clinical study and pertinent to the present study will now be reviewed.
The population
The Radiation Effects Research Foundation (previously the Atomic Bomb Casualty Commission [ABCC]) continually surveys the survival of a cohort of children born to the survivors of the A-bombings of Hiroshima and Nagasaki. The population to be examined in the present analysis consists of 72,228 children born alive from 1 May 1946 through December 1984, specifically 31,159 children one or both of whose parents received gonadal radiation =0.01 Sv and a control group of 41,069 children whose parents received <0.01 Gy gonadal radiation at the time of the bombing (ATB) (Table 1). Two criteria were used to select these individuals from the larger F1 mortality sample, consisting of 76,817 persons. First, the current survival status of a sample member had to be established; this excluded 799 individuals because no koseki records existed (individuals of foreign nationality, such as Koreans, do not normally have such records), or because the survival status could not be determined. Second, sufficient information had to exist to assign a dose estimate for both parents of an individual; this excluded 3,790 subjects.
Originally, the F1 mortality study consisted of three age-, sex-, and city-matched cohorts born between May 1946 and December 1958, namely, 1) all children born to survivors residing in Hiroshima or Nagasaki, one or both of whom were within 2,000 m of the hypocenter ATB (the so-called proximally exposed); 2) children born to parents from either city ATB both of whom had been >2,500 m from the hypocenter, or born to one parent who had been >2,500 m from the hypocenter with the other parent not in the city (NIC) ATB (the distally exposed); and 3) children born in either city to parents who were NIC ATB.8 Collectively these three cohorts now consist of 50,529 individuals.
Through examining the pertinent family registers, the original study sample was subsequently enlarged to include births between 1959 and 1984 to parents in the three original groups—proximally exposed, distally exposed, or NIC—described above, and to parents who would have qualified for inclusion in these groups had they been old enough to have had children prior to 1959 (this addition is known as the F1 mortality sample extension [F1-Ext], and consists of 21,699 subjects, see Table 1). The exposed parents of these individuals were 0–34 years old ATB. Of these individuals, 10,811 had parents one or both of whom were exposed ATB to a total kerma dose of 0.10 Gy or more based on the previously employed T65D17 dose schedule. The remainder (10,888 individuals) were born to parents who were exposed to doses of 0.09 Gy or less based on T65D total kerma dose; no children of
parents both of whom were NIC ATB were included in this F1-Ext sample. Births to A-bomb survivors have decreased markedly with time and in 1984 only three such births occurred; thus, the original and extended samples embrace most, if not all, of the children to be born in these cities to the survivors proximally exposed to the A-bombings.
Dosimetry
The estimated parental doses used in the present study are based on the revised dosimetry system known as the DS86.17 At present, combined (i.e., joint) parental gonadal doses based on this system have been assigned for 67,586 (94%) of the 72,228 children (Table 1). Among the remaining 6%, the principal reasons for not directly assigning a parental DS86 gonadal dose are either a lack of detailed information on the individual's shielding ATB or the present inability of the DS86 system to cope with the complex shielding of some of the survivors. These individuals had, however, been assigned a gonadal dose under an earlier system known as T65D. Since a disproportionate number of these children were born in the early years of the study, it was felt to be important to include them in the analysis. Accordingly, for the present analysis they were assigned a gonadal dose on the basis of an empirical conversion factor derived from persons for whom both T65D and DS86 doses were available (the details are described elsewhere).4 Individuals NIC ATB have, of course, been automatically assigned zero dose. All analyses reported in this paper are based on the combined (joint) gonadal doses of father and mother. Since, as will be shown, none of the findings approach statistical significance, separate analyses for maternal and paternal effects were not undertaken.
Table 1. Number of subjects by city, sex, sample class, and parental gonadal dose equivalent categories. The neutron component of the radiation has been assigned an RBE of 20.
|
F1 mortality sample |
|||
|
Group |
Sample of DS86 dose estimates |
Full sample |
|
|
Total |
67586 |
72228 |
|
|
Parental gonadal dose |
0 Sv |
=40692 |
41069 |
|
=0.01 Sv |
=26894 |
31159 |
|
|
City |
Hiroshima |
=43188 |
44852 |
|
Nagasaki |
=24398 |
27376 |
|
|
Sex |
Male |
=34684 |
37044 |
|
Female |
=32902 |
35184 |
|
|
Major sample |
Original |
=47330 |
50529 |
|
F1-Ext |
=20256 |
21699 |
|
The unit of absorbed ionizing radiation is the gray, but because of the mixed gamma-neutron exposure, gonadal doses are expressed in sieverts. In calculating sieverts, the relatively small neutron component of the radiation exposure has been assigned an RBE of 20. The International Commission on Radiation Units and Measurements in its assessment of maximum RBE values at low doses, for fission neutrons versus gamma rays, has found a range of 10–45 for genetic endpoints in mammalian systems.18 Likewise, the Committee on the Biological Effects of Ionizing Radiation (BEIR-V) has suggested a value of about 5 for high dose rate comparisons and a range of 15–50 for low dose rate studies.2 We believe an RBE of 20 to be reasonable considering the uncertainty in current estimates. As we will subsequently show, the exact RBE chosen exerts only a minor influence on the results of our analysis, because the DS86 gonadal neutron dose is very small.
The mean combined parental gonadal dose equivalents are shown in Table 2. In the =0.01 Sv dose group, the combined parental gonadal dose equivalent averages 0.405 Sv (0.047 Sv of neutron and 0.358 Sv of gamma) for the subset of children both of whose parents have been assigned DS86 doses. Of the 4,642 children whose parents lacked DS86 doses, there were 4,265 (91.9%) for whom parental combined gonadal doses were =0.01 Sv under the ad hoc dosage system. The average combined gonadal dose for the full sample (DS86 plus ad hoc doses) with doses of =0.01 Sv is 0.435 Sv, slightly higher than for the subset on whom formal DS86 doses exist.
Characteristics of the study population
1. Year of birth, parental age, and the sex of the sample subjects. Year of birth is available on all of the sample subjects, since a known birth date was necessary for the inclusion of an individual in the study group. As a result of the early clinical study, maternal and paternal ages are available for 67.6% (48,838) and 54.8% (39,603) of the 72,228 children, respectively. Mean maternal age at the birth of these children was 28.2 years (range: 15–53), and mean paternal age was 32.6 years (range: 17–71). Mean parental age ATB in the F 1-Ext sample of course differs from that in the F1 original sample. In the F1 original sample, the average ages ATB are 28.3 (range: 7–65) for the father and 22.1 years (range: 5–46) for the mother if he or she received 0.01 Sv or more. However, since the extension sample involves a disproportionate number of survivors who were too young to have had a child prior to 1959, the average ages ATB in this group are 10.2 years (range: 0–42) for the father and 7.7 (range: 0–31) for the mother.
Given the importance of the sex of an individual in determining mortality rates, particularly in the early years of life, we have examined the ratio of male births to female births among the F1 children to determine whether a sex bias might exist as a result of the addition of the F1-Ext sample and the use of the DS86 doses.
Table 2. Distribution of combined parental gonadal dose equivalents and mean doses in dose categories.
|
Total |
0a |
0.01–0.09 |
0.10–0.49 |
0.50–0.99 |
1.00–2.49 |
=2.50 |
=0.01 |
||||||||||
|
City |
Item |
Ab |
Bb |
A |
B |
A |
B |
A |
B |
A |
B |
A |
B |
A |
B |
A |
B |
|
Hiroshima |
Number |
43188 |
44852 |
25922 |
26007 |
6601 |
7001 |
7143 |
7835 |
1848 |
2002 |
1273 |
1467 |
401 |
540 |
17266 |
18845 |
|
Neutron |
0.001 |
0.001 |
0.0 |
0.0 |
0.000 |
0.000 |
0.001 |
0.001 |
0.004 |
0.004 |
0.013 |
0.013 |
0.049 |
0.050 |
0.003 |
0.003 |
|
|
Gamma |
0.132 |
0.147 |
0.0 |
0.0 |
0.041 |
0.041 |
0.214 |
0.212 |
0.604 |
0.605 |
1.283 |
1.288 |
2.847 |
2.871 |
0.329 |
0.350 |
|
|
Total dose equivalent |
0.155 |
0.175 |
0.0 |
0.0 |
0.041 |
0.041 |
0.233 |
0.231 |
0.690 |
0.692 |
1.546 |
1.554 |
3.824 |
3.866 |
0.388 |
0.417 |
|
|
Nagasaki |
Number |
24398 |
27376 |
14770 |
15062 |
4047 |
4641 |
2720 |
3701 |
1646 |
2362 |
1022 |
1300 |
193 |
310 |
9628 |
12314 |
|
Neutron |
0.001 |
0.001 |
0.0 |
0.0 |
0.000 |
0.000 |
0.0004 |
0.0004 |
0.002 |
0.002 |
0.005 |
0.005 |
0.018 |
0.016 |
0.001 |
0.001 |
|
|
Gamma |
0.161 |
0.196 |
0.0 |
0.0 |
0.030 |
0.031 |
0.243 |
0.249 |
0.691 |
0.678 |
1.327 |
1.320 |
3.425 |
3.181 |
0.409 |
0.436 |
|
|
Total dose equivalent |
0.172 |
0.209 |
0.0 |
0.0 |
0.030 |
0.031 |
0.250 |
0.257 |
0.729 |
0.714 |
1.423 |
1.416 |
3.793 |
3.510 |
0.435 |
0.464 |
|
|
Combined |
Number |
67586 |
72228 |
40692 |
41069 |
10648 |
11642 |
9863 |
11536 |
3494 |
4364 |
2295 |
2767 |
594 |
850 |
26894 |
31159 |
|
Neutron |
0.001 |
0.001 |
0.0 |
0.0 |
0.000 |
0.000 |
0.001 |
0.001 |
0.003 |
0.003 |
0.009 |
0.009 |
0.039 |
0.038 |
0.002 |
0.003 |
|
|
Gamma |
0.142 |
0.166 |
0.0 |
0.0 |
0.037 |
0.037 |
0.222 |
0.224 |
0.645 |
0.644 |
1.303 |
1.303 |
3.035 |
2.984 |
0.358 |
0.384 |
|
|
Total dose equivalent |
0.161 |
0.188 |
0.0 |
0.0 |
0.037 |
0.037 |
0.238 |
0.240 |
0.708 |
0.704 |
1.491 |
1.489 |
3.814 |
3.736 |
0.405 |
0.435 |
|
|
NOTE: Neutron and gamma doses are expressed in gray, but total mean dose is expressed in sieverts with the neutron component assigned an RBE of 20. a We have assigned zero value as a parental dose for those parents who were not in the city at the time of the bombing. Parents whose joint gonadal doses were estimated to be less than 4 mSv have been assigned to the zero dose group. b A is the subset of children both of whose parents have been assigned DS86 doses. B is the full sample. |
|||||||||||||||||
Because of the procedure for the sample selection, for children born during 1946–58 the proportion of males among the F1 children has to be examined in the children of proximally exposed parents whereas for the F1-Ext sample the data are for the group of children born to parents exposed to a dose of 0.10 Gy or more total kerma as calculated by the T65D dose schedule. In these samples there is no significant change in the proportion of males among the F1 children in relation to parental dose (Table 3), and thus no evidence that the mortality surveillance sample is biased toward one sex or the other.
Parenthetically, it should be noted that the analysis presented in Table 3 using the DS86 dose schedule confirms the results of an earlier analysis based on the T65D dose schedule.13 The least ambiguous sex ratio data are based on maternal exposure. In this case, the induction of sex-linked recessive mutations should decrease the proportion of male births. We note, however, that for the total data the regression term is (insignificantly) positive, i.e., opposite in direction from the negative value expected theoretically.
2. Other factors. Information is available on parity, duration of pregnancy, and birth weight for those 41,649 of the 72,228 (57.7%) children who were born between 1948 and 1958, since these data were routinely obtained at the time of the early clinical study.3 Because of the correlation between duration of pregnancy and birth weight (r=0.342), only the relatively uncorrelated distributions of birth weight and parity (r=0.117) are shown in Figure 1. The chi-square statistics for tests of the homogeneity of the distributions of these variables among parental dose groups are 27.07 (df=15, p=.03) for birth weight and 66.56 (df=20, p<.01) for parity. Although there is no simple relationship between these two variables and parental dose, the statistical significance apparently results primarily from a higher frequency of immature infants (with birth weights of <2.5 kg) in the =1.00 Sv dose group than in the 0 Sv dose group.
A qualitative economic assessment of the parental home was made by the Japanese physician on a specified subset of pregnancy terminations at the time of the home visit examination in the years of the clinical program (1948–1954);3 this assessment is available on approximately 6.0% (4,348) of the total of 72,228 individuals. The proportion of children with socioeconomic scores of “very poor” or “poor” in the =0.01 Sv dose categories is 12.7% (133/1,045), slightly higher than the 10.9% (359/3,303) noted in the 0 Sv dose group, but not significantly so. In 1964, a questionnaire was sent to the parents of about 10% of the living children in the original F1 mortality sample to obtain socioeconomic information. Based on this survey, Kato et al.9 noted that “In general, these differences in distribution of extraneous socioeconomic variables,…lead to an inflation of mortality rates in the children of the heavily exposed group.…”
Table 3. Sex ratio by year of birth for the subset of children one or both of whose parents were exposed within 2 km from the hypocenter. Parental gonadal dose equivalents are based on DS86. The neutron component of the radiation has been assigned an RBE of 20.
|
Father only exposed (Sv) |
Mother only exposed (Sv) |
||||||||||
|
Year of birth |
0.01–0.09 |
0.10–0.49 |
0.50–0.99 |
1.00–2.49 |
=2.50 |
0.01–0.09 |
0.10–0.49 |
0.50–0.99 |
1.00–2.49 |
=2.50 |
|
|
Original F1a |
|||||||||||
|
1946–47 |
Male/total |
62/125 |
61/125 |
27/53 |
20/39 |
2/4 |
183/356 |
203/386 |
61/120 |
35/65 |
4/7 |
|
% of Males |
49.6 |
48.8 |
50.9 |
51.3 |
50.0 |
51.4 |
52.6 |
50.8 |
53.8 |
57.1 |
|
|
P=0.4942+0.0068 dc (0.0444) |
P=0.5181+0.0068 d (0.0346) |
||||||||||
|
1948–53 |
Male/total |
180/363 |
280/545 |
143/264 |
109/225 |
41/69 |
621/1152 |
850/1726 |
340/680 |
187/363 |
33/67 |
|
% of Males |
49.0 |
51.4 |
54.2 |
48.4 |
59.4 |
53.9 |
49.2 |
50.0 |
51.5 |
49.3 |
|
|
P=0.5047+0.0138 d (0.0142) |
P=0.5134–0.0096 d (0.0136) |
||||||||||
|
1954–58 |
Male/total |
176/344 |
226/425 |
102/213 |
67/162 |
34/63 |
313/629 |
443/844 |
183/358 |
117/220 |
24/48 |
|
% of Males |
51.4 |
53.2 |
47.9 |
41.4 |
54.0 |
49.8 |
52.5 |
51.1 |
53.2 |
50.0 |
|
|
P=0.5032–0.0032 d (0.0157) |
P=0.5139+0.0013 d (0.0159) |
||||||||||
|
F1 extensionb |
|||||||||||
|
1959–69 |
Male/Total |
343/657 |
764/1517 |
265/506 |
172/320 |
54/117 |
451/883 |
916/1780 |
270/517 |
164/310 |
36/58 |
|
% of Males |
52.2 |
50.4 |
52.4 |
53.8 |
46.2 |
51.1 |
51.5 |
52.2 |
52.9 |
62.1 |
|
|
P=0.5171–0.0082 d (0.0104) |
P=0.5141+0.0085 d (0.0142) |
||||||||||
|
1970–84 |
Male/Total |
157/323 |
306/604 |
96/171 |
39/94 |
13/32 |
199/394 |
350/726 |
100/198 |
55/103 |
16/27 |
|
% of Males |
48.6 |
50.7 |
56.1 |
41.5 |
40.6 |
50.5 |
48.2 |
50.5 |
53.4 |
59.3 |
|
|
P=0.5078–0.0198 d (0.0197) |
P=0.4941+0.0075 d (0.0193) |
||||||||||
|
Total |
Male/Total |
918/1812 |
1637/3216 |
633/1207 |
407/840 |
144/285 |
1767/3414 |
2762/5462 |
954/1873 |
558/1061 |
113/207 |
|
% of Males |
50.7 |
50.9 |
52.4 |
48.5 |
50.5 |
51.8 |
50.6 |
50.9 |
52.6 |
54.6 |
|
|
P=0.5096–0.0029 d (0.0068) |
P=0.5116+0.0011 d (0.0075) |
||||||||||
|
a Either parent exposed to A-bombing within 2 km from the hypocenter. b A linear model, P=ß0+ß1d, was applied in which the unit is the individual child, P is the probability of a male child being born alive, and d is a conjoint parental dose. The estimations were calculated by the maximum likelihood method for binary observations. Values within parentheses are standard errors for ß1. c Either parent exposed to =0.10 Gy of T65D total dose (kerma). |
|||||||||||
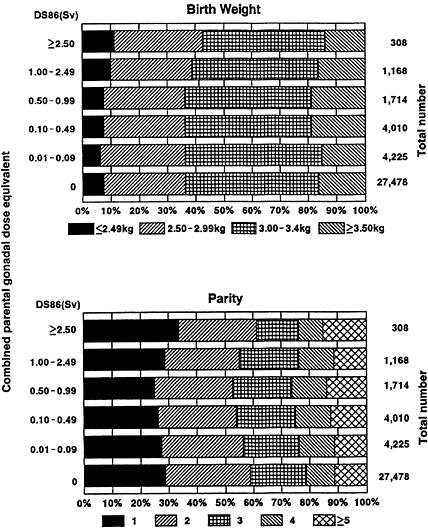
Figure 1. Distribution of birth weight and parity for the subset of children both of whose parents have been assigned DS86 doses (38,903 individuals born during 1948–58). The neutron component of the radiation has been assigned a relative biological effectiveness of 20. For the homogeneity test of birth weight among parental gonadal dose groups, X2=27.07, df=15, p=.03. For the homogeneity test of parity among parental gonadal dose groups, X2=66.56, df=20, p<.01.
Method of analysis
As previously stated,10 deaths during the years 1946–85 of children in the cohort were ascertained by searching the family koseki in which the child's life status is recorded, and the cause of death is based on the death certificate information maintained in the health centers throughout Japan. Confirmation of the fact of death is more than 99% complete.
Using the actuarial life table method, we have calculated survival rates for all causes or all diseases at each year of age in four groups of birth years, namely, 1946–50, 1951–58, 1959–69, and 1970–84. Mantel-Haenszel statistics,19 comparing mortality in the =0.01 Sv group with that in the 0 Sv dose group based on 2× 2 tables for each year of age, were employed. For convenience, survival rates at ages 1,5,10,20, and 30 years are shown in Table 4. Except where specifically stated to the contrary, deaths from accidents or suicides are excluded from the analyses.
To provide a basis for the comparison of mortality in these cohorts of children with that among children in Japan generally, we have calculated the expected number of deaths at the attained ages (0, 1–4, 5–9, 10–19, 20–29, 30–39 years) based on the national vital statistics20 for the same year.
Mortality rates (all ages and age <20 years) for all diseases except neoplasms and cancer by six parental dose categories were based on the person-years and were indirectly standardized to adjust for city, sex, year of birth, and attained age using the total sample as a standard.
Excess relative risk per sievert of combined parental gonadal dose was evaluated using an additive relative risk model in the Poisson regression analysis.21 Deaths and person-years observed in the period 1946–85 were stratified by s strata of city (Hiroshima or Nagasaki), sex (male or female), year of birth (1946–50, 1951–58, 1959–69, 1970–84), k strata of combined parental dose (0, 0.01–0.09, 0.10–0.49, 0.50–0.99, 1.00–2.49, =2.5 Sv), and t strata of attained age (0, 1–4, 5–9, 10–19, 20–29, 30–39 years). Under the Poisson model, it is postulated that Yt,s,k, the number of deaths from the causes of interest, follows the Poisson distribution with mean E(Yt,s,k), where:
E(Yt,s,k)=Rt,s,kgt,s (1+ßDt,s,k).
Here Rt,s,k is the person-year, gt,s is the background mortality rate per person-year, and Dt,s,k is the mean combined parental dose (in sieverts) of the dose group k for the stratum s at attained age t. The parameter ß is the excess relative risk per sievert of combined parental gonadal dose, i.e., the relative risk in the dose group k is 1+ßDt,s,k, as contrasted with that for the 0 Sv dose group. To examine the influence of city, sex, and year of birth, the background mortality rate, gt,s, can be parameterized as follows:
Table 4. Survival rate [S(t)] at age t (1, 5, 10, 20, or 30 years), due to all causes of death or all diseases (May 1946–December 1985) by combined parental dose and year of birth for the subset of children both of whose parents have been assigned DS86 doses. The neutron component of the radiation has been assigned an RBE of 20.
|
0 Sv |
=0.01 Sv |
Test statisticsa |
||||||||
|
Year of birth |
S(t) |
No. of births |
All deaths |
All diseases |
No. of births |
All deaths |
All diseases |
All deaths |
All diseases |
|
|
1946–1950 |
15,099 |
1458 |
1113 |
6541 |
585 |
470 |
||||
|
S(1) |
0.9546(0.0017) |
0.9629(0.0015) |
0.9577(0.0025) |
0.9652(0.0023) |
MH X2 |
2.61 |
0.24 |
|||
|
S(5) |
0.9266(0.0021) |
0.9385(0.0020) |
0.9320(0.0031) |
0.9411(0.0029) |
(df=1, p=.106) |
(df=1, p>.5) |
||||
|
S(10) |
0.9220(0.0022) |
0.9354(0.0020) |
0.9263(0.0032) |
0.9371(0.0030) |
RR |
0.93[0.85–1.03] |
0.99[0.88–1.101 |
|||
|
S(20) |
0.9174(0.0022) |
0.9328(0.0020) |
0.9222(0.0033) |
0.9346(0.0031) |
Homo X2 |
26.01 |
24.90 |
|||
|
S(30) |
0.9089(0.0023) |
0.9288(0.0021) |
0.9156(0.0034) |
0.9309(0.0031) |
(df=38, p>.5) |
(df=38, p>.5) |
||||
|
1951–1958 |
18,262 |
993 |
708 |
7428 |
404 |
289 |
||||
|
S(1) |
0.9705(0.0013) |
0.9765(0.0011) |
0.9690(0.0020) |
0.9765(0.0018) |
MH X2 |
<0.01 |
<0.01 |
|||
|
S(5) |
0.9596(0.0015) |
0.9681(0.0013) |
0.9585(0.0023) |
0.9685(0.0020) |
(df=1, p>.5) |
(df=1, p>.5) |
||||
|
S(10) |
0.9565(0.0015) |
0.9663(0.0013) |
0.9550(0.0024) |
0.9659(0.0021) |
RR |
1.01[0.90–1.15] |
1.02[0.89–1.18] |
|||
|
S(20) |
0.9521(0.0016) |
0.9641(0.0014) |
0.9510(0.0025) |
0.9633(0.0022) |
Homo X2 |
17.42 |
18.86 |
|||
|
S(30) |
0.9466(0.0017) |
0.9618(0.0014) |
0.9464(0.0026) |
0.9613(0.0022) |
(df=34, p>.5) |
(df=34, p>.5) |
||||
|
0 Sv |
=0.01 Sv |
Test statisticsa |
|||||||||
|
Year of birth |
S(t) |
No. of births |
All deaths |
All diseases |
No. of births |
All deaths |
All diseases |
All deaths |
All diseases |
||
|
1959–1969 |
5469 |
121 |
96 |
9239 |
209 |
164 |
|||||
|
S(1) |
0.9857(0.0016) |
0.9866(0.0016) |
0.9861(0.0012) |
0.9871(0.0012) |
MH X2 |
0.03 |
<0.01 |
||||
|
S(5) |
0.9812(0.0018) |
0.9837(0.0017) |
0.9826(0.0014) |
0.9842(0.0013) |
(df=1, p>.5) |
(df=1, p>.5) |
|||||
|
S(10) |
0.9799(0.0019) |
0.9832(0.0017) |
0.9814(0.0014) |
0.9835(0.0013) |
RR |
0.98[0.78–1.12] |
0.96[0.75–1.25] |
||||
|
S(20) |
0.9785(0.0020) |
0.9824(0.0018) |
0.9785(0.0015) |
0.9828(0.0014) |
Homo X2 |
19.81 |
13.39 |
||||
|
S(30) |
— |
— |
— |
— |
(df=25, p>.5) |
(df=25, p>.5) |
|||||
|
1970–1984 |
1862 |
27 |
24 |
3686 |
55 |
45 |
|||||
|
S(1) |
0.9893(0.0024) |
0.9903(0.0023) |
0.9894(0.0017) |
0.9897(0.0017) |
MH X2 |
<0.01 |
<0.01 |
||||
|
S(5) |
0.9876(0.0026) |
0.9893(0.0024) |
0.9870(0.0019) |
0.9889(0.0017) |
(df=25, p>.5) |
(df=25, p>.5) |
|||||
|
S(10) |
0.9860(0.0027) |
0.9876(0.0026) |
0.9853(0.0020) |
0.9880(0.0018) |
RR |
0.94[0.60–1.47] |
0.87[0.54–1.41] |
||||
|
S(20) |
— |
— |
— |
— |
Homo X2 |
2.99 |
3.81 |
||||
|
S(30) |
— |
— |
— |
— |
(df=10, p>.5) |
(df=7, p>.5) |
|||||
|
NOTE: MH X2=Mantel-Haenszel X2 statistics. RR=Weighted relative risk; the values in brackets are the 95% confidence limits. Homo X2=Homogeneity X2 statistics for relative risk in each year interval of age at death. Values within parentheses in the “All deaths” and “All diseases” columns are standard errors. a Test for relative risk of =0.01 Sv dose group compared with 0 Sv dose group. |
|||||||||||
gt,s=gt exp(ßsZt,s),
where gt is the background rate at attained age t, Zt,s is a covariate vector of variables for city, sex, and the mean number of years between the bombings and birth, and ßs is the corresponding regression vector. Hypothesis tests for H0: ß=0 were based on likelihood ratio statistics. A chi-square statistic, using the Freeman-Tukey residual,22 was employed to test the goodness-of-fit of a model.
Finally, although the present method of analysis using Poisson regression and person-years at risk of death seems more appropriate, particularly as the cohort ages—since earlier analyses of mortality in the F1 cohort have been based on a simple linear regression of the frequency of death on parental dose13—we have undertaken a similar analysis here to provide continuity with the past and insight into the dependence of the results on the method of analysis chosen.
Results
All causes of death and survival rates
In Table 4, we have shown the survival rates at 1, 5, 10, 20, and 30 years of age by different birth years: 1946–50, 1951–58, 1959–69, and 1970–84. The survival rates were calculated for all causes and all diseases. Clearly, mortality has diminished in the more recent birth years. For example, in the 0 Sv dose group, the survival rates for all causes at age 10 years are 0.9220, 0.9565, 0.9799, and 0.9860 for the birth years 1946–50, 1951–58, 1959–69, and 1970–84, respectively. Within the four birth year groups, there is no statistically significant difference in mortality from all causes or all diseases between the 0 Sv and the =0.01 Sv dose groups. It should be noted here that in the =0.01 Sv dose group, 27.0% (7,255 individuals in the birth years 1966–84) had not as yet reached 20 years of age prior to 1985.
In the =0.01 Sv dose group from 1946–85, 1,253 deaths were observed in the subset of children both of whose parents have been assigned DS86 doses (Table 5). Among these deaths, 4.3% (40 cancers and 14 unspecified neoplasms) were attributed to neoplasms, 72.9% (914 deaths) to all diseases except neoplasms, 14.3% (179 deaths) to accidents or suicide, and the remainder, 8.5% (106 deaths), to unknown causes. Among 2,599 deaths in the 0 Sv dose group, these proportions were about the same (3.4% or 75 cancers and 14 unspecified neoplasms, 71.3% or 1,852 deaths from all diseases except neoplasms, 15.6% or 405 deaths from accidents or suicide, and 9.7% or 253 deaths from unknown causes). Since there is a difference in the structure of the denominators between the original F1 sample and the F1-Ext sample, the proportional mortality in the =0.01 Sv dose group should be compared with that in the 0 Sv dose group within the two samples. The chi-square statistics for tests of the equivalence of the proportional mortality in the two samples are 4.56 (df=3, p=.21) for the F1 original sample and 1.62 (df=3, p =.66) for the F1-Ext sample.
Table 5. Number of deaths (May 1946–December 1985) by causes and parental gonadal dose equivalent categories for the subset of children both of whose parents have been assigned DS86 doses. The neutron component of the radiation has been assigned an RBE of 20.
|
Original F1 births, 1946–58 |
F1 extension births, 1959–84 |
Total births, 1946–84 |
||||||||
|
Combined parental dose (Sv) |
Combined parental dose (Sv) |
Combined parental dose (Sv) |
||||||||
|
Cause of death |
0 |
>0.01 |
Total |
0 |
>0.01 |
Total |
0 |
>0.01 |
Total |
|
|
No. at risk |
33,361 |
13,969 |
47,330 |
7331 |
12,925 |
20,256 |
40,692 |
26,894 |
67,586 |
|
|
Neoplasms |
||||||||||
|
Leukemia |
25 |
12 |
37 |
2 |
5 |
7 |
27 |
17 |
44 |
|
|
Other cancers |
47 |
18 |
65 |
1 |
5 |
6 |
48 |
23 |
71 |
|
|
Subtotal |
72 |
30 |
102 |
3 |
10 |
13 |
75 |
40 |
115 |
|
|
U.N. neoplasmsa |
11 |
10 |
21 |
3 |
4 |
7 |
14 |
14 |
28 |
|
|
All diseases except neoplasmsb |
||||||||||
|
Infectious |
319 |
120 |
439 |
6 |
14 |
20 |
325 |
134 |
459 |
|
|
Respiratory |
316 |
132 |
448 |
30 |
37 |
67 |
346 |
169 |
515 |
|
|
Digestive |
235 |
114 |
349 |
0 |
10 |
10 |
235 |
124 |
359 |
|
|
Newborn |
398 |
149 |
547 |
53 |
85 |
138 |
451 |
234 |
685 |
|
|
Others |
369 |
161 |
530 |
23 |
48 |
71 |
392 |
209 |
601 |
|
|
Ill-defined |
101 |
43 |
144 |
2 |
1 |
3 |
103 |
44 |
147 |
|
|
Subtotal |
1738 |
719 |
2457 |
114 |
195 |
309 |
1852 |
914 |
2766 |
|
|
Injury and poisoning |
||||||||||
|
Accidents |
279 |
102 |
381 |
26 |
47 |
73 |
305 |
149 |
454 |
|
|
Suicide |
98 |
24 |
122 |
2 |
6 |
8 |
100 |
30 |
130 |
|
|
Subtotal |
377 |
126 |
503 |
28 |
53 |
81 |
405 |
179 |
584 |
|
|
Unknown |
253 (223)c |
104 (98) |
357 (321) |
0 (0) |
2 (1) |
2 (1) |
253 (223) |
106 (99) |
359 (322) |
|
|
All deaths |
2451 |
989 |
3440 |
148 |
264 |
412 |
2599 |
1253 |
3852 |
|
|
a U.N. neoplasms=benign and unspecified tumors. b All diseases except neoplasms are infectious=9th ICD 001–139, respiratory=9th ICD 460–519, digestive=9th ICD 520–579, newborn=9th ICD 760–779, or others=other diseases except ill-defined diseases. c The values within parentheses are the number of deaths occurring at ages of less than 1 year among those deaths due to unknown causes. |
||||||||||
As shown in Table 5, most of the 359 deaths (89.7%, or 322 deaths) from unknown causes occurred before one year of age. Among the 106 deaths from unknown causes in the =0.01 Sv dose group, 70.8% (75 deaths) were identified in the course of the early clinical study as neonatal deaths occurring within the first 14 days after birth. Of 253 deaths from unknown causes in the 0 Sv dose group, 66.8% (149 deaths) were neonatal deaths occurring at <14 days after birth. The difference observed between these two groups is not statistically significant (Yates's corrected chisquare is 0.37 [df=1], p=.54).
The observed numbers of all deaths and fatal cancers, by age at death, among the children of the A-bomb survivors and the expected numbers based on the national vital statistics for the same years are shown in Table 6. Of all of the 3,852 deaths observed in 1946–85, 76.2% occurred at ages between 0 and 4 years, and thus the data presented here largely overlap with those presented in reports issued prior to the advent of the revised (DS86) dose schedule.8–10 The ratios of the numbers of observed to expected deaths are about 0.7 for all deaths and 0.8 for fatal cancers. The mortality observed among the children of A-bomb survivors is never higher than that expected on the basis of the Japanese population as a whole in the same years.
Excess relative risk for mortality
Table 7 shows the mortality rates observed in the subset of children whose parents have been assigned DS86 doses for all diseases except neoplasms, and for cancer. The average number of person-years from 1946 to 1985 in the =0.01 Sv dose group is 25.5. In this dose group, 95.1% (869 deaths) of the 914 deaths from all diseases except neoplasms and 47.5% (19 deaths) of the 40 deaths from cancer occurred before the age of 20. The relative risk of death from all diseases except neoplasms is close to or less than unity in all of the dose groups except the =2.5 Sv dose group. The relative risk of death from cancer in the =0.01 Sv dose group varies around unity. The relative risk of 1.51 for all diseases except neoplasms at age <20 years in the =2.5 Sv dose group is barely statistically significant (p =.046). However, as noted in the description of study population characteristics, this group of 308 infants (Figure 1) is characterized by higher maternal parity and lower birth weight, and the statistical significance of this higher mortality disappears when birth weight and parity, in addition to combined parental dose, are included in the risk model (the data are not shown but see Table 8). Furthermore, mortality in the =2.50 Sv dose group is never higher than that expected on the basis of national vital statistics for the same year (the expected number of deaths from all diseases except neoplasms is 31.6 whereas the observed number is 29 in the =2.5 Sv dose group). Based on an additive relative risk model in the Poisson regression analysis, the excess relative risks per sievert of combined parental gonadal dose for all diseases except neoplasms and for cancer are shown in Table 9. The excess relative risk for mortality from all diseases except neoplasms is positive but not significant (0.030 ± 0.046 per sievert, assuming a neutron RBE of 20 and using the subsample
Table 6. Comparison of the observed number of all deaths (Ad) and cancer deaths (Ca) for the subset of children both of whose parents have been assigned DS86 dose equivalents with the expected number based on all Japan. The relative risk (RR) was calculated from the ratio of O/E for doses =0.01 Sv to the O/E for the 0 Sv dose group, the O/E's being derived from a comparison with Japanese national statistics.
|
Age at death |
|||||||||||||||
|
0 |
1–4 |
5–9 |
10–19 |
20–29 |
30–39 |
Total |
|||||||||
|
DS86 parental dose group (Sv) |
Ad |
Ca |
Ad |
Ca |
Ad |
Ca |
Ad |
Ca |
Ad |
Ca |
Ad |
Ca |
Ad |
Ca |
|
|
Total |
Obs. |
2011 |
2 |
923 |
16 |
215 |
13 |
240 |
18 |
320 |
36 |
143 |
30 |
3852 |
115 |
|
Exp. |
3162.3 |
3.3 |
1100.3 |
16.7 |
257.6 |
13.8 |
304.2 |
30.5 |
360.4 |
41.5 |
147.9 |
36.3 |
5328.3 |
142.2 |
|
|
O/E |
0.64 |
0.61 |
0.84 |
0.96 |
0.83 |
0.94 |
0.79 |
0.59 |
0.89 |
0.87 |
0.97 |
0.83 |
0.72 |
0.81 |
|
|
0 |
Obs. |
1333 |
0 |
639 |
12 |
135 |
8 |
158 |
10 |
231 |
21 |
103 |
24 |
2599 |
75 |
|
Exp. |
2017.8 |
1.9 |
739.8 |
9.8 |
167.7 |
8.1 |
197.0 |
19.1 |
247.4 |
28.6 |
103.1 |
25.4 |
3472.8 |
92.9 |
|
|
O/E |
0.66 |
0.00 |
0.86 |
1.22 |
0.81 |
0.99 |
0.80 |
0.52 |
0.93 |
0.73 |
1.00 |
0.94 |
0.75 |
0.81 |
|
|
=0.01 |
Obs. |
678 |
2 |
284 |
4 |
80 |
5 |
82 |
8 |
89 |
15 |
40 |
6 |
1253 |
40 |
|
Exp. |
1037.3 |
1.4 |
360.5 |
7.0 |
89.9 |
5.7 |
107.2 |
11.4 |
112.9 |
12.9 |
44.8 |
11.0 |
1752.6 |
49.4 |
|
|
O/E |
0.65 |
1.43 |
0.79 |
0.57 |
0.89 |
0.88 |
0.77 |
0.70 |
0.79 |
1.16 |
0.89 |
0.55 |
0.71 |
0.81 |
|
|
RR |
1.00 |
— |
0.91 |
0.47Sug. |
1.10 |
0.89 |
0.95 |
1.34 |
0.84 |
1.58 |
0.89 |
0.58 |
0.96 |
1.00 |
|
|
NOTE: Obs.=the observed number of deaths; Exp.=the expected number of deaths based on all Japan. Sug.=.05<p<.10, test for H0: RR=1. |
|||||||||||||||
Table 7. Mortality rate from cancer and all diseases except neoplasms by combined parental dose equivalent categories for the subset of children both of whose parents have been assigned DS86 doses. The neutron component of the radiation has been assigned an RBE of 20.
|
Combined parental gonadal dose categories (Sv) |
|||||||||
|
Item |
0 |
0.01–0.09 |
0.10–0.49 |
0.50–0.99 |
1.00–2.49 |
=2.50 |
=0.01 |
Total |
|
|
Mean dose No. at risk PYa |
0 |
0.037 |
0.238 |
0.708 |
1.491 |
3.814 |
0.405 |
0.161 |
|
|
40692 |
10648 |
9863 |
3494 |
2295 |
594 |
26894 |
67586 |
||
|
All ages |
1199866 |
265811 |
250227 |
92850 |
62177 |
15251 |
686317 |
1886182 |
|
|
[29.5]b |
[25.0] |
[25.4] |
[26.6] |
[27.1] |
[25.7] |
[25.5] |
[27.9] |
||
|
Age<20 |
756717 |
190444 |
177643 |
63807 |
42234 |
10705 |
484833 |
1241550 |
|
|
[18.6] |
[17.9] |
[18.0] |
[18.3] |
[18.4] |
[18.0] |
[18.0] |
[18.4] |
||
|
Deaths from all diseases except neoplasms |
|||||||||
|
All ages |
Obs. |
1852 |
349 |
335 |
120 |
81 |
29 |
914 |
2766 |
|
Exp. |
1840.2 |
351.1 |
335.8 |
130.4 |
88.4 |
20.1 |
925.8 |
2766.0 |
|
|
Age<20 |
Obs. |
1740 |
332 |
318 |
114 |
76 |
29 |
869 |
2609 |
|
Exp. |
1731.4 |
332.7 |
318.4 |
123.7 |
83.8 |
19.1 |
877.6 |
2609.6 |
|
|
Adjusted ratec and relative risk |
|||||||||
|
All ages |
Rate |
147.6 |
145.8 |
146.3 |
135.0 |
134.4 |
211.1 |
144.8 |
146.7 |
|
RR |
1.00 |
0.99 |
0.99 |
0.91 |
0.92 |
1.43 |
0.98 |
||
|
Age<20 |
Rate |
211.2 |
209.7 |
209.9 |
193.7 |
190.7 |
318.7 |
208.1 |
210.1 |
|
RR |
1.00 |
0.99 |
0.99 |
0.92 |
0.90 |
1.51* |
0.99 |
||
|
Combined parental gonadal dose categories (Sv) |
|||||||||
|
Item |
0 |
0.01– 0.09 |
0.10– 0.49 |
0.50– 0.99 |
1.00– 2.49 |
=2.50 |
=0.01 |
Total |
|
|
Cancer deaths |
|||||||||
|
All ages |
Obs. |
75(27)d |
17(7) |
14(5) |
5(4) |
4(1) |
0(0) |
40(17) |
115(44) |
|
Exp. |
76.4 |
15.0 |
13.6 |
5.4 |
3.6 |
0.9 |
38.6 |
115.0 |
|
|
Age<20 |
Obs. |
30(17) |
10(6) |
5(3) |
3(3) |
1(1) |
0(0) |
19(13) |
49(30) |
|
Exp. |
30.8 |
7.4 |
6.3 |
2.5 |
1.6 |
0.4 |
18.2 |
49.0 |
|
|
Adjusted rate and relative risk |
|||||||||
|
All ages |
Rate |
6.0 |
6.9 |
6.3 |
5.6 |
6.7 |
0.0 |
6.3 |
6.1 |
|
RR |
1.00 |
1.15 |
1.05 |
0.94 |
1.12 |
0.00 |
1.06 |
||
|
Age<20 |
Rate |
3.8 |
5.3 |
3.1 |
4.8 |
2.4 |
0.0 |
4.1 |
3.9 |
|
RR |
1.00 |
1.39 |
0.82 |
1.26 |
0.64 |
0.00 |
1.07 |
||
|
NOTE: Obs.=the observed number of deaths; Exp.=the expected number of deaths based on the internal comparison with the assumption that there is no parental dose effect on mortality. a Person-years. b The values within brackets are averages of the person-years. c The adjusted rate is calculated by the indirect method, using the total mortality rate as a standard per 100,000 person-years. d The values within parentheses are the numbers of leukemia cases. * p=.046 for the test of H0: RR=1.0 compared with the 0 Sv dose group. |
|||||||||
Table 8. Comparison of results of a Poisson regression analysis for mortality (1948–85) from all diseases except neoplasms which includes birth weight and parity in the model with the results of a model which excludes these two factors. The analysis is based on 1,872 deaths among the 38,903 individuals live born between 1948–68 for whom birth weight and parity are available, DS86 doses only.
|
Multiplicative factors in background rate |
Birth weight (kg) |
|||||||
|
Type of analysis |
Birth year (years since bombing) |
Hiroshima |
Male |
Parity |
Linear term |
Quadratic term |
ERR (Sv) for conjoint parental dose equivalent |
Deviance |
|
Background parameters only |
–0.091* (0.008) |
–0.210* (0.049) |
0.128* (0.047) |
2778.94 [df=4439] |
||||
|
Background parameters and dose effect |
–0.091* (0.008) |
–0.210* (0.049) |
0.127* (0.047) |
0.048 (0.058) |
2778.13 [df=4438] |
|||
|
Background parameters, parity, birthweight, and dose effect |
–0.086* (0.009) |
–0.190* (0.049) |
0.197* (0.048) |
0.064* (0.015) |
–0.843* (0.054) |
0.009 (0.050) |
2499.34 [df=4436] |
|
|
As above, plus quadratic component |
–0.088* (0.009) |
–0.201* (0.049) |
0.230* (0.048) |
0.082* (0.019) |
–2.035* (0.152) |
2.679* (0.254) |
–0.010 (0.064) |
2241.66 [df=4435] |
|
NOTE: ERR is excess relative risk per sievert. A model for mortality, ?A.exp(?'0 Z0) (1+ßd+?'Z1), is used. ?A=Mortality at attained age; Z0 is a covariate vector for birthyear, city, and sex; Z1 is a covariate vector of parity and birthweight; ?0, ?1 are vectors of parameters corresponding to Z0 and Z1, respectively; d is conjoint dose; and ß is excess relative risk per sievert. Estimates are calculated after subtraction of the sample mean from birthyear, parity, and birthweight. The sample means are 6.8 years and 2.6 and 3.06 kg, respectively. Values within parentheses are standard errors. *p<.01. |
||||||||
Table 9. Results of a Poisson regression analysis of the mortality (1946–85) from all diseases except neoplasms using stratification for attained age, birth years, city, and sex. The neutron component of the radiation has been assigned an RBE of 20.
|
DS86 doses only (67,586 children) |
|||||
|
Cause of death |
No. of deaths |
ERR (Sv) for combined parental gonadal dose |
Test p value |
||
|
All diseases except neoplasms |
|||||
|
All ages |
2,766 |
0.030 |
(0.046) |
.485 |
|
|
Age<20 |
2,609 |
0.038 |
(0.048) |
.379 |
|
|
Infectious, 9th ICD 001–139 |
|||||
|
All ages |
459 |
–0.066 |
(0.100) |
.470 |
|
|
Age<20 |
451 |
–0.062 |
(0.102) |
.504 |
|
|
Respiratory, 9th ICD 460–519 |
|||||
|
All ages |
515 |
0.153 |
(0.121) |
.119 |
|
|
Age<20 |
502 |
0.166 |
(0.124) |
.098 |
|
|
Digestive, 9th ICD 520–579 |
|||||
|
All ages |
359 |
0.152 |
(0.152) |
.294 |
|
|
Age<20 |
344 |
0.167 |
(0.158) |
.266 |
|
|
Newborn, 9th ICD 760–779 |
|||||
|
All ages |
685 |
0.030 |
(0.090) |
.711 |
|
|
Age<20 |
685 |
0.030 |
(0.090) |
.711 |
|
|
Others except ill-defined diseases |
|||||
|
All ages |
601 |
–0.019 |
(0.092) |
.841 |
|
|
Age<20 |
491 |
0.006 |
(0.105) |
.956 |
|
|
All cancer |
|||||
|
All ages |
115 |
–0.195 |
[~0.271] |
.432 |
|
|
Age<20 |
49 |
–0.233 |
[~0.328] |
.341 |
|
|
All cancer except leukemia |
|||||
|
All ages |
71 |
–0.220 |
[~0.340] |
.441 |
|
|
Age<20 |
19 |
–0.224 |
[~0.310] |
.281 |
|
|
Leukemia |
|||||
|
All ages |
44 |
–0.117 |
[~0.934] |
.801 |
|
|
Age<20 |
30 |
0.021 |
[~1.516] |
.945 |
|
|
NOTE: The test p-value is calculated by likelihood ratio statistics for H0: ERR=0, where ERR is excess relative risk per sievert. The values within parentheses are standard errors; the values within brackets are 95% upper bounds. |
|||||
with assigned DS86 doses). However, the excess relative risk for cancer tends to be negative. The 95% upper bound of the excess relative risk for cancer is shown in Table 9 instead of the standard error, since the distribution of the parameter estimates is skewed. There is no significant increase in the relative risk of mortality from all diseases except neoplasms or from cancer as combined parental gonadal dose increases. Parenthetically, fitting the simple linear model to which we have previously alluded to these data yields an intercept of 0.0420 (±0.0015) and a linear regression coefficient of 0.00169 (±0.00157) per sievert. These values imply a slightly higher excess relative risk, specifically 0.040, than resulted from the previous analysis, but the two values are really in very good agreement.
Excess relative risk was also evaluated for four major disease categories (based on the International Classification of Diseases [9th ICD] rubrics23): infectious and parasitic diseases (9th ICD 001–139), diseases of the respiratory system (9th ICD 460–519), diseases of the digestive system (9th ICD 520–579), and certain conditions originating in the perinatal period (9th ICD 760–779). There is no significant increase in the relative risk of mortality in any of these four categories as combined parental gonadal dose increases. At face value, the estimate of the excess relative risk varies slightly depending upon the cut point for attained ages, but no significant increase was observed with any of the alternative cut points.
In Table 10, the estimated parameters for birth year (years between bombing and birth), city, and sex are shown, to demonstrate the influence of these factors on the background mortality rate. The latter rate, for all diseases except neoplasms, in children born in Hiroshima is lower than that in Nagasaki; the Hiroshima value is about 0.86 times (exp[–0.15]) that in Nagasaki. The background mortality for all diseases except neoplasms for male children is slightly higher than that for female children by about 1.1 times (exp[0.091), and the background mortality rate for all diseases in children born in 1946 is higher than that in children born in 1955 by about 2.2 times (exp[–0.088×–9]). However, only the difference between the sexes in the background mortality rate from cancer at ages of <20 years is statistically significant.
The findings in Table 10 allow us to compare the results of a Poisson regression analysis assuming the RBE of neutrons to be 20 with an analysis assuming an RBE of 1. At face value, the excess relative risk for all diseases except neoplasms in the former instance is slightly higher than that in the latter. Yet it is clear that the choice of any RBE between 1 and 20 will have little effect on the estimated excess relative risk itself.
Table 10. Comparison of estimated excess relative risk (ERR) per sievert and coefficients for birth year, city, and sex on the Poisson regression analysis assuming an RBE of 20 with those assuming an RBE of 1 (67,586 children, DS86 dose only).
|
Multiplicative factors in background ratea |
||||||
|
RBE |
Cause of death |
Age at death |
Birth year (years since bombings) |
Hiroshima |
Male |
ERR (Sv) for combined parental gonadal dose equivalents |
|
RBE=1 |
All diseases except neoplasms |
All ages |
–0.088** (0.004) |
–0.148** (0.040) |
0.090* (0.038) |
0.026 (0.053) |
|
Age<20 |
–0.088** (0.004) |
–0.164** (0.041) |
0.077* (0.039) |
0.039 (0.055) |
||
|
All cancer |
All ages |
–0.011 (0.019) |
–0.103 (0.196) |
0.263 (0.189) |
–0.164 [~0.366] |
|
|
Age<20 |
–0.001 (0.020) |
–0.184 (0.293) |
0.619* (0.302) |
–0.242 [~0.437] |
||
|
RBE=20 |
All diseases except neoplasms |
All ages |
–0.088** (0.004) |
–0.146** (0.039) |
0.091* (0.038) |
0.036 (0.047) |
|
Age<20 |
–0.088** (0.004) |
–0.167** (0.041) |
0.075 (0.039) |
0.044 (0.048) |
||
|
All cancer |
All ages |
–0.010 (0.019) |
–0.102 (0.196) |
0.262 (0.189) |
–0.206 [~0.250] |
|
|
Age<20 |
–0.002 (0.020) |
–0.168 (0.294) |
0.634* (0.302) |
–0.224 [~0.284] |
||
|
a A model for mortality, ?A·exp(?' Z)(1+ßd), is used, where: ?A=mortality at attained age; Z is a covariate vector for birth year, city, and sex; d is conjoint dose; ? is a vector parameter corresponding to Z; and ß is excess relative risk per sievert. Estimates are calculated after subtraction of the sample mean from the birth year (years since the bombings). The sample mean=10.5 years. The values within parentheses are standard errors; the values within brackets are the 95% upper bounds. *.01<p<.05; **p<.01. |
||||||
As earlier stated, 91.9% (4,265) of the 4,642 children one or both of whose parents have been assigned an ad hoc dose among the full sample of 72,228 children are believed to have been exposed to =0.01 Sv of conjoint parental gonadal dose. In Table 11 we compare the results of a Poisson regression analysis for the subset of children assigned only DS86 doses with the results (DS86 plus ad hoc doses) for the full sample. The excess relative risk for all diseases except neoplasms in the full sample is a little higher, and the standard error a bit smaller, than in the subset of children whose parents have assigned DS86 doses, but these differences are not significant.
Table 11. Comparison of results of the Poisson regression analysis using stratifications for attained age, birth year, city, and sex of the mortality (1946–85) of all diseases except neoplasms in the children assigned only DS86 doses with those for the full sample. The neutron component of the radiation has been assigned an RBE of 20.
Discussion
Continued surveillance of mortality among the liveborn children of A-bomb survivors has not revealed a significant increase in the relative risk of mortality from all diseases except neoplasms, nor from neoplasms, following parental exposure to A-bomb radiation. Although a significantly increased mortality cannot be shown, this does not permit one to assume that deleterious, indeed lethal, mutations did not occur. Accordingly, we accept the data at their face value, and on the assumption that the genetic effect due to A-bomb radiation increases linearly with dose, estimate the excess relative risk of death from all causes except neoplasms to be 0.030 (±0.046) per sievert, based on the DS86 gonadal doses using a neutron RBE of 20 (Table 9 or 11).
Survival rates (due to deaths from all causes or all diseases at age 1, 5, 10, 20, and 30 years for the different birth year cohorts have been computed to provide a simple but appropriate way to observe mortality at a glance (Table 4). As these rates show, mortality in the earlier years of life has declined markedly with time in this sample. This is in keeping with a Japan-wide trend: For males, mortality from all causes at an age of <1 year decreased between 1947 and 1955 from 8.8% to 4.3%; for females during the same period the decrease was from 7.7% to 3.7%.
The proportions of deaths due to neoplasms (cancer as well as unspecified neoplasms), all diseases except neoplasms, accidents or suicide, and deaths from unknown causes among all deaths do not differ significantly between the 0 Sv and the =0.01 Sv dose groups. Most of the 359 deaths from unknown causes (68%, or 244 deaths) exhibited in Table 5 involved neonatal deaths in the first 2 weeks after birth identified by the early clinical study.3,4 We note that the present analysis of cancer differs from that reported elsewhere11 in that it includes only cancer deaths, not incident cases, and that death could have occurred at any age during the surveillance period, not only before the age of 20.
Generally, the number of deaths observed among the children of the A-bomb survivors is never higher than the expected number based on the Japanese national vital statistics for the same years (Table 6). The ratio of observed to expected deaths is about 0.7 for all deaths and 0.8 for fatal cancer. A variety of explanations can be advanced for this discrepancy from an expected ratio of 1. Arguably the most important of these centers on the appropriateness of the national statistics as the basis for determining the expectations. These statistics are derived from all of Japan including rural areas, which generally have different death rates than those seen in urban areas, and the pooling of information obscures the regional variability in mortality common to all countries.
The small increase in mortality observed in the children of survivors, even if it were statistically significant, could not be assigned unequivocally to parental exposure to A-bomb radiation, since it is difficult, if not impossible, to account adequately for the risk due to environmental factors. Specifically, socioeconomic factors during the first 20 years of life could have affected survivorship among these children, since it is not unreasonable to assume that the aftermath of the bombings worsened the socioeconomic status of many of the survivors. To assess the role of factors other than parental exposure, we have examined the influence of birth weight and parity on mortality (see Table 8). These two factors may be related to socioeconomic status or the age of A-bomb survivors, and an infant's birth weight could be a more important factor in early mortality than parental gonadal dose. This possibility was borne out by the analysis of Table 8: The apparent radiation effect disappeared when parity of mother and infants'birth weights were included in the analysis.
Ideally an assessment of the relationship between A-bomb exposure and cancer occurrence should be based on tumor registry data involving histological verification and medical information. This would minimize the number of nonfatal cancers lost to follow-up. In the first RERF study of cancer in the F1, 36 leukemia incidence cases (all ages) were identified during 1946–79 by Ishimaru et al.16 No significant excess risk for leukemia among the children of exposed parents was observed. In subsequent reports we have described the risk of all cancer (1946–82) including leukemia in the first two decades of life, based on cancer incidence and the use of tumor registry data, and no statistically significant increase in cancer risk was observed as parental gonadal dose increased.11 In a cancer incidence study it is impossible to systematically identify cancers occurring in people who have left the tumor registry reporting areas. Outmigration does not, however, influence the mortality study since the fact of death can be determined wherever in Japan an individual may have resided prior to death, but the death certificate is a less reliable means of identifying the occurrence of cancer than the tumor registries. At present, as shown in Tables 7, 9, and 10, there is no clear evidence of an increase in fatal cancer (either before the age of 20 or for all ages) with parental dose among the children of A-bomb survivors.
Generally, postspermatogonial cells (spermatocytes and spermatids) are more sensitive to radiation exposure than spermatogonia.2 From the beginning of puberty, proliferation of spermatogonia continues throughout the lifetime of the human male, and the full cycle of spermatogenesis is normally about 64 days.24 Gardner and his coworkers15 suggest that the increased risk of leukemia observed in the Sellafield study is primarily due to radiation-related mutations in postspermatogonial cells. The RERF data pertinent to this issue are limited; the number of leukemia cases and of children born from May 1946 to December 1946 is small (i.e., children presumed to have been conceived during the 6 months after the bombing amount to about 2% of the total sample). The RERF studies are more pertinent, therefore, to the possible genetic effects due to radiation-induced mutations in the spermatogonia or oocytes of the A-bomb survivors. Since, however, mutations induced in spermatogonia may accumulate and be copied many-fold in descendant sperm cells—in fact, the bulk of the radiation experienced in the Sellafield study was to spermatogonia—it would require sensitivities of postspermatogonial cells far in excess of those established experimentally to bridge the gap between the present observations and the Sellafield findings (see also Little25).
Radiation is not selective in its spectrum of germinal mutational damage. The components of the spectrum of mutation types from spontaneous germinal mutation may show differing frequencies and each component may have a different radiosensitivity. Because we have failed to show a significant genetic effect among the children of the A-bomb survivors, we cannot present further speculation at this point. However, one would expect in Sellafield an increase in other mutational diseases that could scarcely have gone unnoticed if the excess risk of leukemia was due to radiation-induced germinal mutations.
As mentioned in the Introduction, a variety of other genetic studies have been performed on the children of A-bomb survivors, and recently all these data, combined with the data of the present study, have been used to generate an estimate of the genetic doubling dose of radiation for humans, on the basis of the DS86 dose schedule.26 To prevent confusion, we note that the regression term for F1 mortality employed in that doubling dose-ultimate is somewhat smaller than that developed in the present paper. This results from the fact that to avoid overlap between a previous study on stillbirths, congenital defects, and neonatal deaths4 and the present study of all deaths among liveborn children, neonatal deaths scored in the course of the previous study have been subtracted from the present data sets and a new regression term derived for the purpose of obtaining a regression to be used in a doubling dose estimate.
References
1. United Nations Scientific Committee on the Effects of Atomic Radiation : Sources,Effects and Risks of Ionizing Radiation. New York, United Nations, 1988.
2. National Academy of Sciences-National Research Council: The Effects on Populationsof Exposure to Low Levels of Ionizing Radiation. Washington, D.C., National Academy Press, 1990.
3. Neel JV, Schull WJ: The Effect of Exposure to the Atomic Bombs on Pregnancy Termination in Hiroshima and Nagasaki. Washington, D.C., National Academy of Sciences-National Research Council, Pub. No. 461, 1956.
4. Otake M, Schull WJ, Neel JV: Congenital malformations, stillbirths and early mortality among the children of atomic bomb survivors: A reanalysis. Radiat Res 122:1–11, 1990.
5. Satoh C, Neel JV: Biochemical mutations in the children of atomic bomb survivors. Gann Monogr Cancer Res35:191–208, 1988.
6. Neel JV, Satoh C, Goriki K, Asakawa J, Fujita M, Takahashi N, Kageoka T: Search for mutations altering protein charge and/or function in children of atomic bomb survivors: Final report. Am J Hum Genet 42:663–76, 1988.
7. Awa AA, Honda T, Neriishi S, Sofuni T, Shimba H, Ohtaki K, Nakano M, Kodama Y,Itoh M, Hamilton HB: Cytogenetic study of the offspring of atomic bomb survivors, Hiroshima and Nagasaki. In Cytogenetics. Ed. by G.Obe and A.Basler. Berlin, Springer-Verlag, 1987. pp. 166–83.
8. Kato H, Schull WJ: Joint JNIH–ABCC life-span study of children born to atomic bomb survivors, research plan. ABCC TR 4–60
9. Kato H, Schull WJ, Neel JV: A cohort-type study of survival in the children of parents exposed to atomic bombings. Am J Hum Genet 1:339–73, 1966.
10. Neel JV, Kato H, Schull WJ: Mortality in the children of atomic bomb survivors and controls. Genetics 76:311–26, 1974.
11. Yoshimoto Y, Neel JV, Schull WJ, Kato H, Soda M, Eto R, Mabuchi K: The frequency of malignant tumors during the first two decades of life in the offspring of atomic bomb survivors. Am J Hum Genet 46:1041–52, 1990.
12. Schull WJ, Neel JV: Radiation and the sex ratio in man. Science 128:343–8, 1958.
13. Schull WJ, Neel JV, Hashizume A: Some further observations on the sex ratio among infants born to survivors of the atomic bombings of Hiroshima and Nagasaki. Am J Hum Genet 18:328–38, 1966.
14. Schull WJ, Otake M, Neel JV: Genetic effects of the atomic bombs: A reappraisal. Science 213:1220–7, 1981.
15. Gardner MJ, Snee MP, Hall AJ, Powell CA, Downes S, Terrell JD: Results of case-control study of leukaemia and lymphoma among young people near Sellafield nuclear plant in West Cumbria. Br Med J 300:423–9, 1990.
16. Ishimaru T, Ichimaru M, Mikami M: Leukemia incidence among individuals exposed in utero, children of atomic bomb survivors, and their controls. Hiroshima and Nagasaki, 1945–79. RERF TR 11–81, 1981.
17. Roesch WC (ed.): US-Japan Joint Reassessment of Atomic Bomb Radiation Dosimetryin Hiroshima and Nagasaki. Hiroshima, Radiation Effects Research Foundation, 1987
18. International Commission on Radiation Units and Measurements: The Quality Factorin Radiation Protection (Report 40). Bethesda, Md., ICRUM, 1986.
19. Kleinbaum DG, Kupper LL, Morgenstern H: Epidemiologic Research: Principles andQuantitative Methods. Belmont, Calif., Lifetime Learning Publications, 1982.
20. Ministry of Health and Welfare: Vital Statistics Japan, 1947 (part II) and 1951–1985 (vol. I). Tokyo, Division of Health and Welfare Statistics, Welfare Minister's Secretariat .
21. Preston DL, Kato H, Kopecky KJ, Fujita S: Studies of the mortality of A-bomb survivors. 8. Cancer mortality, 1950–82. Radiat Res 111:151–78, 1987.
22. Frome EL: The analysis of rates using Poisson regression models. Biometrics 39:665–74, 1983.
23. World Health Organization: International Classification of Diseases (1975 revision, vol. 1). Geneva, WHO, 1977.
24. McKusick VA: Human Genetics. Englewood Cliffs, N.J., Prentice-Hall, 1964.
25. Little, MP: A comparison between the risks of childhood leukemia from parental exposure to radiation in the Sellafield work force and those displayed among the Japanese bomb survivors. J Radiol Prot 10:185–98, 1990.
26. Neel JV, Schull WJ, Awa AA, Satoh C, Kato H, Otake M, Yoshimoto Y: The children of parents exposed to atomic bombs: Estimates of the genetic doubling dose of radiation for humans. Am J Hum Genet 46:1053–72, 1990


