
In 1896 Svante Arrhenius wrote that human influence on the climate system might become noticeable over the course of the next millennium (Box 2.1). In less than 120 years, human activities—mostly fossil fuel burning and deforestation—resulted in the release of nearly two trillion tons of carbon dioxide (IPCC, 2013a), significantly increasing concentrations in the atmosphere (Figure 1.3) and generating urgent concern about climate change. Today, scientists, engineers, and policy makers are working together to discover, validate, and implement strategies to reduce CO2 emissions as well as other greenhouse gases. As such, efforts to reduce anthropogenic CO2 emissions to the atmosphere are likely to be a primary component within the portfolio of solutions to reduce climate change impacts (Figure 1.4). In addition, further mitigation options involving the removal of CO2 from the atmosphere may provide cost-effective means to stabilize atmospheric CO2 at concentrations that would limit adverse effects of global warming (IPCC, 2014a).
In the sections that follow, the committee discusses various potential methods for removing CO2 from the atmosphere, together with estimates about possible rates of removal and total amounts that might be removed via these methods. To put these rates and totals in context, Table 2.1 summarizes human emissions of CO2 and the associated increase of CO2 in the atmosphere and CO2 sinks since 1750 and in a recent 10-year period. Over the past decade, human activities have produce approximately 34 GtCO2/yr annually with about 16 GtCO2/yr, or about 2 ppm/yr, accumulating in the atmosphere (more recent estimates of annual emissions sources are ~39 GtCO2/yr: 36 GtCO2 from fossil fuel combustion and cement production and ~3 GtCO2 from land use changes [Global Carbon Project, 2014]). Note that less than half of current and historical anthropogenic CO2 emissions remain in the atmosphere; the remainder (18 GtCO2/yr) has been taken up by the ocean and the terrestrial biosphere. This existing uptake and removal of CO2 from air, natural “carbon dioxide removal” (CDR), already moderates the impacts of human emissions on atmospheric CO2 levels and global climate. Indeed this uptake is seasonally so great that atmospheric CO2 concentrations intra-annually decline (Figure 1.3). Nevertheless, substantially increasing existing CDR by natural or unnatural means such that the average annual growth rate of atmospheric CO2 is reduced or reversed poses a significant challenge. One reason is that if enough CO2 were removed from the atmosphere to cause a decline in overall atmospheric concentrations, CO2 would “outgas” from the ocean into the atmosphere
BOX 2.1 HISTORICAL CONTEXT FOR CARBON DIOXIDE REMOVAL
Ever since the earliest realizations that atmospheric CO2 influenced Earth’s heat budget, there has been speculation that humankind could control carbon in order to control climate. Carbon dioxide removal has historical roots in the work of Swedish scientists Svante Arrhenius (1859-1927) and Nils Ekholm (1848-1923). In 1896, Arrhenius published a paper that examined the effect of different levels of atmospheric CO2 concentration on the temperature of the planet. Using his energy budget model, he estimated that a 50 percent increase in CO2 would raise global temperatures by about 3°C to 3.5°C, while a reduction of CO2 by one-third would lower temperatures by roughly the same amount. His was in essence a geological model, used to examine the onset of ice ages and interglacials, in which he considered volcanoes and not coal burning to be the “chief source of carbonic acid for the atmosphere.” However, since he estimated that burning the world’s annual production of coal—at that point in time approximately 500 million tons—produced about one-thousandth of the total atmospheric concentration of carbon dioxide, he realized that humans could have a major influence over the course of a millennium (Arrhenius, 1896; Fleming, 1998).
In 1901, Ekholm suggested that human activity might someday play a major role in controlling Earth’s temperature. He pointed out that over the course of a millennium the accumulation in the atmosphere of carbon dioxide from the burning of pit coal would “undoubtedly cause a very obvious rise of the mean temperature of the Earth.” Ekholm suggested the grand possibility that by such means it might someday be possible “efficaciously to regulate the future climate of the Earth and consequently prevent the arrival of a new Ice Age.” In this scenario, climate warming by enhanced coal burning would be pitted against the natural changes in Earth’s orbital elements or the secular cooling of the sun (Ekholm, 1901; Fleming, 2000).
A half-century later, at a time when many scientists were beginning to express concern about the enhanced greenhouse effect, Caltech geochemist and futurist Harrison Brown imagined feeding a hungry world by increasing the carbon dioxide concentration of the atmosphere to stimulate plant and biomass growth: “We have seen that plants grow more rapidly in an atmosphere that is rich in carbon dioxide. … If, in some manner, the carbon-dioxide content of the atmosphere could be increased threefold, world food production might be doubled” (Brown, 1954).
Within the past decade, Columbia University scientist Wallace Broecker and science writer Robert Kunzig end their book, Fixing Climate (Broecker and Kunzig, 2008), with a vision of future climate stabilized by CDR and carbon dioxide enhancement:
“Our children and grandchildren, having stabilized the CO2 level at 500 or 600 ppm, may decide, consulting their history books, that it was more agreeable at 280 ppm. No doubt our more distant descendants will choose if they can to avert the next ice age; perhaps, seeing an abrupt climate
change on the horizon, they will prevent it by adjusting the carbon dioxide level in the greenhouse. By then they will no longer be burning fossil fuels, so they would have to deploy some kind of carbon dioxide generator … to operate in tandem with the carbon dioxide scrubbers.”
Over the course of recent history, as knowledge of the role carbon dioxide plays in climate change has been developing, so too there have been many grand ideas about how to alter the carbon cycle (Fleming, 2010). Discussions of carbon dioxide removal in this volume are not intended to advocate any techniques for controlling the carbon cycle; rather, CDR approaches are discussed with the intent of considering options for mitigating the concentrations of CO2 in the atmosphere that have been elevated by humans.
Proposals for CDR techniques have been put forth within the past century. Small-scale carbon dioxide removal in medical gases (anesthetics) and in closed spaces such as submarines and spacecraft has a long history, but it was in the 1930s that deforestation was understood to be one of the contributing factors to carbon dioxide buildup in the atmosphere, with reforestation implied as a valuable corrective (Callendar, 1938). Beginning in the late 1950s, direct atmospheric measurements demonstrated the natural uptake of CO2 by the biosphere during the spring and summer in the Northern Hemisphere and the emission of CO2 during the fall and winter (Keeling, 1960); over time, these measurements indicated that uptake by the biosphere was growing (Le Quéré et al., 2013). In the mid-1970s, Freeman Dyson suggested planting trees to remove CO2 from the atmosphere (Dyson, 1977). This concept was later developed further by Gregg Marland (Dyson and Marland, 1979; Marland, 1988). Concerns about carbon dioxide and climate in the 1970s resulted in renewed research efforts seeking to scale up removal, reuse, and sequestration techniques to the global level. In 1976, Cesar Marchetti published a research memorandum that proposed scrubbing CO2 from smoke stacks and injecting the stream into the Mediterranean outflow water (Marchetti, 1977). The CO2 would then hopefully be carried into the deep Atlantic. An Oak Ridge National Laboratory report published in 1980 describes a variety of options for collecting and disposing of CO2 (Baes et al., 1980). Another group led by Meyer Steinberg envisioned removing CO2 from the air using a mobile nuclear reactor. In a short history of CO2 greenhouse gas mitigation, Steinberg (1992) claims “[t]he earliest work on CO2 mitigation was started in the U.S. by the Office of Energy Research of the U.S. Department of Energy in the 1970s.” The First International Conference on Carbon Dioxide Removal, held in March 1992 in Amsterdam, represented the first major gathering of researchers in the field of CO2 capture, disposal, and utilization (Blok et al., 1992). Also in 1992, a paper was published that suggested using plants as fuel in a bioenergy system (Marland and Marland, 1992).
TABLE 2.1 Sources and Sinks Within Earth’s Carbon Cycle
| Cumulative 1750-2011 (GtCO2) | Average Rate 2002-2011 (GtCO2/yr) | ||
| Sources | Fossil fuel combustion and cement production | 1,380 ± 110 | 30.4 ± 2.6 |
| Deforestation and other land use change | 660 ± 290 | 3.3 ± 2.9 | |
| Total | 2,040 ± 310 | 33.7 ± 2.9 | |
| Sinks | Atmosphere | 880 ± 40 | 15.8 ± 0.7 |
| Ocean | 570 ± 110 | 8.8 ± 2.6 | |
| Terrestrial biosphere | 590 ± 330 | 9.2 ± 4.8 | |
| Total | 2040 ± 310 | 33.7 ± 2.9 | |
| Change in atmospheric concentration | 112 ± 5 ppm | 2.0 ± 0.1 ppm/yr | |
SOURCE: IPCC, 2013a.
and the terrestrial land sink would be less effective.1 Over a period of several decades, this would replace up to half of the CO2 that had been removed by CDR (IPCC, 2013a). Reducing CO2 concentration by 1 ppm/yr would require removing and sequestering CO2 at a rate of about 18 GtCO2/yr; reducing CO2 concentrations by 100 ppm would require removing and sequestering a total of about 1,800 GtCO2, or roughly the same amount of CO2 as was added to the atmosphere from 1750 to 2000.
An additional challenge is the continued appetite of modern society for energy fueled by carbon-based sources. Efforts by developed nations to cut their emissions through conservation and increased reliance on renewable energy sources have been more than offset by growth in energy demand by developing nations, which has largely been met by fossil fuels (IPCC, 2014b). Although these supplies are fundamentally a finite resource, the fossil fuel industries have expanded exploration and improved extraction methods to allow for the production of resources previously not technically recoverable. This technical advancement has led to “reserve growth”: despite the rapid consumption of oil and natural gas, the technically recoverable reserves still in the ground during periods of technical innovation can actually increase (EIA, 2014). This phenomenon is responsible for the continued identification of large supplies of fossil fuels more than 50 years after experts predicted supplies should have peaked and been on the decline (Hubbert, 1969). Thus, dwindling supplies of fossil fuels are unlikely to be a contributor to reductions in CO2 emissions. Energy demand, coupled with continued availability of relatively cheap fossil fuels, will only increase the need
_______________
1 Net primary productivity would decrease with decreasing atmospheric CO2 concentrations.
for carbon dioxide removal if atmospheric concentrations of CO2 are going to be stabilized. The Intergovernmental Panel on Climate Change (IPCC, 2014b; Chap. 7, Table 7.2) estimates fossil fuel resources (the amount that might ultimately be recoverable using foreseeable technologies) to be in the range of 8,543 to 13,649 GtC, which would be between ~30,000 and 50,000 GtCO2—more than 1,000 times the current annual emission rate for fossil fuel CO2.
As noted above, CDR is defined in this report as the removal and long-term sequestration of CO2 from the atmosphere in order to reduce global warming. There are several CDR approaches that seek to amplify the rates of processes that are already occurring as part of the natural carbon cycle, and these approaches are highlighted in Figure 2.1 along with the various processes and reservoirs that compose Earth’s carbon cycle. Gross CO2 emissions from land and the ocean are more than 20 times larger than anthropogenic emissions (Figure 2.1). Actions that enhance the reduction of these natural emissions or that increase the natural CO2 removal from air have the potential to lower atmospheric CO2. These strategies are variously employed in land management practices, such as low-till agriculture, reforestation (the restoration of forest on recently deforested land), and afforestation (the restoration of forest on land that has been deforested for 50 years or more); ocean iron fertilization; and land- and ocean-based accelerated weathering. These techniques are described further in Chapter 3.
In contrast to the approaches described above that seek to remove and store carbon from the atmosphere by amplifying natural processes, there are approaches that involve capturing CO2 from the atmosphere, concentrating it, and disposing of it by pumping it underground at high pressure. One CDR approach involves the extraction of energy from biomass2 through oxidation or gasification (i.e., “bioenergy”) combined with the capture and sequestration of the CO2 generated during oxidation and gasification; this is referred to as bioenergy with carbon capture and sequestration (BECCS).3 Chemical separation methods that directly capture CO2 from ambient air combined with long-term CO2 disposal is referred to as direct air capture and sequestration (DACS). Traditional carbon capture and sequestration (CCS) involves the chemical separation and removal of CO2 from power plant stack gas. Figure 2.2 com-
_______________
2 Note that the growth of biomass involves the extraction of CO2 from the atmosphere.
3 If large-scale use of fossil fuels continues, BECCS would have no advantage over using biofuels without carbon capture and sequestration (CCS) and capturing and sequestering the same amount of CO2 from fossil fuels; the net amount of CO2 emitted into the atmosphere would be the same. In this case, the choice of whether to add CCS to a generating plant fueled with biomass or fossil fuels should be based on economic grounds—whichever is cheaper. BECCS can, however, play a uniquely “carbon-negative” role if the amount of CO2 that is sequestered from biomass exceeds the amount of CO2 produced by the use of fossil fuels. See further discussion in Chapter 3.
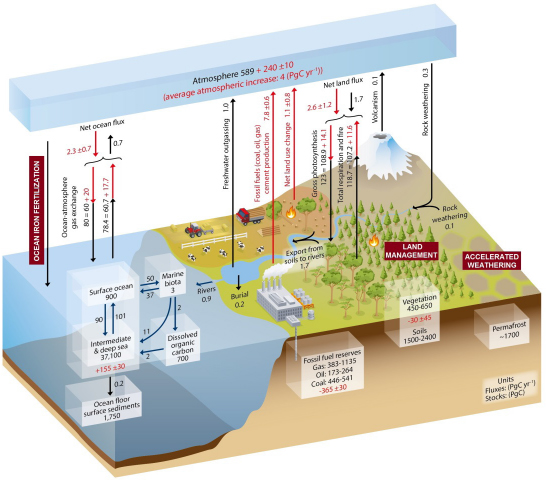
FIGURE 2.1 Simplified schematic of the global carbon cycle. Numbers represent reservoir mass, also called “carbon stocks” in PgC (1 PgC = 1015 gC = 3.67 GtCO2) and annual carbon exchange fluxes (in PgC yr−1). Black numbers and arrows indicate reservoir mass and exchange fluxes estimated for the time prior to the Industrial Era, about 1750. Fossil fuel reserves are from GEA (2006) and are consistent with numbers used by IPCC Working Group III for future scenarios. Red arrows and numbers indicate annual anthropogenic fluxes averaged over the 2000-2009 time period. These fluxes are a perturbation of the carbon cycle during Industrial Era post-1750. Red numbers in the reservoirs denote cumulative changes of anthropogenic carbon over the Industrial Period (1750-2011). By convention, a positive cumulative change means that a reservoir has gained carbon since 1750. Uncertainties are reported as 90 percent confidence intervals. Emission estimates and land and ocean sinks (in red) are from Table 6.1 in Section 6.3 in IPCC (2013a). For more details see IPCC (2013a).
pares BECCS, DACS, and power plant CCS approaches. These approaches are discussed individually in more detail in Chapter 3. Carbon capture and sequestration from power plants prevents CO2 emissions but does not remove CO2 from the atmosphere; hence, it is not considered a carbon dioxide removal approach and is not discussed in this chapter on CDR approaches.
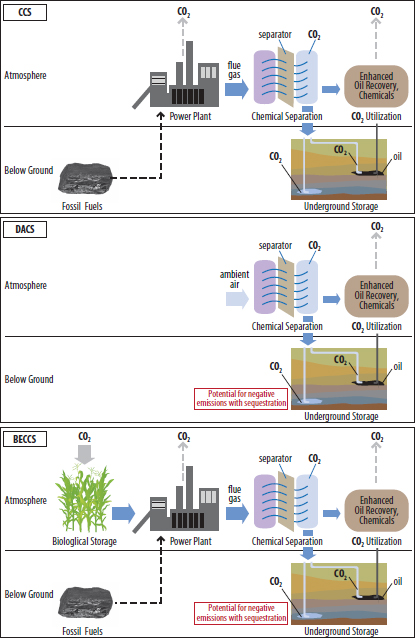
FIGURE 2.2 Comparison of components involved in several systems for carbon dioxide removal. The top panel shows the components involved in carbon capture and sequestration (CCS), the middle panel shows the components involved in direct air capture and sequestration (DACS), and the bottom panel shows the components involved in bioenergy with carbon capture and sequestration (BECCS). Block arrows show fluxes of carbon (as fuel or as CO2); dashed arrows indicate residual CO2 emissions. BECCS and DACS are carbon-negative approaches if some or all of the captured CO2 goes into geological sequestration, whereas CCS is at best a carbon-neutral process. The utilization of CO2 for enhanced oil recovery and other uses is discussed in Chapter 3, as are capture and sequestration methods that incorporate CO2 into solid or liquid materials.
Assessing the potential benefit offered by different CDR methods involves estimating feasible rates of atmospheric CO2 removal in addition to a given method’s total CO2 reduction capacity over timescales of interest (i.e., up to 2100). A more thorough assessment that could inform prioritization of future research and development efforts would in addition assess risks, costs, and efficacy, as well as the potential for research and development to reduce barriers to widespread deployment. Table 2.2 shows a preliminary comparison of the potential impacts, costs, and limitations associated with each of the CDR methods of focus in this report. The preliminary judgments shown in Table 2.2 could be affected by new information that could be produced, for example, by additional research. A comparison to current and projected emissions places these estimates in context. Note that these CDR approaches are discussed in greater detail in Chapter 3.
TABLE 2.2 Summary of the Potential Impacts of Various CDR Strategies
| CDR Method | Rate of Capture or Sequestration [GtCO2/yr] | Cumulative CDR to 2100 [GtCO2] | Cost [$/tCO2] | Limitations | |
|
Land management Afforestation/Reforestation |
2-5a | 100b | 1-100c |
|
|
| Combined Capture and Sequestration |
Accelerated weathering Land |
2 (U.S. only) | ~100 (U.S. only) | 20-1,000e |
|
|
Ocean |
1d | ~ 100 | 50-100f | ||
| Ocean iron fertilization | 1-4g | 90-300 | 500h |
|
|
| Capture | Bioenergy with capture | 15-18i (Theoretical) | 100-1,000j | ~100k |
|
| Direct air capture | 10m (U.S. only) | ~1,000 (U.S. only) | 400-1,000n |
|
|
| CDR Method | Rate of Capture or Sequestration [GtCO2/yr] | Cumulative CDR to 2100 [GtCO2] | Cost [$/tCO2] | Limitations | |
| Sequestration | Geologic | 1-20p (2DS) | 800p (2DS) | 10-20q |
|
| Ocean (molecular CO2) | ? | 2,000-10,000r | 10-20r |
|
|
| Ocean (CO2 neutralized with added alkalinity) | ?s | ?s | 10-100r |
|
|
NOTE: Amounts of CO2 included in table are estimates of the theoretical or potentially feasible amounts, with the exception of those noted as the amounts required to keep global warming to less than 2°C (2DS). These estimates are provided mostly to only one significant figure to indicate possible scales of deployment and costs as estimated in published literature. Real-world values could differ substantially from these estimates.
a Smith and Torn, 2013; Lenton, 2010. b Nilsson and Schopfhauser, 1995; Lenton, 2010. c Richards and Stokes, 2004; Stavins and Richards, 2005; IPCC, 2014b. d Kirchofer et al., 2012; McLaren, 2012; Rau et al., 2013. e Assuming ~4.65 GJ/tCO2 for the case of mineral carbonation via olivine at 155°C and electric energy source from coal (Kirchofer et al., 2012); ocean-land requirement of < 7 × 10⁵ km2/GtCO2 captured per year, assuming wind as energy resource.f IPCC, 2014a; McLaren, 2012; Rau et al., 2013. gAumont and Bopp, 2006. h Harrison, 2013. i Kriegler et al., 2013; Azar et al., 2010. j Lenton, 2010; Lenton and Vaughan, 2009; Kriegler et al., 2013. k Assuming similar costs to carbon capture at a conventional coal-fired power plant (Rubin and Zhai, 2012). l Alexandratos and Bruinsma, 2012. m If fueled from solar, assuming an estimate of ~11 acres per MW electricity used for powering direct air capture (DAC), and based on the range of energy requirement estimates in the literature, ~31,000 acres required to remove emissions associated with one 500-MW power plant (i.e., 11,000 tCO2/day); note that the single DAC plant to offset emissions of the 500-MW power plant is only 33 acres. n Mazzotti et al., 2013; House et al., 2011. o Bureau of Land Mangement, 2012. p Assuming increasing rate of sequestration: 1 GtCO2/yr in 2025, 7.5 GtCO2/yr in 2050, and 19 GtCO2/yr in 2100, which is based on required projections to limit total global warming to 2°C (IEA, 2013b) and gives a total amount sequestered of 800 GtCO2. q NETL, 2013; ITFCCS, 2010. r Maximum capacity in equilibrium with atmospheres ranging from 350 to 1,000 ppm (IPCC, 2005). s No specific upper bounds appear in the literature, but maximum rates of deployment this century are likely to be limited by economic and/or local environmental concerns and not any fundamental physical barriers.


