
4—
The Education of Human Factors Specialists
An objective of this study was to describe the scope of educational experiences of human factors specialists, the quality of that education, and the nature of formal educational programs for human factors specialists. This chapter is organized around these objectives.
SCOPE AND QUALITY OF EDUCATION
Where Do We Learn What We Do?
Respondents were asked, for each of 52 activities or tasks, whether they performed the activity as part of their current job and if so where they learned about it (formal education, continuing education, company training, personal study, on-the-job experience, other). Relatively few respondents indicated continuing education, company training, personal study, or other as where they learned about the various activities or tasks. The percentage of respondents indicating continuing education ranged from 2 to 13 across the 52 items; all but 5 items were under 10 percent. For company training, the range was from 1 to 15 percent with only 7 items at or above 10 percent. For personal study, the range was 2 to 19 percent with 22 above 10 percent. The ''other'' category never accounted for more than 1 percent of respondents on any item. Table 4.1 presents the 52 activities and tasks in order by percentage of respondents who perform them as part of their current job. The percentages of respondents learning from formal education or on-the-job experience correlate highly with the percentage performing the activity or task—.88 and .98, respectively. The correlation between formal educa
TABLE 4.1 Source of Knowledge About Performing Human Factors Activities and Tasks (percentage)
|
Activity or Task |
Performs in Current Job |
Received Formal Education in It |
Has On-The-Job Experience |
|
Prepare/conduct oral presentations |
90 |
34 |
63 |
|
Prepare/contribute to written reports |
85 |
42 |
58 |
|
Apply human factors criteria/principles |
85 |
39 |
50 |
|
Analyze tasks |
81 |
34 |
51 |
|
Prepare/contribute to project proposals |
80 |
22 |
57 |
|
Evaluate reports of others |
79 |
29 |
54 |
|
Specify user requirements |
78 |
30 |
53 |
|
Interpret test and evaluation results |
72 |
35 |
43 |
|
Design data collection procedures/questionnaires |
68 |
34 |
41 |
|
Review/summarize prior literature |
67 |
36 |
37 |
|
Interpret research results |
64 |
38 |
36 |
|
Verify conformance to human factors specifications |
63 |
19 |
42 |
|
Specify/perform data analysis |
61 |
38 |
30 |
|
Collect field data |
60 |
24 |
40 |
|
Plan/coordinate evaluations |
57 |
20 |
39 |
|
Specify evaluation objectives |
56 |
19 |
38 |
|
Design human-equipment interfaces |
55 |
22 |
36 |
|
Develop criterion measures |
54 |
22 |
35 |
|
Develop hypotheses/theory |
52 |
31 |
29 |
|
Design workspace layouts |
49 |
21 |
31 |
|
Design evaluations |
48 |
20 |
32 |
|
Design software-user interface |
48 |
16 |
32 |
|
Interpret engineering drawings |
47 |
18 |
31 |
|
Assess mental workload |
47 |
20 |
27 |
|
Prepare instruction/procedure documents |
47 |
13 |
32 |
|
Develop/conduct computer simulations |
46 |
15 |
24 |
|
Assess physical workload |
45 |
18 |
27 |
|
Prepare software specifications |
45 |
13 |
30 |
|
Prepare/review design drawings |
45 |
12 |
31 |
|
Define instructional requirements |
44 |
14 |
29 |
|
Specify training objectives |
43 |
11 |
28 |
|
Assess training effectiveness |
42 |
13 |
28 |
|
Collect laboratory data |
40 |
24 |
23 |
|
Collect error/accident data |
39 |
12 |
27 |
|
Prepare design mockups |
38 |
9 |
26 |
|
Conduct training |
37 |
12 |
25 |
|
Develop analytical models/methods |
36 |
18 |
21 |
|
Design training aids |
36 |
10 |
24 |
|
Develop training content/methods |
35 |
11 |
22 |
|
Write/debug computer programs |
32 |
18 |
16 |
|
Perform safety analyses |
31 |
9 |
21 |
|
Analyze effects of environmental stressors |
30 |
13 |
22 |
|
Assess performance risks |
27 |
7 |
18 |
|
Design simulation systems |
24 |
7 |
15 |
|
Activity or Task |
Performs in Current Job |
Received Formal Education in It |
Has On-The-Job Experience |
|
Conduct network analyses |
24 |
9 |
13 |
|
Perform human reliability analyses |
22 |
7 |
14 |
|
Prepare engineering drawings |
21 |
11 |
13 |
|
Conduct root cause analyses |
20 |
7 |
12 |
|
Prepare product warnings |
18 |
5 |
12 |
|
Perform failure-mode-effect analyses |
14 |
5 |
8 |
|
Develop/analyze fault trees |
13 |
5 |
7 |
|
Support product liability litigation |
11 |
3 |
7 |
|
Mean |
45.4 |
18.1 |
28.8 |
|
Standard deviation |
20.2 |
10.5 |
13.3 |
tion and on-the-job experience is .79. It appears that, in general, formal education tracks well the activities performed on the job. If performance on the job is a criterion of a need for education on an activity, then there are a few items for which the percentage of respondents receiving formal education is lower than would be expected:
Preparing/contributing to written proposals,
Verifying conformation to human factors specifications,
Planning/coordinating evaluations, and
Specifying evaluation objectives.
There are also activities for which the percentage of respondents receiving formal education is a little higher than would be expected given the percentage of respondents actually performing them:
Specify/perform data analysis,
Develop hypotheses/theory,
Collect laboratory data,
Develop analytical models/methods, and
Write/debug computer programs.
The pattern is clear and not surprising to the panel: formal education tends to stress theoretical issues and laboratory research, while in practice evaluation studies are emphasized. This finding is consistent with the traditionally different roles of the university as educator and the employer as trainer.
Quality of the Educational Experience
Several questions on the specialist survey relate to the quality of the education received by human factors specialists. Two questions deal with the issue from the specialist's perspective, that is, how they perceive the quality of their education. Two additional questions deal with the issue from the perspective of an employer, that is, how supervisors perceive the quality of the education of those they hire.
The Human Factors Specialists' Perspective
Survey respondents who received their highest degree after 1984 (i.e., within the law five years). were asked how well their formal education prepared them for their first human factors job. Responses were made on a 7-point scale from 1 (very poorly) to 7 (very well). A value of 4 represents the midpoint of the scale. Figure 4.1 presents the cumulative percentages
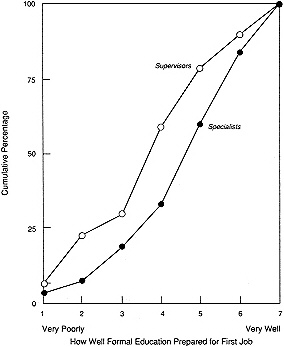
Figure 4.1
Cumulative percentage of specialists (N = 405) and supervisors (N 241) who obtained their highest degree in the last 5 years responding to how well their formal education prepared them for their first human factors job.
for specialists and supervisors to this question. Overall, supervisors felt that formal education prepared the specialists less well than the specialists thought. Two-thirds (66.7 percent) of the specialists gave a response of "5 or above" (i.e., greater than 4) to the question, while less than half (40.9 percent) of the supervisors so responded.
Respondents were also asked to indicate which of 77 topics they received training in during their formal education. If they indicated they received such training and they received their degree since 1984, they were asked, on a 7-point scale (1 = not very well; 7 = very well), how well the topic was covered. Table 4.2 presents, for each of the 77 topics, the percentage of all respondents receiving formal education in that topic and the mean rating of quality given. The correlation between the two columns of the table is .76, indicating that topics that were included in the education of more people also tended to be fated higher in quality than topics not covered as often.
The topics that were rated below 4.0 (the midpoint) are listed below. Less than 22 percent of the respondents reported that these topics were covered in their formal education:
-
Error/accident analysis,
-
Human reliability analysis,
-
Products liability law,
-
Computer input tool design,
-
Human/computer dialogue design,
-
Speech recognition/synthesis,
-
Teleoperators,
-
Aging,
-
Handicapped, and
-
Maintainability.
They divide into four categories. The first (items 1 through 3) deals with topics involved in accident and malfunction analyses. The second (items 4 through 7) deals with computer-based topics that have a relatively short history and have not been developed within academia until recently. The third (items 8 and 9) deals with social issues that are becoming more important but have not been given attention in formal education programs until recently. The last item (maintainability) cannot be easily placed within the other classes; certainly this topic has been important to human factors for many years, yet formal education has apparently not adequately addressed it.
Several topics that were not taught very often (reported by less than 25 percent of the respondents) but when taught were covered at least adequately (assuming a mean rating of 4.0 or greater is adequate):
TABLE 4.2 Quality Ratings of Topic Coverage by Human Factors Specialists and Supervisors
|
Topic |
Percentage Receiving Formal Educationa in the Topic |
How Well Topic Was Covered (1 to 7 Scale) |
|
Transportation systems |
74 |
4.1 |
|
Process control |
73 |
4.6 |
|
Experimental design |
71 |
5.8 |
|
Univariate statistics |
71 |
5.5 |
|
Computer program languages |
69 |
4.6 |
|
Multivariate statistics |
67 |
5.2 |
|
Facilities design |
67 |
4.5 |
|
Perception |
64 |
5.4 |
|
Learning |
64 |
5.2 |
|
Visual processes |
64 |
5.0 |
|
Oral presentation |
64 |
5.0 |
|
Cognitive processes |
63 |
5.1 |
|
Auditory processes |
58 |
4.7 |
|
Survey methods |
55 |
4.6 |
|
Laboratory instrumentation |
54 |
4.8 |
|
Attention |
53 |
4.9 |
|
Analytical models |
53 |
4.8 |
|
Task analysis |
53 |
4.8 |
|
Technical writing |
52 |
5.0 |
|
Time and motion study |
49 |
4.7 |
|
Physical environmental effects |
49 |
4.5 |
|
Physical measurement |
47 |
4.5 |
|
Motor abilities |
46 |
4.5 |
|
Group dynamics |
45 |
4.7 |
|
Subjective measurement |
45 |
4.7 |
|
Group problem solving |
45 |
4.6 |
|
Motivational and reward structures |
43 |
4.7 |
|
Workload analysis |
43 |
4.7 |
|
Computer simulation |
43 |
4.3 |
|
Psychometrics |
42 |
4.7 |
|
Physiological measurement |
40 |
4.6 |
|
Operations research |
39 |
4.8 |
|
Work station design |
36 |
4.6 |
|
System requirements analysis |
36 |
4.6 |
|
Health and safety |
36 |
4.5 |
|
Design guidelines |
36 |
4.4 |
|
Project management |
35 |
4.5 |
|
Team performance |
34 |
4.9 |
|
Design checklists |
33 |
4.5 |
|
Manufacturing and quality control |
32 |
4.7 |
|
Control design |
32 |
4.5 |
|
Cost estimation |
31 |
4.4 |
|
Topic |
Percentage Receiving Formal Educationa in the Topic |
How Well Topic Was Covered (1 to 7 Scale) |
|
Anthropometry |
31 |
4.3 |
|
Human needs analysis |
31 |
4.3 |
|
Function allocation |
30 |
4.5 |
|
Panel display design |
30 |
4.5 |
|
Computer architecture |
29 |
4.4 |
|
Work physiology |
29 |
4.2 |
|
Design walk throughs |
27 |
4.4 |
|
Use of mockups |
26 |
4.5 |
|
Manual control theory |
26 |
4.1 |
|
Artificial intelligence |
26 |
4.1 |
|
Software tools |
25 |
4.3 |
|
Handtool design |
25 |
4.1 |
|
Biomechanics |
25 |
4.0 |
|
Computer display design |
24 |
4.6 |
|
Organizational impact analysis |
23 |
4.3 |
|
Usability evaluation |
22 |
4.4 |
|
Aging |
22 |
3.8 |
|
Communication systems |
21 |
4.2 |
|
Error/accident analysis |
20 |
3.9 |
|
Human reliability analysis |
20 |
3.8 |
|
Speech recognition/synthesis |
20 |
3.7 |
|
Human-computer dialog design |
20 |
3.7 |
|
Instructional systems design |
19 |
4.4 |
|
Handicapped |
18 |
3.8 |
|
Maintainability |
18 |
3.7 |
|
CAD/CAM |
17 |
4.3 |
|
Robotics |
17 |
4.1 |
|
Office automation |
17 |
4.1 |
|
Negotiation |
16 |
4.5 |
|
Aerospace systems |
15 |
4.3 |
|
Products liability law |
15 |
3.9 |
|
Command and control |
13 |
4.3 |
|
Computer input tool design |
13 |
3.9 |
|
Teleoperators |
7 |
3.1 |
|
MANPRINT, etc. |
5 |
4.1 |
|
Mean |
37 |
4.5 |
|
Standard deviation |
17.8 |
0.4 |
|
a Includes only those who received degrees since 1984. |
||
Computer display design,
Usability evaluation,
Communication systems,
Instructional system design.
CAD/CAM,
Office automation,
Robotics,
Negotiation,
Aerospace systems,
Command and control, and
MANPRINT, etc.
The Perspective of Employers of Human Factors Specialists
Supervisors were asked to consider human factors personnel that they hired in the past two years and whether there were any skills or abilities that they lacked when they first came to work. Three-quarters (75 percent) responded that skills and abilities were lacking in new hires; when asked to list some examples, a wide range of responses were recorded. An analysis of these revealed the following deficiencies (mentioned more than 10 times):
Experience on the job and in the field,
Communication skills (written, oral, and interpersonal),
Human factors and psychology knowledge and approach,
Systems analysis (task analysis, function allocation, etc.),
Experimental design and research skills,
Organizational skills,
Engineering and product/technical skills,
Computer science,
Government acquisition/contracting, and
Analytical skills and methods.
Supervisors were also asked if there were any topics in human factors university degree programs that they felt were not being taught or not being taught well enough. About half (54 percent) of the supervisors thought that there were. Analysis of the topics listed revealed essentially the same items as those found for skills and abilities lacking in new hires.
EDUCATION PROGRAMS
A questionnaire form was mailed to each of 59 U.S. education programs listed in the Directory of Human Factors Graduate Programs in the United States and Canada (Human Factors Society, 1988). The following profile is based on the 48 programs that returned questionnaires.
Program Description
Table 4.3 lists the percentage of programs by department of primary affiliation. The majority of the programs are in engineering departments with the remainder of programs divided among psychology and other. Only four programs affiliated with something other than engineering or psychology; therefore, because of the small sample size, when data are presented by primary affiliation, these four programs are not discussed. Programs were asked to indicate any informal or formal links they had with programs outside their department. Across all programs, 33 percent reported some type of link with other departments. Among the engineering programs reporting links to other departments, 82 percent listed psychology first. Of the psychology programs with links, only 54 percent listed engineering first, the remainder listed links with human factors and business/management programs first.
Figure 4.2 presents a distribution of programs by the decade in which they were established. Two things stand out. First is the accelerating growth of new programs in engineering departments compared with the irregular establishment of new programs in psychology departments. Second is the relatively large increase in new psychology programs in the 1980s compared with the number established in prior decades. Thirty-five percent of all of the programs are relatively young, having been started during the 1980s. These trends are encouraging and suggest that the number of programs dealing with human factors may continue to grow during the 1990s.
Graduate Degrees Offered
Among engineering programs, 88 percent offer both master's and doctorate degrees, the remainder offer only master's degrees. Among psychology programs, 47 percent offer both master's and doctorates, 21 percent offer only doctorates, and 32 percent offer only master's degrees.
Table 4.4 summarizes degree requirements for master's and doctorates within engineering and psychology departments. The results should be
TABLE 4.3 Primary Affiliation of Graduate Programs in Human Factors
|
Affiliation |
Number |
Percent |
|
Engineering |
25 |
52 |
|
Psychology |
19 |
40 |
|
Other |
4 |
8 |
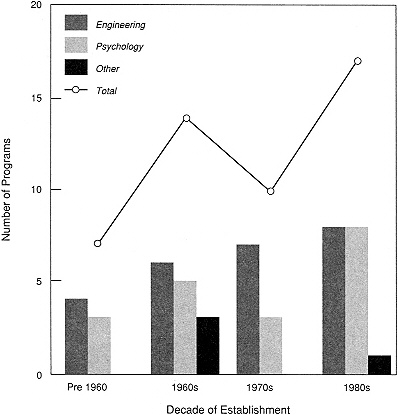
FIGURE 4.2
Distribution of programs by decade established and affiliation.
TABLE 4.4 Degree Requirements of Programs in Human Factors
|
|
Master's |
Doctorate |
||
|
Requirement |
Engineering |
Psychology |
Engineering |
Psychology |
|
Mean number of units requirements |
11.1 |
10.7 |
27.8 |
26.4 |
|
Percentage requiring: |
||||
|
Minor |
21 |
0 |
50 |
31 |
|
Thesis |
57 |
92 |
86 |
100 |
|
Practical experience |
17 |
33 |
27 |
62 |
|
Percentage with optional thesis |
35 |
8 |
14 |
0 |
viewed with caution due to the small number of programs responding to some items (in all cases: less than 25 engineering and less than 15 psychology master's programs; less than 15 engineering and less then 15 psychology doctorate programs). A few clear trends appear. Minors are required by a higher percentage of engineering programs than psychology programs at both the master's and doctorate level. Larger percentages of engineering programs have an optional thesis than is the case with psychology programs, for which a higher percentage require a thesis. Finally, practical experience is required by a higher percentage of psychology programs (at both the master's and doctorate levels) than is the case among engineering programs.
Undergraduate Human Factors
Across all programs, 26 percent reported having an undergraduate human factors program, concentration, or minor. The percentage of engineering (25 percent) and psychology (21 percent) programs with undergraduate offerings was similar. Among the four ''other'' programs, two indicated some form of undergraduate offering.
Faculty
A total of 279 core faculty members were listed as actively involved in the 48 human factors programs. Thus, there is an average of 5 to 6 core faculty per program. The median number per program is 4 to 5. It appears that on average, engineering programs (mean = 5.5 per program; median = 4 per program) have fewer core faculty than do psychology programs (mean = 6.2 per program; median = 6 per program). In fact, 44 percent of the engineering programs have 3 or less core faculty compared with only 5 percent of psychology programs. The program with the largest number of core faculty (22), however, is an engineering program. The largest number of core faculty in a psychology program was 12.
For each core faculty member listed, the survey asked for the number of off-campus professional meetings attended last year at which a paper was given or a session was chaired. Nine programs did not supply information on the faculty listed. Across all programs, the median number of meetings per faculty member was 2. There was no difference between engineering and psychology faculty with respect to involvement in professional meetings.
Across all programs, as well as within both engineering and psychology programs, the median percentage of faculty engaged in outside consulting is 67 percent. This proportion would indicate that in most programs there is ample opportunity for students to be exposed to real-world problems through the firsthand experience of their professors. Across all programs
and within both engineering and psychology programs, the median percentage of faculty with outside grants is 50 percent.
Facilities and Resources
Respondents were asked to rate, on a 7-point scale, the adequacy of their university and department libraries with respect to human factors books and journals, the adequacy (availability, age, quality) of computer hardware for faculty, and the adequacy of computer software for faculty. Figure 4.3 presents the cumulative distributions of these three ratings for all departments. There were no significant differences (p > .05) between engineering and psychology programs on the ratings. Although not significant, the mean rating of adequacy was lowest for libraries and highest for computer hardware.
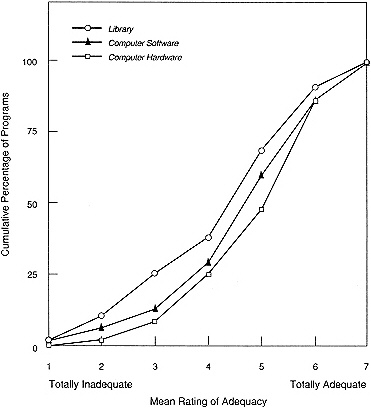
FIGURE 4.3
Ratings of adequacy of program resources.
Respondents were also asked to indicate, in an open-ended question, what needs their human factors program has in the way of additional laboratories, library facilities, or equipment. Only 35 programs responded to the question. Forty percent of those responding listed various types of specialized equipment. Several programs specifically listed equipment in work physiology and biomechanics. Computer equipment was listed by 37 percent of the programs, additional space was listed by 29 percent, and more human factors books and journals was listed by 20 percent.
A little over half the programs (56 percent) indicated that they have received contributions of money or equipment in the past year from outside sources. The percentages did not differ significantly (p > .05) between psychology and engineering programs. When asked whether the support their program has received from the University increased at a rate above average, average, or below average compared with other university programs over the past few years, 31 percent indicated above-average, 49 percent average, and only 20 percent below-average increases. It appears that the support received by human factors programs is increasing at an average or above-average rate. A closer look, however, reveals that more engineering programs are receiving above-average support (37 percent) than is the case for psychology programs (22 percent).
Ties to Industry and Government
In the human factors specialist survey, respondents were asked whether their unit had any ties with universities that teach human factors courses; 44 percent of the respondents indicated such ties with universities. Listed below are the percentages of respondents that indicated specific activities with universities (the percentages add to more than 44 percent because multiple answers were permitted):
|
Percentage |
Activities |
|
30 |
Internships |
|
26 |
Advising |
|
21 |
Research contracts |
|
20 |
Other |
This response represents a very substantial percentage of organizations that maintain contacts with university human factors programs.
University programs were asked whether they had internship programs or used adjunct professors or guest lecturers. Table 4.5 presents the percentage of programs indicating such use of outside organizations. Although nearly half of the programs report some sort of internship program, only 72 students across all programs are currently involved. In like manner, al
TABLE 4.5 Programs with Ties to Industry/Government
|
Tie |
Percentage of Programs |
|
Internships |
48 |
|
Adjunct professorships |
59 |
|
Guest lectures |
57 |
though more than half of the programs report using adjunct professors, across all programs there are only 65 adjunct professors. In the past year, across all programs, there were only 77 guest lectures by business or government employees.
These statistics suggest that university programs are only skimming the surface of potential contacts with business and government. When asked about the advantages of adjunct professors, respondents cited specialized expertise, contact with real-world problems and issues, the cost-effectiveness of hiring adjuncts, and the fact that the use of adjuncts frees up regular faculty for other things. A number of disadvantages were cited: adjuncts are not always available to teach or to interact with students (the most commonly cited disadvantage); it takes a lot of time and energy to maintain contact and schedule adjuncts; adjuncts have less commitment to the program than do regular faculty; and adjuncts are not necessarily good teachers and often lack interest in research.
Advantages of using guest lecturers are similar to those cited for using adjunct professors: diversity, real-world applications, and information on what is happening in industry. About one-third of the programs that use guest lecturers reported no real disadvantages; other programs indicated difficulty in scheduling lecturers and the lack of coordination with the progression of material in the course. Cost was cited by only 12 percent of the programs as a disadvantage.
Curriculum and Student Experiences
Each program was asked to indicate how each of 77 topics were covered in their program: in required courses, elective courses, or not covered at all. Table 4.6 presents the topics and the percentages of programs indicating each category, organized by percentage of programs that cover the topic in required courses. Topics covered in required courses by at least two-thirds of the programs center around research methodology and statistics; sensory, cognitive, and motor abilities and processes; anthropometry and
TABLE 4.6 Topic Coverage in Required or Elective Courses (percentage of programs)
|
Topic |
Required Course |
Elective Course |
Not Covered |
|
Univariate statistics |
83 |
15 |
2 |
|
Experimental design |
83 |
15 |
2 |
|
Visual processes |
81 |
17 |
2 |
|
Auditory processes |
79 |
19 |
2 |
|
Work station design |
79 |
17 |
4 |
|
Cognitive processes |
79 |
15 |
6 |
|
Analytical models |
76 |
15 |
9 |
|
Oral presentation |
75 |
7 |
18 |
|
Anthropometry: |
74 |
17 |
9 |
|
Environmental effects |
72 |
26 |
2 |
|
Work physiology |
70 |
28 |
2 |
|
Motor abilities/limits |
70 |
28 |
2 |
|
Perception |
69 |
27 |
4 |
|
Task analysis |
69 |
22 |
9 |
|
Control design |
67 |
24 |
9 |
|
Attention |
67 |
24 |
9 |
|
Panel display design |
67 |
22 |
11 |
|
Hand tool design |
64 |
19 |
17 |
|
Workload analysis |
63 |
28 |
9 |
|
Computer display design |
60 |
31 |
9 |
|
Function allocation |
60 |
27 |
13 |
|
Design guidelines |
58 |
24 |
18 |
|
Multivariate statistics |
57 |
37 |
6 |
|
Computer program languages |
57 |
30 |
13 |
|
Psychophysics/subjective measures |
56 |
42 |
2 |
|
Health and safety |
54 |
30 |
16 |
|
Biomechanics |
53 |
36 |
11 |
|
Learning |
49 |
40 |
11 |
|
System requirements analysis |
48 |
43 |
9 |
|
Design checklists |
48 |
26 |
26 |
|
Human needs analysis |
46 |
36 |
18 |
|
Facilities design |
46 |
35 |
19 |
|
Computer input tool design |
46 |
29 |
25 |
|
Psychological measurement |
45 |
41 |
14 |
|
Lab instrumentation |
44 |
30 |
26 |
|
Human-computer dialog design |
42 |
42 |
16 |
|
Human reliability analysis |
42 |
36 |
22 |
|
Physical measurement |
42 |
33 |
24 |
|
Technical writing/illustration |
41 |
33 |
26 |
|
Time and motion study |
40 |
36 |
23 |
|
Topic |
Required Course |
Elective Course |
Not Covered |
|
Error-failure-accident analysis |
39 |
44 |
17 |
|
Manual control theory |
36 |
40 |
24 |
|
Usability evaluation |
34 |
23 |
43 |
|
Software tools |
33 |
47 |
20 |
|
Design walk throughs |
33 |
27 |
40 |
|
Psychometrics |
32 |
41 |
27 |
|
Operations research |
31 |
46 |
22 |
|
Manufacturing/quality control |
30 |
42 |
28 |
|
Aerospace systems |
29 |
33 |
38 |
|
Develop and use mock-ups |
29 |
27 |
44 |
|
Process control |
28 |
39 |
33 |
|
Computer simulation |
26 |
57 |
17 |
|
Office automation |
25 |
41 |
34 |
|
CAD/CAM |
24 |
52 |
24 |
|
Product liability law |
24 |
36 |
40 |
|
Survey methods |
23 |
54 |
23 |
|
Maintainability |
22 |
42 |
36 |
|
Project management |
22 |
36 |
42 |
|
Motivation and reward structure |
20 |
64 |
16 |
|
Aging |
20 |
56 |
24 |
|
Speech recognition/synthesis |
20 |
42 |
38 |
|
Communication systems |
20 |
41 |
39 |
|
Team performance |
20 |
33 |
47 |
|
Transportation systems |
18 |
34 |
48 |
|
Cost estimation/budgeting |
18 |
28 |
54 |
|
Robotics |
17 |
57 |
26 |
|
Handicapped |
16 |
57 |
29 |
|
Group dynamics |
16 |
42 |
42 |
|
Group problem solving |
16 |
33 |
51 |
|
MANPRINT, HARDMAN, etc. |
14 |
16 |
70 |
|
Command and control |
13 |
38 |
49 |
|
Artificial intelligence |
11 |
72 |
17 |
|
Instructional systems design |
11 |
34 |
55 |
|
Organizational impact analysis |
7 |
33 |
60 |
|
Teleoperations |
7 |
33 |
60 |
|
Computer architecture |
7 |
31 |
62 |
|
Negotiation |
5 |
25 |
70 |
|
Mean |
41.2 |
33.3 |
24.2 |
|
Standard deviation |
22.6 |
12.2 |
17.7 |
work physiology; design of displays, controls, and workstations; and oral presentations. The topics covered in required courses by one-quarter or less of the programs tended to be specific topics dealing with applications of human factors, such as office automation, CAD/CAM, aging, transportation systems, robots, and teleoperations; or they were more industrial/organizational topics, such as group dynamics, team performance, motivation, and organizational impact analysis. Somewhat disappointing was the number of programs that do not cover the topic of MANPRINT in their program (70 percent).;
A comparison of the percentage of psychology and engineering programs that cover each topic in required courses revealed surprisingly few (18) significant differences (p < .05); Table 4.7 lists the topics that reached significance. In all but three cases, when differences occurred, engineering programs were more likely to cover the topic in required courses than were psychology programs. It appears that engineering programs are covering
TABLE 4.7 Differences in Topic Coverage in Required Courses Between Engineering and Psychology Programs (percentage of programs)
traditional psychology topics more than psychology programs are covering traditional engineering topics.
Programs were also asked to indicate in an open-ended question what specialties were emphasized in their program. One-third of the programs listed human factors/ergonomics as a specialty that was emphasized. Listed below are specialties listed by more than two programs:
|
Human-computer interaction |
31 percent |
|
Cognitive processes |
21 |
|
Biomechanics/work physiology |
17 |
|
Visual displays |
14 |
|
Safety |
10 |
|
Human performance |
7 |
|
Sociotechnical/organizational |
7 |
Another 14 different specialty areas were listed by one or two programs. It appears that considerable diversity exists to allow people to pursue specific specialties.
Respondents were asked if their program has responded to three specific areas: Defense Department initiatives such as MANPRINT, societal issues such as elderly and disabled people, and technical developments such as advanced manufacturing, robotics, and artificial intelligence. As would be expected, more engineering programs (96 percent) than psychology programs (68 percent) have reacted to technical developments. Reaction to societal problems is about equal among engineering (68 percent) and psychology (74 percent) programs. Hardly any programs (16 percent of both psychology and engineering) have reacted to Defense Department initiatives. Those that have responded have merely included the topic in their courses. This contrasts with the activities directed toward societal problems and technical developments: 21 percent report research activity on societal problems; 40 percent of the programs report research activities on technical development. And 27 percent report specific courses on societal problems; 23 percent report specific courses on technical developments.
Each program was asked to indicate which of 40 human factors activities their students do as part of their classwork (Table 4.8). At least two-thirds of the programs include various communication activities (oral presentations, preparing proposals) and research activities (collect data, perform statistical tests). Activities performed by one-quarter of the programs or less seem to center on training and reliability-related analyses. Comparisons of the percentages of engineering and psychology programs that have students perform these activities showed few significant differences (p < .05) (Table 4.9).
TABLE 4.8 Student Performance of Various Activities as Part of Their Classwork (percentage of programs)
|
Activity |
Students in Program Do as Part of Course Work |
|
Prepare/conduct oral presentations |
88% |
|
Collect data in laboratory settings |
85 |
|
Analyze tasks |
85 |
|
Specify/perform statistical tests |
81 |
|
Collect data in field settings |
73 |
|
Design data collection procedures/questionnaires |
71 |
|
Write/debug computer programs |
71 |
|
Design workspace layouts |
69 |
|
Prepare/contribute to proposals |
69 |
|
Evaluate reports written by others |
67 |
|
Design human-equipment interfaces |
65 |
|
Assess physical workload |
65 |
|
Interpret test and evaluation results |
65 |
|
Analyze effects of environmental stressors |
62 |
|
Develop analytical models/methods |
58 |
|
Develop/conduct computer simulations |
54 |
|
Assess mental workload |
54 |
|
Design software interfaces |
48 |
|
Verify design conformance to human factors specifications |
46 |
|
Perform safety analyses |
44 |
|
Develop criterion measures |
42 |
|
Collect error/failure/accident data |
42 |
|
Specify evaluation objectives |
35 |
|
Assess effectiveness of training |
33 |
|
Develop/analyze fault trees |
31 |
|
Conduct network analyses |
27 |
|
Prepare instructions/procedural documents |
27 |
|
Prepare engineering drawings |
27 |
|
Plan/coordinate evaluations |
27 |
|
Prepare/review, design drawings to human factor's specifications |
25 |
|
Prepare design mockups |
25 |
|
Prepare specifications for software |
25 |
|
Design training aids |
25 |
|
Perform human-reliability analyses |
25 |
|
Assess performance risks |
23 |
|
Prepare product warnings |
23 |
|
Perform failure-mode-effects analyses |
23 |
|
Conduct training |
21 |
|
Prepare training course materials/aids |
13 |
|
Conduct root cause analyses |
10 |
|
Mean |
46.2 |
|
Standard deviation |
22.3 |
TABLE 4.9 Differences in Student Performance of Various Activities Between Psychology and Engineering Programs (percentage of programs)
The Future
Respondents were, asked, if they could change any parts of their programs, what they would change and what was preventing the change from happening. A total of 38 programs responded. Although numerous specific changes were mentioned, adding more faculty was mentioned by 34 percent of the programs responding. As might be expected, the reason given for not hiring more faculty was fiscal limitation or lack of support for the area within the department or school.
Programs were also asked whether human factors education would change in the next five years and if so, how. Overall, 68 percent of the programs felt that human factors education would change in the next five years. A number of predictions were made; the dominant themes were that human factors education would be oriented more toward computers and industrial applications. Each of these were mentioned by 20 to 25 percent of the programs that responded. The Human Factors Society accreditation program was mentioned by five programs, predicting that the effect would standardize, formalize, and strengthen human factors education. One program predicted that small programs would suffer because of accreditation. Three programs predicted that education would become more specialized, a view that may be at odds with accreditation. Overall, the predictions were basically for "more of the same" and continuation of existing trends; no one predicted radical changes.
KEEPING CURRENT
Individuals were questioned about continuing education, professional activities, and books and periodicals that they read on a regular basis. Each of these sources of professional development is discussed in turn.
Continuing Education
About half (51 percent) of all human factors specialists, but only 40 percent of supervisors, have taken a human factors continuing education course in the past five years. Universities were the main source of such courses (35.2 percent) with professional associations (27.5 percent) and employers (19.7 percent) also being important. Private organizations or privately offered courses (10.4 percent) were less important. Overall, there is general satisfaction with the quality of continuing education courses. About 80 percent of specialists and supervisors rate their quality ''5 or above'' on a 7-point scale. Among specialists and supervisors, 54 percent do not feel that they are getting enough continuing education. The reason given by 66 percent of these people is something other than lack of course availability. Although not stated, probably it is because of a lack of time and/or support from employers.
Professional Activities
Table 4.10 presents the percentages of specialists and supervisors that indicated various professional activities in the last five years. These figures represent an active profession with considerable involvement by the rank-and-file.
Books and Periodicals Read
Approximately 90 percent (86.3 percent specialists and 92.2 percent supervisors) reported that they read periodicals regularly. The Human Factors Society Journal and Bulletin, mentioned by 28 percent of the respondents, were the most frequently mentioned periodicals. Computer magazines of
TABLE 4.10 Professional Activities Reported by Specialists and Supervisors
|
Activity |
Percentage Reporting |
|
Attended meeting of: |
|
|
1st organization mentioned |
65.6% |
|
2nd organization mentioned |
55.0 |
|
3rd organization mentioned |
57.8 |
|
Presented paper in past 5 years |
60.5 |
|
Attended a workshop at a meeting |
65.8 |
TABLE 4.11 Frequently Cited References
|
Reference |
Number of Times Cited |
|
Statistics/experimental design (various) |
88 |
|
Military standards/handbooks (various) |
81 |
|
Specific books: |
|
|
Sanders and McCormick (1987) |
68 |
|
Van Cott and Kinkade (1972) |
58 |
|
Salvendy (1987) |
55 |
|
Woodson (1981) |
47 |
|
Wickens (1984) |
26 |
|
Boff, Kaufman, and Thomas (1986) |
25 |
|
Eastman Kodak Company (1983, 1986) |
25 |
|
Boff and Lincoln (1988) |
24 |
|
Schneiderman (1987) |
24 |
|
Smith and Mosier (1984) |
21 |
one sort or another were the next most frequently mentioned, but these were cited by only 6 percent of the respondents. The number of different periodicals that were mentioned was staggering, including defense-oriented publications, industry trade magazines, psychology journals, business magazines, and industrial engineering and design publications.
Interestingly, about one-third of the respondents reported that they did not regularly refer to any particular books in the course of doing their current job. Respondents who did refer to particular books were asked to list them. As with periodicals, the list was staggering and, in addition, often contained insufficient or contradictory information, making it difficult to determine what book was being used. Table 4.11 presents the references listed by more than 20 respondents. Statistics/experimental design books and military standards/handbooks were each treated as a class and therefore were mentioned more than specific books. The top four specific books mentioned included one textbook (Sanders and McCormick, 1987) and three handbooks (Van Cott and Kincade, 1972; Salvendy, 1987; Woodson, 1981).
With this description of the education of human factors specialists and the characterization given in Chapter 3, we can examine the match or mismatch between the supply and demand of these professionals in the workplace.


