
1
The Environment For Technology Development
This report focuses on an important part of the competitive dynamic of any industrialized nation: the role and responsibility of the federal government, in cooperation with private sector firms, to facilitate technological progress. It is important, in any assessment of this subject, to begin with a brief overview of U.S. economic performance and the context in which government-industry cooperation in technology takes place.
Economic advance, of which technological innovation is a key component, is characterized by the ability of a nation to create and produce goods and services that meet global market needs, while at the same time supporting growth in real domestic incomes. The forces that drive economic growth and increases in domestic living standards depend in turn on many interrelated scientific, technological, managerial, social, and economic factors. These include continued improvements in productivity in both the manufacturing and the service sectors, and a stable macroeconomic environment. A skilled, motivated, and mobile work force and management; a strong research, development, and technology base; and progress in incremental advances in product and process technologies are also important. The ability of the public and private sectors to invest in R&D and physical capital, including infrastructure, is a fundamental part of economic advance, as well.1
There are indications that compared with previous postwar periods, the performance of the U.S. economy may have declined during the past 20 years. The fundamental problem facing the United States is the slow rate of
productivity growth. Growth in productivity is important for a number of reasons. Most importantly, it determines, in large part, national standards of living. A country that enjoys strong real growth in productivity over time can expect a corresponding increase in wages and income for its citizens. Nations with increasing productivity also have the capacity to support investment in programs that affect the quality of life for society as a whole. At the individual firm level, productivity growth rates determine, in part, the ability to compete effectively in global markets.
The rate of growth in labor productivity in the private, nonfarm business sector in the United States, which averaged 3.3 percent annually during 1948–1965, declined to roughly 1.2 percent after 1970. The slowdown in productivity growth has important implications for growth in domestic income. Had labor productivity growth maintained its pre-1965 average annual rate, by 1985 the total U.S. output would have been 45 percent higher than it actually was. Since 1973, labor productivity growth rates have dropped significantly, as has growth in real hourly earnings. Hourly compensation, which includes fringe benefits, has grown at only 0.8 percent annually since then.
There has been strong growth in per capita personal income, however, which includes not only wages and fringe benefits, but also dividends, rents, and transfers to compensation. Much of the divergence between the growth in per capita income and stagnant compensation growth rates appears to be due to rapid expansion of labor participation, growth in income from nonlabor sources, and a decline in real hourly wage rates of nonsupervisory (production) workers.2
Lower rates of growth in productivity and compensation also mean that the generation of workers entering the work force during the past 10 to 15 years—particularly production workers in positions that are usually associated with lower levels of skill, training, and education—faces the prospect of lifetime earnings and living standards lower than those of its parents. This is a risk as long as real compensation growth remains stagnant over time for these workers.
This report examines an important part of U.S. productivity growth and long-term standards of living: the development, commercialization, and adoption of new technologies. Based on our analysis of this subject, the panel has concluded that U.S. policy, as it relates to civilian technologies, requires change. The structure of postwar U.S. science and technology policy was in many important ways a response to the Cold War. With the passing of the Cold War and other developments in the international economic, political, and technological environments, modifications in U.S. policy toward civilian technology development are justified.
Modifications in U.S. technology policy, however, will be insufficient by themselves to reverse the trends in U.S. productivity and income growth
evident over the past two decades. Without complementary revisions in macroeconomic policy (particularly increasing public and private savings rates), strengthening of the public educational system, improvements in the performance of U.S. managers, and higher standards of manufacturing quality, design, and engineering, this report's recommendations for change in civilian technology policy will be less effective and possibly futile.
This chapter summarizes trends in recent U.S. economic performance and assesses the relationship between these trends and U.S. technological performance. A brief description of the technology creation, commercialization, and adoption process follow this discussion. The analysis presented in this chapter and subsequent material in Chapters 2 and 3 will show that there is a legitimate federal role in pre-commercial R&D and technology development. The United States can construct a technology policy that facilitates investment in these areas. It can strengthen current federal programs and implement new ones that leverage U.S. strengths in science and technological innovation.
PRODUCTIVITY GROWTH
It is important to note that an objective assessment of national economic and technological performance will show areas of both strength and weakness. Some analyses and public policy statements issued the past decade on U.S. performance have focused exclusively either on dramatic deficiencies in one sector of the U.S. economy or, in contrast, on areas of significant strength. In many cases, conclusions on the performance of the U.S. economy, in comparison to the nation's competitors, have been drawn from a few select examples and have failed to acknowledge the wide areas of broad strength in the nation's performance. The following discussion outlines, in summary fashion, areas of both concern and strength in the United States.
As noted, the single greatest weakness in recent U.S. economic performance is the disappointing rate of growth in labor productivity since the early 1970s. There are economic forces that serve to reinforce productivity growth, as well as those that amplify declines in growth rates. In addition to contributing to earnings and household incomes, higher productivity growth rates can provide for higher levels of private sector investment in science and technology-related assets. Strong productivity performance also supports higher levels of public investment in infrastructure and human capital (education, training, and skill enhancement).
Recent declines in labor productivity growth are not confined to the United States. Productivity performance in most of the member countries of the Organization for Economic Cooperation and Development has been poor since the mid-1970s, relative to growth rates from 1950 to 1974.3 Moreover, although U.S. productivity growth has slowed in recent years,
TABLE 1-1 Real Gross Domestic Product Per Capita Based on Purchasing-Power-Parity Exchange Rates
the level of U.S. labor productivity remains the highest in the world. The United States, as shown in Table 1-1, continues to outperform other countries in real gross domestic product (GDP) per capita. The measured rates of productivity growth for U.S. manufacturing, in particular, have improved significantly compared to the very low growth rates of the 1970s and early 1980s. (Some portion of this improvement, however, may be the result of changes in the measurement of manufacturing output in such high-technology industries as computers, as well as changes in the organization of manufacturing establishments.)
Although manufacturing productivity growth in the United States has improved in recent years, current data may overstate this improvement somewhat. Likewise, poor productivity growth in the nonmanufacturing (service) sector of the U.S. economy may reflect the lack of up-to-date data and the difficulty of measuring productivity growth. These difficulties have been compounded by underinvestment by federal agencies in data collection. Measurement of productivity in the service sector has clearly not kept pace with changes in the economy in recent decades.4
As shown in Table 1-2, average annual labor productivity growth in the U.S. nonfarm business sector slowed from a rate of 2.2 percent during 1960
TABLE 1-2 Productivity Growth for Selected OECD Countries (percentage changes at annual rate)
|
|
1960-1973 |
1973-1979 |
1979-1990 |
|
Total factor productivitya |
|
|
|
|
United States |
1.6 |
-0.4 |
0.3 |
|
Japan |
5.9 |
1.4 |
2.0 |
|
Germany |
2.7 |
1.8 |
0.8 |
|
United Kingdom |
2.3 |
0.6 |
1.6 |
|
OECD Europe |
3.3 |
1.4 |
1.3 |
|
OECD |
2.8 |
0.5 |
0.9 |
|
Labor productivityb |
|
|
|
|
United States |
2.2 |
0.0 |
0.7 |
|
Japan |
8.6 |
2.9 |
3.0 |
|
Germany |
4.6 |
3.1 |
1.6 |
|
United Kingdom |
3.6 |
1.6 |
2.1 |
|
OECD Europe |
5.0 |
2.7 |
2.0 |
|
OECD |
4.1 |
1.4 |
1.5 |
|
a Total factor productivity is equal to a weighted average of the growth in labor and capital productivity. The sample-period averages for capital and labor shares are used as weights. b Output per employed person. SOURCE: Adapted from Organization for Economic Cooperation and Development, OECD Economic Outlook #50, 1991, Table 48. |
|||
to 1973, to no growth from 1973 to 1979. It rose an average of only 0.7 percent per year from 1979 to 1990. Labor productivity in Japan, Germany, and other nations followed a similar, even steeper pattern of declining rates of growth. In Japan, annual productivity growth fell from an average of 8.6 percent during 1960 to 1973 to a rate of 2.9 percent in 1973 to 1979, for example. Surprisingly, despite considerable research, economists have yet to develop a widely accepted explanation for the post-1973 global decline in productivity growth. Most scholars nonetheless agree that declines in rates and changes in the nature of capital formation, changes in the composition of the labor force, the energy price increases of the 1970s, and lower rates of growth of R&D investment contributed to this decline. Each of these factors is examined, in brief, in the following pages.
Capital Investment
International comparisons of productivity growth rates show a strong correlation between higher growth of capital input per worker (or higher levels of investment) and higher productivity growth rates. One reason for this relationship is the fact that technological advances are often embodied in new physical capital (plant and equipment). In order to reap the benefits of robotics technologies, for example, a firm must invest in new production equipment. One study of postwar economic growth in five industrialized nations found that the benefits of technological progress are ''capital-augmenting.''5 In other words, it is possible to show that technical progress is biased toward capital investment and that capital and technical progress are complementary. The benefits of technical progress are larger with larger capital stocks (total level of plant and equipment in an economy).
Other scholars have estimated that "capital-labor" substitution, or replacing labor (hours worked) with capital equipment, contributed 19 percent of U.S. productivity growth from 1947 to 1985 and 13 percent of growth from 1979 to 1985.6 Another recent survey of the contribution of capital investment to productivity growth found that increased capital quality contributed 28 percent of U.S. productivity growth from 1947 to 1985 in the United States, with a 30 percent contribution to overall growth in 1979 to 1985.7
Declines in the rate of capital formation in the United States, therefore, may have contributed to the recent productivity slowdown. An examination of the 1970s, however, does not show lower rates of gross investment in physical capital in the United States relative to previous periods. Gross investment was sustained at historic levels during the 1970s and continues to grow today. The rate of growth in capital input, however, has not kept pace with expansion of the labor force, especially during the 1970s.8 Thus, productive capital available per worker has declined. Moreover, the com-
position of the capital investment of the 1980s shifted slightly to favor greater investment in real estate and less in physical plant and equipment.9
Demographic Shifts
Changes in the demographics of the U.S. work force may also have contributed to lower rates of productivity growth after 1973. The U.S. work force grew rapidly during the 1970s, as the baby-boom generation entered the workplace. The ability of the U.S. economy to absorb this large expansion in workers without sharp and sustained increases in unemployment rates is itself a remarkable achievement. Many Western European economies have fared less well in absorbing their baby-boom generations and women into their domestic work forces, which has contributed to the relatively high and sustained unemployment rates in Western European economies since the mid-1970s.
In the United States, rapid expansion of the work force during the 1970s and 1980s made it far more difficult to maintain historic levels of labor productivity growth. In addition, the changing composition of the work force associated with the entry of baby boomers and the increase in labor force participation rates of women meant an expansion in less experienced workers as a share of the total work force. As one estimate of changes in the work force suggested, the U.S. shift of labor resources to lower-productivity workers between 1970 and 1983 decreased average productivity growth (based on 1979 employment shares) by 0.2 percent.10 Other widely cited studies have also found that changing demographics in the United States, especially since the late 1960s, have contributed to lower productivity.11 Since the U.S. labor force now is growing more slowly and is forecast to grow roughly one-half as rapidly through much of the 1990s as it did during the 1980s, this source of downward pressure on productivity growth rates should be reduced, at least for the intermediate term.
Rising Energy Prices
Disruptions in world oil markets also played a role in the productivity slowdown. Dramatic increases in energy prices during the 1970s may have accelerated the rate of obsolescence of existing plants and equipment, thus increasing the levels of capital investment required to maintain previous levels of productivity growth. World energy prices quadrupled in 1974 after the Organization of Petroleum Exporting Countries set benchmark prices for crude oil, and they rose again in 1979 and 1980. These sharp rises in energy prices caused serious disruptions in the economy, contributed to inflationary pressures, and quickly made much of the existing stock of plant and capital equipment, as well as other energy-inefficient investments, ob-
solete. Increases in energy prices, therefore, contributed to lower rates of growth in labor productivity, although higher prices did direct investment to energy-saving structures and equipment, with great improvements in energy efficiency.
Slowdown in Research and Development Spending
Spending on research and development also contributes to productivity growth. A number of studies have found a link between industrially funded R&D investment and productivity growth at both the individual firm and the industry levels. Most of these studies also suggest that industrially financed R&D does not affect productivity for at least three to six years. This delayed effect, which is even longer for basic research expenditures, reflects the time needed to commercialize and adopt innovations based on R&D investment. Therefore, the slowdown in industrial R&D expenditure growth in the U.S. economy during the early 1970s may well have had an impact on labor productivity growth rates into the 1980s. The resumption of growth in industrial R&D expenditures after 1975 would have similarly delayed effects, as will the recent (1988–1991) declines in growth in industrial R&D expenditures.
The reasons for the change in the growth rates in industrially funded R&D expenditures in the United States during the 1970s and 1980s are not well understood. Nonetheless, there is little doubt that U.S. industry for some years has been investing less of its own funds in R&D (measured as a share of gross national product) than has Japanese or German industry. Since 1970, domestic U.S. industrially funded R&D has accounted for a smaller share of U.S. gross national product (GNP) than have Japanese or German industrially funded R&D expenditures (measured as a share of Japanese and German GNPs, respectively). When comparing nondefense R&D expenditures as a percentage of GNP from all sources (industry and government), the United States has also invested less than other nations. In 1971, for example, the United States, Japan, and Germany spent 1.7, 1.9, and 2.0 percent of GNP on nondefense R&D, respectively. The U.S. investment in R&D has now fallen well behind that of its industrial competitors. In 1987, the U.S. share was still 1.7 percent, whereas Japan and Germany had shares of 2.8 and 2.6 percent, respectively.12 As noted below, U.S. federal R&D expenditures are largely devoted to defense-related work. This fact, combined with the sizable portion of U.S. national R&D investment that is funded from public sources (which substantially exceeds the proportion in Japan and Germany), means that U.S. nondefense R&D expenditures (from public and private sources) account for a smaller share of GNP than do Japanese and German nondefense R&D.
TECHNOLOGY CREATION, COMMERCIALIZATION, ADOPTION AND TRANSFER
The economic performance of the United States during the last decade combines areas of strength and weakness. The United States does, however, retain global dominance in scientific research and "innovation" (defined below), as revealed in Nobel Prizes and citations of papers published by U.S. scholars, among other indicators. The innovative capacity of the United States, relative to its past performance, we believe, has not declined.
The panel has concluded, however, that the nation requires a better-balanced technology policy that includes support not only for basic research but also for pre-commercial R&D and technology adoption. The United States can leverage its strengths in science and invention to increase the rate of technology commercialization in the economy. The environment for technology development has changed. This has contributed, in part, to changes in the circumstances through which the economic returns to research and technology are captured. To illuminate this assertion and lay the groundwork for an analysis of changes in the environment for technology development, we now turn to a discussion of the processes through which technologies are created and yield economic returns.
Technology Creation
The creation and realization of economic benefits associated with new technology involve a number of phases that interact with one another and frequently extend over a lengthy period of time. The initial phase, the creation of new technology, is often referred to as "invention," and typically involves fundamental scientific and engineering research that demonstrates a basic concept or proves the feasibility of a specific solution to a problem. This first phase of the technology development process often involves basic research efforts. In the United States, a significant portion of this "upstream" research in both industry and universities has been supported by the government. (During 1985 to 1988, roughly two-thirds of all basic research performed in the United States was supported by federal funds.) In many cases, results from the invention phase lead to the publication of scientific papers or applications for patents. The results of this phase, however, are rarely translated into commercial sales or large profits.13
Commercialization
Invention is followed by "innovation," or commercialization. This phase involves the translation of a scientific or technological advance into a commercial product. The focus of the vast majority of industrial R&D expendi-
tures is not on research (the "R" of R&D) but on development, an activity that includes the technical components of commercialization of new scientific or technological advances. It also may involve the improvement of existing products or processes through the application of such advances. In many instances, innovation requires the combination of a number of technological or scientific advances in an improved version of an older product. In other cases, it requires a very large investment of resources in the "scaling up" of production facilities to manufacture commercial volumes or to ''debug'' devices that have been proved to operate in the laboratory.
Those involved in translating a new scientific or technological advance into a commercial product often are not the same individuals responsible for the underlying invention or discovery. Moreover, the time lag between invention and innovation may be quite long, and much of the "science" that underpins contemporary technological innovation may in fact be based on research performed decades earlier. Nevertheless, the invention and innovation phases of the creation of a new technology are not strictly sequential, but often interact with one another. Problems encountered in translating new science into new products often feed back into the scientific research process. The development of radioastronomy, for example, originated in efforts to reduce background noise in long-distance telephone communications. Almost always, manufacturing processes, as well as consumer preference and product development requirements, are key elements of the development process.
Successful innovation results in a new process or product that may yield large profits to the firm or individual responsible for the innovation. This requires investment in a wide range of "complementary" activities that extend well beyond narrowly defined scientific inquiry or engineering work. Improvements in production processes, for example, are often required to manufacture a new product at the lowest possible cost. The commercialization of a new product may also require significant investments in distribution and marketing networks. Moreover, the magnitude and importance of these investments often mean that individuals or firms that first introduce a new process or product may not capture much of the profits from it. Rivals are often able to quickly imitate or duplicate technological advances.
The economic returns of new technology assume two forms: (1) profits to the individual innovator (or shareholders of a corporation), along with higher wages and compensation for workers; and (2) benefits to the economy channeled through the adoption of new products and processes by other firms. The latter also includes benefits to consumers through a wider range of product choices that better satisfy human needs. The commercial introduction of a new product or the application of new technologies to improve an established product (e.g., automobiles) often produces large sales at a high price, yielding significant profits to the innovating firm or entrepre-
neur responsible for successful commercialization or improvement. These profits in turn are distributed to shareholders. In many instances they are reflected as well in above-average wages and salaries in the firm or industry responsible for successful innovations. Some portion of the U.S. economy's ability to pay high wages, relative to other nations during the postwar era, clearly reflects the successful commercialization of a stream of new products and processes by U.S. firms. If U.S. ability to successfully and rapidly commercialize new technologies declines, this source of competitive advantage and above-average wages and salaries will also decline.
Product innovations and improvements are extremely difficult to measure with conventional economic statistics. Their benefits often are not captured by conventional measures of productivity growth. Recent efforts by the Bureau of Economic Analysis of the Department of Commerce to adjust the data on the computer industry to reflect improvements in product quality (adjustments with important implications for measured productivity growth) have proved difficult and controversial. Such measurement problems are widespread in manufacturing. They are even more serious in the nonmanufacturing sector. This is true, in particular, because large numbers of new products that advanced information technologies have made possible go largely unmeasured in national income and productivity data. In both the manufacturing and the nonmanufacturing sectors, therefore, the productivity and output statistics often do not take into account the results of product innovation and improvement. Nevertheless, it is clear that the magnitude of the productivity slowdown is a problem for the United States.
Adoption
A second channel through which the economic benefits of new technologies are realized is their adoption by other firms within an economy. Firms that rapidly and effectively incorporate new process and product technologies into the production of goods and services often improve productivity and competitive advantage in ways that (at least in principle) are captured by conventional measures of labor productivity. The adoption of new technologies is a costly and often knowledge-intensive process. It involves investments in worker training, new capital equipment and plants, information collection, and product and process debugging. Indeed, many of the skills and capabilities necessary to be an effective innovator or creator of technology are also indispensable for the successful adoption of new technologies. The adoption of a computer-integrated work cell, or work station, for example, requires extensive customized software and the removal of special defects at the installation site. In addition, the technology undergoes modification and improvement during the adoption process, as the
"hands-on" learning by users is fed back to developers and incorporated into redesigned versions of a machine or piece of software. As a result, other users of the technology may get an improved version of the original technology, which is a reason to delay commitment to a new technology. This is particularly true if the adoption of subsequent versions of a specific technology is expected to be relatively less costly and if waiting to adopt a technology does not put a firm at an immediate competitive disadvantage.
Other factors affecting the speed with which firms adopt new technologies include the costs of these new technologies. The costs in many cases depend on domestic interest rates and other factors affecting the cost of capital, the state of development of technical standards, and the level of worker skills. Because the adoption of most new technologies is the outcome of investment decisions, rates of gross domestic capital formation affect the rate at which the domestic capital stock is "turned over" and new equipment replaces older machinery. Economic factors affecting capital formation therefore may influence international differences in the rate of adoption of new technologies. Technical standards can reduce the information costs associated with evaluating and adopting new technologies (e.g., by reducing the requirements for extensive customization of a machine or system for a specific installation).
Finally, the skills of the production work force in manufacturing industries can influence the costs and the rate of adoption of new technologies. A work force that is functionally illiterate, for example, will require more expensive training than one that is well-endowed with basic skills. The influence of worker skills may be especially important for the adoption of computer-based manufacturing technologies (robotics, computer-integrated manufacturing, etc.), since these technologies often place greater demands on the cognitive and numerical abilities of production workers, as well as their ability to diagnose problems in the production process.
The costs of adoption may make it especially difficult for smaller and medium-sized firms to utilize new technologies. This is because many small and medium-sized firms have limited resources, lack access to external sources of capital, and do not benefit from the same economies of scale available to larger manufacturers that adopt new technologies.
The importance of technology adoption means, among other things, that the economic benefits from the innovative activities of high-technology industries are not confined to those industries, but potentially can be reaped by firms in so-called low-technology, less R&D-intensive industries. The international competitive performance of Japan, Sweden, and Germany is based in part on the ability of firms in "mature," less R&D-intensive industries (e.g., automobiles, machine tools, and textiles) to quickly and effectively incorporate new products and processes into their products.
Technology Transfer
The processes through which new technologies are created, commercialized, and adopted involve many different organizations and an extensive flow of information. Technology transfer within and among organizations underpins the translation of science into product, as well as the adoption of new products and processes. The process of technology transfer is complex and information-intensive. It is based to a large extent on the ability of individuals (and groups of individuals) involved in research to interact with those responsible for technology commercialization.
When these interactions do not take place, technology transfer is impeded. Geographic distance between firms is one reason technology transfer may be slow or nonexistent. Even within a single firm, large and separate divisions for research, manufacturing, and development can pose problems to effective technology transfer. Many of the barriers associated with transferring technology are unrelated to government agency policy, the level of funding for university research, or the lack of appropriate institutions and mechanisms to facilitate technology transfer.
The geographic and organizational barriers to technological transfer include divided missions, responsibilities, and rewards. Trying to correct these problems by creating new mechanisms or institutions that are both geographically and organizationally distinct from technology sources or targets is not likely to be effective. There are also psychological barriers to technology transfer. The "not-invented-here" syndrome is a significant obstacle to technology transfer within and among university, government, and industry laboratories. A lack of continuous communication between scientists and engineers, or between development and manufacturing engineers, can also inhibit technology transfer, for example.
An alternative view of technology transfer that has influenced recent federal government initiatives is the so-called linear model, which offers an incomplete and distorted view. The linear model of technology development suggests that ideas originate in pure research; are transferred to applied research; and from there, go on to advanced development and manufacturing. This model drives technology transfer programs in ways that do little to match the needs of industry. With the linear model, progress comes in great steps. In some instances, there are indeed breakthrough innovations that either create new industries or transform existing ones. Many of the technology transfer programs established by Congress and implemented by federal agencies have been modeled on this technology "push" framework. It assumes that federal laboratories funded by the government, for example, operate in this manner and are repositories for technologies that are of great value to industry. This is an incorrect assumption.14 In semi-
conductor and computer manufacturing, for example, progress is made primarily through incremental improvements in a cyclical manner.15 The driving force is speed in the manufacturing cycle. If a new idea is proposed at any time other than the beginning of a development cycle, it demands adjustments, testing, and problem solving that endanger time schedules, particularly with complicated manufacturing processes and products. Minor changes may cause reliability and manufacturing problems. Timing, therefore, is a critical part of the competitiveness equation. Teamwork is important to the development of a fine sense of timing in industrial research and development.
In general, successful technology transfer involves cooperative work among people whose interests and talents in development, research, and manufacturing are combined to meet the requirements of a specific goal. Linking research and development programs to the manufacturing and marketing segments of an organization is one way to ensure that technology transfer will occur rapidly enough to meet the demands of the market. The key to the success of these programs is shared technical visions and shared goals, including a mutually agreed-upon work plan and program timetable, division of labor among the joint program participants, and articulated product goals. Moreover, this type of technology transfer has to be ongoing; it cannot simply focus on one generation of technology. Projects must be organized so that, while development groups concentrate on the next product, a joint program is working on the technology for follow-on products, and research is targeted at the next generation out. Joint program coordination is the key to success.
To a great extent, technology transfer programs need to be tailored to individual cases. This point will be expanded in the next chapter of the report. There are key elements that carry through on nearly all successful transfer efforts. The participants all "get on the same wavelength." They know ahead of time, step-by-step, what they will be expected to accomplish and what their collaborators will be expected to accomplish. Finally, all parties have as clear an idea as possible of what product they want to bring to market.
Joint work, mutually agreed-upon goals, and a managed division of labor across organizational and disciplinary boundaries are the key to technology transfer. One of the reasons for the success of the national weapons laboratories is that the government has assumed the role of customer: setting specifications, taking delivery of the "product," and evaluating what was actually produced against the requirements.
The transfer process is especially difficult because so much of the knowledge necessary to advance the process of technology creation or adoption is not easily written down or codified in a blueprint or technical drawing.
This knowledge is not easily transferred among or within organizations without significant effort. In many instances, transferring a technology requires transferring the individuals in whom the knowledge resides. Moreover, the successful transfer of technological or scientific information often requires a sustained interaction between the individuals or organizations responsible for the research, on the one hand, and those responsible for its commercialization, on the other. The flow of information is by no means a one-way flow, and successful technology transfer often assumes the characteristics of a contact sport.
Among the processes of technology creation, commercialization, and adoption, the commercialization and adoption stages are the most fruitful sources of economic benefits. Realizing economic returns from scientific and engineering advances requires their incorporation into new or existing products or processes. As noted, U.S. performance in technology creation remains very strong, as indicated by a number of indices. In many sectors, U.S. firms and industries continue to exhibit significant strengths in technology commercialization, as well.16 This does not mean, however, that we should not attempt to find methods of improving U.S. performance in technology commercialization, especially where private markets fail to provide for investment in pre-commercial R&D (defined in the box that follows). We believe that the historic focus of federal science and technology policy on basic research, as opposed to pre-commercial R&D or adoption, may contribute to an erosion in the ability of some important U.S. industries to commercialize and adopt new technology.17 Concern over U.S. performance in adoption and commercialization has been expressed in a series of reports issued by other expert committees in recent years, some of which are referenced in this report (Chapter 2).
U.S. STRENGTHS AND WEAKNESSES
The United States continues to lead the world in basic research.18 In comparison to other major industrialized nations, the United States has spent more as a percentage of GNP on basic research over the past several decades. Real growth in expenditures from 1986 to 1989, the most recent period for which data exist, was 3 percent per year. The United States invests approximately half of that funding in the world's most dynamic and productive system of university research. The United States will have to continue to develop programs to attract more individuals into careers in science and engineering, attempting to draw women and minorities into this system. There has already been some progress in this area. Women scientists and engineers, for example, now represent more than 13 percent of the total science and engineering work force, up from 11 percent in 1980. A
|
Pre-Commercial Research and Development Research and development is a dynamic, complex process. It involves a wide range of activities that can include work usually associated with basic scientific research, as well as R&D in engineering design and manufacturing. The setting for R&D is equally diverse. Research is performed in university laboratories by a single, private investigator and also in corporate R&D facilities with several hundred researchers. It is extremely difficult to measure precisely where basic, pre-commercial, and applied R&D efforts begin and one line of scientific inquiry is terminated. Moreover, research and development, as it relates to technological innovation and technical change, does not necessary follow a linear model or evolutionary, predetermined process. There are discreet examples of great breakthrough discoveries in science and engineering that have had significant impacts on technological innovation. Some of most notable technology leaps in the past 25 years include the development of the microprocessor, the discovery of optical fiber materials, and genetically engineered biotechnology products. Even these technological breakthroughs did not take place in isolation, however, but were developed by building on existing R&D and technical information bases and expertise. In sum, research and development, whether it unfolds under a series of incremental, evolutionary steps—sometimes with feedback from downstream, sometimes through continuous improvement—or under conditions in which significant technological and scientific breakthroughs occur, involves many actors and lines of inquiry that proceed with links and feedback between those engaged in the most basic search for new knowledge and those involved in activities just short of commercial product introduction. The public policy debate over federal support for private research efforts has centered on questions about the nature of the research to be conducted with public funds. A central issue is whether a research project has successfully advanced so that the commercial potential and technical merit of the R&D are sufficiently clear to induce private funding of the effort. It is relatively easy to identify a project that is fundamentally basic in nature or one that involves work in new scientific areas in the search for knowledge. In these areas, there is a clear public need to provide funding through the federal government to support basic science and research. Private companies have little financial incentive to invest in R&D that will be available outside the company and therefore involves significant problems in appropriability for the firm. It is when scientific inquiry involves the promise of useful new knowledge that is generic in nature, with wide applications across economic activities, and there are insufficient private returns to investments in R&D that government must act. |
|
Beyond basic research, there is an area of science and engineering work that falls short of product-or process-specific, applied R&D. This is R&D in pre-commercial areas, where lines of inquiry in basic scientific research have advanced beyond the search for new knowledge.* In pre-commercial R&D, technical knowledge and the scientific base for a potential advance in product or process technologies are at an early stage of development. It is in R&D work that significant barriers exist to private sector estimates of commercial market potential. Technical obstacles that represent serious, risky, and uncertain challenges to moving to the applied R&D or prototype development stage are present, as well. If these problems are successfully resolved, pre-commercial R&D may move into later-stage R&D, which is characterized by applied research, prototype development, and testing. This is where, in most instances, the economic potential of specific advances in products and processes becomes clear. Pre-commercial R&D is also an area that can be identified by the existence of substantial "appropriability" problems. The ability of private firms to capture the economic benefits of investments in this type of work is limited. It is difficult, therefore, for private firms to appropriate or capture the knowledge, expertise, and insight that might result from R&D in these areas. The nature of pre-commercial R&D is characterized then by spillovers into the general knowledge base, where other firms can appropriate the economic "rents" or benefits of one firm's investments. In the absence of public support, therefore, there would be substantial underinvestment in potentially useful R&D work that might embody resulting advances in science and technology, with great social and economic benefit to the nation, as well as financial benefit to firms not investing. As noted in Chapter 2, R&D in which technical and market risks are high, costs associated with private investment are substantial, and appropriating the benefits of investment is difficult, contains a public good component that can appropriately merit government financial support. |
continuing U.S. strength is its ability to encourage and assimilate science and engineering talent from diverse population groups, especially in comparison to the poor record of other industrial economies.
The output of the basic research system in the United States also shows continued strengths in the nation's ability to support the creation of new technologies. The U.S. share of world scientific and technical literature, as reflected in data on the number of papers appearing in journals and other publications, has remained steady since 1945, averaging about 36 percent of total world output. Another indicator of national performance in technology creation is patents.19 Patent data are particularly revealing in areas where patent protection is considered key to the ability to generate private profit. Although patenting in the United States declined during the 1970s, it recovered in the 1980s. Much of the fluctuation reflected changes in the levels of R&D spending by U.S. industry, as well as changes in funding for the U.S. Patent Office, which affect the time needed for processing applications and granting patents.
The United States continues to lead the world in the number of U.S. patents granted across a broad array of industries. A total of 54,762 patents were granted to inventors of U.S. origin in 1990, over 20,000 more than were granted to Japan, Germany, France, and the United Kingdom combined (33,875). Some nations, particularly Japan, have increased their share of U.S. patents granted over the past decade. The United States continues, however, to exhibit unsurpassed strength, evidenced in cycles during which patent grants have grown, slowed, and continued upward. Moreover, when data on patent applications are examined, as opposed to data on patents granted, the evidence (as shown in Figure 1-1) indicates that patent activity by U.S. residents in the United States did not slow down in any systematic fashion from 1953 to 1987.
The United States also remains a strong net exporter of technology. It leads the world in scientific output, as translated into patents, licenses, fees, and other transactions (intellectual property). As of 1989, the United States had a net of $1.3 billion in its technological balance of payments.20 U.S. receipts (payments for intellectual property from foreign sources, excluding intracompany transfers) were roughly four times U.S. payments in 1989, essentially the same ratio as in 1979. In industries such as chemicals, commercial aircraft, and pharmaceuticals, U.S. firms have retained international competitive advantage by investing in the rapid incorporation of new technologies into products and maintaining state-of-the-art process technologies.
Moreover, the U.S. manufacturing base is not in decline. The United States is not deindustrializing, as has been suggested in the past by some analysts and public policy advocacy groups. For example, manufacturing output has accounted for a nearly constant share of GNP (constant 1982
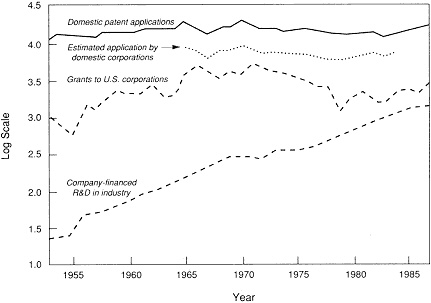
Figure 1-1
U.S. Domestic Patent Applications, Grants to U.S. Corporations, and Company-Financed R&D, 1953-87. Source: Griliches, Zvi. 1989. "Patents: Recent Trends and Puzzles," in Brookings Papers on Economic Activity, p. 293.
dollars) since 1947.21 Indeed, as a share of GNP output in 1988 (23 percent), it exceeded that of 1947 slightly (21 percent). The share of total GNP for most durable and nondurable goods sectors (manufacturing) over the period 1978 to 1988 remained stable (Table 1-3).
In addition, real output in manufacturing from 1978 to 1988 (from approximately peak to peak in the business cycle) grew in all categories of both durable and nondurable goods, except tobacco manufactures, leather and leather products, primary metals, and motor vehicles and equipment (Table 1-4). Table 1-5 shows the change in real output in each industry sector for the same period. Gains in output in many products were impressive. Real output in nonelectrical machinery, for example, more than doubled over this 10-year period. Output in electric and electronic equipment, transportation equipment (other than motor vehicles), instruments and related products, and chemicals and allied products rose by about 50 percent during that period.22
The United States also continues to exhibit considerable strength in exports of manufactured and high-technology goods.23 By 1988, the United States retained a 20 percent share of world exports of technology-inten-
sive products, although the total share had fallen slowly since the 1970s.24 In this area, U.S. performance, relative to its historical postwar record, continues strong. The 1991 merchandise trade balance for high-technology products totaled $36.7 billion. This compares to a deficit of $102.9 billion for all other U.S. merchandise trade.
In sum, it is important to note that, contrary to many other assessments of U.S. technological performance, we find that the United States continues to exhibit considerable strength in a wide range of industrial sectors, as evidenced in part by an analysis of the data on both industrial output and exports. There is no systematic erosion of the nation's advantages in global markets or its ability to produce and market high-technology goods and services. Much of the debate over competitiveness during the 1980s was driven by concern about the U.S. trade balance, particularly trade in manufactures. A brief summary of the developments that led to the large trade deficits during this period is illustrative.
The primary factor that contributed to growth in U.S. trade deficits during the 1980s is accounted for by imbalances in domestic consumption, savings, and investment patterns. The U.S. trade deficit is a product of macroeconomic forces in the economy. The combination of a decline in domestic savings and high levels of consumption, reflected in the strong growth in imports, contributed to the large deficits in trade from 1982 to 1987.
Macroeconomic forces in the United States during the early 1980s also contributed to the rapid appreciation in the value of the dollar against other currencies in international markets (more than 60 percent during the early 1980s). The real effective exchange rate for the dollar rose from 85 in 1981 (March 1973 = 100) to a high of approximately 150 in early 1985.25 Although it has since fallen to the level of 1981, the impact of this extended period of high-value and the resulting price increases of U.S. goods in world markets undoubtedly contributed to the sharp rise in the trade deficit.
Most importantly, during this period, foreign (as well as domestic) consumers were exposed to less expensive and in some case higher-quality goods from countries other than the United States. The long-term implications of this shift in consumption patterns, facilitated in part by the rapid appreciation of the dollar in the first half of the 1980s, are unclear. This is especially true with respect to the ability of U.S. firms to recapture markets that may have been lost during this period.
Although U.S. exports today, particularly in manufactures, are strong, foreign competition continues to improve, especially for high-technology end products and processes. Foreign competition, moreover, is increasingly based on the returns to high levels of industrially funded investment in R&D and growing public investments in research, technology development, and education.
TABLE 1-3 Gross National Product by Industry (billion 1982 dollars)
|
|
1978 |
1979 |
1980 |
1981 |
1982 |
1983 |
1984 |
1985 |
1986 |
1987 |
1988 |
|
Gross National Product |
3,115.2 |
3,192.4 |
3,187.1 |
3.248.8 |
3,166.03 |
3,279.1 |
3,501.4 |
3,618.7 |
3,717.9 |
3.717.9 |
4,024.4 |
|
Domestic industries (Gross Domestic Product) |
3,073.0 |
3,136.6 |
3,131.7 |
3,193.6 |
3,114.8 |
3,231.2 |
3,457.5 |
3,581.9 |
3,687.4 |
3,827.2 |
3,996.3 |
|
Manufacturing |
694.7 |
712.2 |
673.9 |
678.6 |
634.6 |
674.2 |
752.4 |
779.2 |
803.2 |
849.7 |
927.5 |
|
Durable goods |
423.3 |
433.1 |
408.5 |
408.6 |
362.5 |
383.8 |
448.6 |
471.5 |
482.7 |
517.4 |
583.2 |
|
Lumber and wood products |
19.3 |
21.7 |
21.3 |
16.5 |
16.0 |
18.8 |
20.9 |
19.8 |
21.3 |
24.2 |
25.7 |
|
Furniture and fixtures |
11.1 |
10.9 |
10.4 |
10.2 |
9.5 |
10.4 |
11.6 |
12.1 |
12.0 |
12.8 |
12.3 |
|
Stone, clay, and glass products |
23.3 |
23.5 |
21.3 |
20.2 |
18.2 |
19.7 |
21.3 |
22.2 |
22.9 |
24.9 |
25.2 |
|
Primary metal industries |
52.8 |
52.7 |
48.2 |
50.6 |
35.3 |
28.9 |
33.4 |
32.7 |
32.2 |
34.6 |
37.9 |
|
Fabricated metal products |
53.4 |
56.0 |
53.7 |
53.0 |
46.3 |
48.8 |
54.8 |
56.2 |
54.8 |
58.4 |
63.2 |
|
Machinery, except electrical |
80.9 |
85.6 |
86.1 |
89.6 |
80.0 |
84.8 |
105.7 |
124.21 |
29.4 |
140.7 |
170.5 |
|
Electrical and electronic equipment |
56.2 |
60.2 |
63.3 |
64.9 |
61.8 |
64.6 |
73.5 |
74.37 |
4.1 |
78.3 |
88.1 |
|
Motor vehicles and equipment |
58.1 |
51.6 |
35.2 |
34.8 |
29.5 |
37.8 |
47.3 |
50.3 |
46.5 |
46.4 |
51.7 |
|
Other transportation equipment |
34.9 |
36.5 |
37.4 |
33.1 |
32.2 |
37.6 |
41.3 |
42.5 |
49.8 |
55.5 |
60.9 |
|
Instruments and related products |
20.3 |
22.4 |
21.9 |
23.8 |
22.6 |
23.1 |
25.2 |
24.2 |
25.7 |
26.7 |
31.5 |
|
Miscellaneous manufacturing industries |
13.0 |
12.0 |
9.7 |
12.1 |
11.1 |
9.5 |
13.7 |
13.0 |
14.0 |
15.0 |
16.1 |
|
|
1978 |
1979 |
1980 |
1981 |
1982 |
1983 |
1984 |
1985 |
1986 |
1987 |
1988 |
|
Nondurable goods |
271.4 |
279.0 |
265.5 |
269.9 |
272.1 |
290.4 |
303.8 |
307.7 |
320.5 |
332.2 |
344.3 |
|
Food and kindred products |
56.6 |
59.5 |
59.8 |
58.9 |
61.4 |
62.7 |
62.1 |
64.8 |
65.6 |
66.5 |
67.8 |
|
Tobacco manufactures |
9.9 |
9.9 |
9.6 |
9.9 |
8.9 |
8.0 |
7.8 |
6.2 |
7.0 |
5.6 |
4.7 |
|
Textile mill products |
16.6 |
17.0 |
16.4 |
15.8 |
14.8 |
16.2 |
16.0 |
15.6 |
17.0 |
17.3 |
16.8 |
|
Apparel and other textiles |
21.5 |
21.3 |
21.1 |
20.3 |
18.9 |
20.1 |
20.4 |
20.1 |
21.0 |
22.7 |
23.2 |
|
Paper and allied products |
28.9 |
28.7 |
25.8 |
25.5 |
26.7 |
29.0 |
29.5 |
30.2 |
31.6 |
33.8 |
34.9 |
|
Printing and publishing |
36.2 |
37.1 |
37.0 |
38.6 |
38.4 |
39.6 |
40.8 |
42.5 |
43.1 |
43.6 |
45.5 |
|
Chemicals and allied products |
55.1 |
56.7 |
50.0 |
54.0 |
55.3 |
59.7 |
59.4 |
59.1 |
64.6 |
68.2 |
74.2 |
|
Petroleum and coal products |
22.7 |
24.9 |
22.9 |
21.8 |
24.4 |
29.83 |
9.5 |
39.4 |
41.1 |
42.6 |
44.6 |
|
Rubber and miscellaneous plastic products |
19.0 |
19.7 |
18.6 |
20.8 |
19.3 |
21.6 |
24.7 |
26.6 |
26.7 |
29.3 |
29.8 |
|
Leather and leather products |
4.9 |
4.2 |
4.3 |
4.4 |
4.1 |
3.8 |
3.6 |
3.2 |
2.7 |
2.8 |
2.9 |
|
SOURCE: U.S. Department of Commerce, Bureau of Economic Analysis, Survey of Current Business, January 1991, Table 6, p. 34. |
|||||||||||
TABLE 1-4 Real Output by Industry as a Percentage of Total Gross National Producta
|
|
1978 |
1979 |
1980 |
1981 |
1982 |
1983 |
1984 |
1985 |
1986 |
1987 |
1988 |
|
Manufacturing |
22.30 |
22.31 |
21.11 |
20.89 |
21.30 |
20.56 |
21.49 |
21.53 |
21.60 |
22.85 |
23.05 |
|
Durable goods |
13.59 |
13.57 |
12.82 |
12.58 |
11.45 |
11.70 |
12.81 |
13.03 |
12.98 |
13.92 |
14.49 |
|
Lumber and wood products |
0.62 |
0.68 |
0.67 |
0.51 |
0.51 |
0.57 |
0.60 |
0.55 |
0.57 |
0.65 |
0.64 |
|
Furniture and fixtures |
0.36 |
0.34 |
0.33 |
0.31 |
0.30 |
0.32 |
0.33 |
0.33 |
0.32 |
0.34 |
0.31 |
|
Stone, clay, and glass |
0.75 |
0.74 |
0.67 |
0.62 |
0.57 |
0.60 |
0.61 |
0.61 |
0.61 |
0.67 |
0.63 |
|
Primary metal industries |
1.70 |
1.65 |
1.51 |
1.56 |
1.11 |
0.88 |
0.95 |
0.90 |
0.87 |
0.93 |
0.94 |
|
Fabricated metal products |
1.71 |
1.75 |
1.68 |
1.63 |
1.46 |
1.49 |
1.57 |
1.55 |
1.47 |
1.57 |
1.57 |
|
Machinery, except electrical |
2.60 |
2.68 |
2.70 |
2.76 |
2.53 |
2.59 |
3.02 |
3.43 |
3.48 |
3.78 |
4.24 |
|
Electrical and electronic equipment |
1.80 |
1.89 |
1.99 |
2.00 |
1.95 |
1.97 |
2.10 |
2.05 |
1.99 |
2.11 |
2.19 |
|
Motor vehicles and equipment |
1.87 |
1.62 |
1.10 |
1.07 |
0.93 |
1.15 |
1.35 |
1.39 |
1.25 |
1.25 |
1.28 |
|
Other transportation equipment |
1.12 |
1.14 |
1.17 |
1.02 |
1.02 |
1.15 |
1.18 |
1.17 |
1.34 |
1.49 |
1.51 |
|
Instruments and related products |
0.65 |
0.70 |
0.69 |
0.73 |
0.71 |
0.70 |
0.72 |
0.67 |
0.69 |
0.72 |
0.78 |
|
Miscellaneous manufacturing industries |
0.42 |
0.38 |
0.30 |
0.37 |
0.35 |
0.29 |
0.39 |
0.36 |
0.38 |
0.40 |
0.40 |
|
|
1978 |
1979 |
1980 |
1981 |
1982 |
1983 |
1984 |
1985 |
1986 |
1987 |
1988 |
|
Nondurable goods |
8.71 |
8.74 |
8.33 |
8.31 |
8.59 |
8.86 |
8.68 |
8.50 |
8.62 |
8.94 |
8.56 |
|
Food and kindred products |
1.82 |
1.86 |
1.88 |
1.81 |
1.94 |
1.91 |
1.77 |
1.79 |
1.76 |
1.79 |
1.68 |
|
Tobacco manufactures |
0.32 |
0.31 |
0.30 |
0.30 |
0.28 |
0.24 |
0.22 |
0.17 |
0.19 |
0.15 |
0.17 |
|
Textile mill products |
0.53 |
0.53 |
0.51 |
0.49 |
0.47 |
0.49 |
0.46 |
0.43 |
0.46 |
0.46 |
0.42 |
|
Apparel and other textiles |
0.69 |
0.67 |
0.66 |
0.62 |
0.59 |
0.61 |
0.58 |
0.56 |
0.56 |
0.61 |
0.58 |
|
Paper and allied products |
0.93 |
0.90 |
0.81 |
0.78 |
0.84 |
0.88 |
0.84 |
0.83 |
0.85 |
0.91 |
0.87 |
|
Printing and publishing |
1.16 |
1.16 |
1.17 |
1.19 |
1.21 |
1.21 |
1.17 |
1.17 |
1.16 |
1.17 |
1.13 |
|
Chemicals and allied products |
1.77 |
1.78 |
1.57 |
1.66 |
1.75 |
1.82 |
1.70 |
1.63 |
1.74 |
1.83 |
1.84 |
|
Petroleum and coal products |
0.73 |
0.78 |
0.72 |
0.67 |
0.77 |
0.91 |
1.13 |
1.09 |
1.16 |
1.15 |
1.11 |
|
Rubber and miscellaneous plastic products |
0.61 |
0.62 |
0.58 |
0.64 |
0.61 |
0.66 |
0.71 |
0.74 |
0.72 |
0.79 |
0.74 |
|
Leather and leather products |
0.16 |
0.13 |
0.13 |
0.13 |
0.13 |
0.12 |
0.10 |
0.08 |
0.07 |
0.08 |
0.07 |
|
a 1982 constant dollar basis. For GNP in 1982 constant dollars, see Table 1-3. SOURCE: Calculated from data contained in U.S. Department of Commerce, Bureau of Economic Analysis, Survey of Current Business, January 1991, Table 6, p. 34. |
|||||||||||
TABLE 1-5 Change in Real Output by Industry
|
|
Change (billion 1982 dollars) |
Change (percent) |
|
|
|
1978 |
1988 |
|
|
Gross National Product |
3,115.2 |
4,024.4 |
29.2 |
|
Domestic industries (Gross Domestic Product) |
3,073.0 |
3,996.3 |
30.5 |
|
Manufacturing |
694.7 |
927.5 |
33.5 |
|
Durable goods |
423.3 |
583.2 |
37.8 |
|
Lumber and wood products |
19.3 |
25.7 |
33.2 |
|
Furniture and fixtures |
11.1 |
12.3 |
10.8 |
|
Stone, clay, and glass products |
23.3 |
24.9 |
6.9 |
|
Primary metal industries |
52.8 |
37.9 |
-22.2 |
|
Fabricated metal products |
53.4 |
63.2 |
18.4 |
|
Machinery, except electrical |
80.9 |
170.5 |
110.8 |
|
Electrical and electronic equipment |
56.2 |
88.1 |
56.8 |
|
Motor vehicles and equipment |
58.1 |
51.7 |
-11.0 |
|
Other transportation equipment |
34.9 |
60.9 |
74.5 |
|
Instruments and related products |
20.3 |
31.5 |
55.2 |
|
Miscellaneous manufacturing industries |
13.0 |
16.1 |
23.8 |
|
Nondurable goods |
271.4 |
344.3 |
26.9 |
|
Food and kindred products |
56.6 |
67.8 |
19.8 |
|
Tobacco manufactures |
9.9 |
4.7 |
-52.5 |
|
Textile mill products |
16.6 |
16.8 |
1.2 |
|
Apparel and other textiles |
21.5 |
22.7 |
5.6 |
|
Paper and allied products |
28.9 |
34.9 |
20.8 |
|
Printing and publishing |
36.2 |
45.5 |
25.7 |
|
Chemicals and allied products |
55.1 |
74.2 |
34.7 |
|
Petroleum and coal products |
22.7 |
44.6 |
96.5 |
|
Rubber and miscellaneous plastic products |
19.0 |
29.8 |
56.9 |
|
Leather and leather products |
4.9 |
2.9 |
-40.8 |
|
SOURCE: Calculated from data contained in U.S. Department of Commerce, Bureau of Economic Analysis, Survey of Current Business, January 1991, Table 6, p. 34. |
|||
The indicators outlined above do not allow a precise determination of whether U.S. strengths in technology commercialization have declined relative to their earlier levels. Almost certainly, however, U.S. performance in these areas now is being challenged more strongly than ever before as a result of improvements in the capabilities of foreign firms. In some cases, we believe, problems in the United States reflect the failure of U.S. firms in mature industries to successfully exploit advanced technologies.
In the panel's judgment, obstacles to improvements in technology commercialization are closely linked to weaknesses in technology adoption. Anecdotal evidence suggests that even when U.S. firms adopt these technologies early in the production cycle, they encounter greater difficulties, relative to some foreign firms, in exploiting the potential of new process technologies to improve productivity and product quality.26 Especially in manufacturing process technologies, the limited data available suggest that U.S. firms lag behind some foreign competitors in the rate of adoption and the intensity of utilization of such technologies as computer-integrated manufacturing, numerically controlled machine tools, and robotics.27 This fact is especially true for small and medium-sized firms.
One study of U.S. metalworking factories found that only 10 percent of small plants used numerically controlled machines tools, far below the 83 percent of large plants that did so.28 An indication of the disparity in technology adoption between large manufacturers and small or medium-sized ones is the apparent gap in the United States between ''best-practice'' and "average-practice" firms.29 Thus U.S. technological performance is challenged less in the creation of new technologies than in their commercialization and adoption. Over the longer term, however, the ability of this nation to sustain high levels of investment (from public and private sources) in the scientific enterprise will be affected heavily by the overall performance of the U.S. economy.
Data on U.S. and foreign performance in the commercialization of technologies are difficult to obtain. As the discussion above indicates, many U.S. firms, individuals, and universities are very successful producers of new inventions on which commercial innovations are based. Nevertheless, recent reports by expert committees have expressed concern over U.S. performance in technology commercialization.30 In products such as semiconductor memory components, U.S. firms' early mastery of the product and process technology, links to advanced university research, and early dominance of the market did not translate into sustained competitive strength in these products, although the United States continues to exhibit strength in many advanced semiconductor products. Some companies in the automobile, consumer electronics, steel, and other industries have faced problems
similar to those in the semiconductor industry.31 In many cases, U.S. firms have demonstrated weaknesses in their ability to maintain strength in the "complementary" skills and assets needed to sustain a competitive advantage, most notably by failing to maintain state-of-the-art manufacturing technologies.
There is another set of clearly identifiable problems apparent in U.S. industry, which should not be confused with the commercialization of product and process technology. These weaknesses are directly related to design for manufacturability, quality, just-in-time inventory control, and manufacturing process capacities, and to relationships between firms and suppliers. They are often associated with the technology adoption process outlined above. Some U.S. firms have also failed to compete successfully in "cyclical" innovation processes, moving too slowly to incorporate new technologies into improved versions of established products.32
The primary responsibility for making improvements in increasing quality, building more productive relationships with suppliers and vendors, and improving design for manufacturability rests with the private sector. These areas are not associated with advanced technology creation or pre-commercial R&D work, the major focus of this report. They need to be recognized, however, as an important part of any program to improve U.S. economic performance.
This report centers on methods to strengthen the U.S. capacity in technology beyond basic research, in particular the federal role in supporting technological advance in pre-commercial areas. The recommendations for change are based on the conclusion that we can leverage U.S. strengths in research to compete even more vigorously in international markets, but only with higher levels of investment (through both public and private funding) in work that eventually leads to more rapid technology commercialization rates in U.S. industry.
Innovation is a continuum, with feedback among all stages in the process, from technology creation through to the commercialization and adoption of new technologies. It should be recognized as such. Higher levels of investment in the critical pre-commercial stage of technology development will enhance U.S. performance in technology commercialization over the long-term. To a significant degree, the postwar advantages of the United States in the research and technology creation processes have been supported (indeed, some would say that they were created) by federal policy. As noted below, however, the postwar focus of federal policy requires change. We now turn to a brief overview of the central components of this policy structure and a discussion of the changes in the economic and technological environment that have weakened its economic payoffs.
THE STRUCTURE OF POSTWAR U.S. SCIENCE AND TECHNOLOGY POLICY
The key elements of federal science and technology policy arose during World War II and the following Cold War period.33 In general, this policy framework is characterized by loose coordination among R&D investment and other activities of a large number of federal agencies. Neither the executive nor the congressional branch of the federal government reviews the allocation, costs, and benefits of the entire federal R&D budget on a regular basis. The interaction between science and technology policies and other policy areas (e.g., antitrust and trade) also is rarely reviewed on any but a sporadic basis.
Other key characteristics of postwar U.S. technology policy and the U.S. innovation system that differentiate the United States from most industrialized economies include the following:34
-
Dominance of the large federal R&D budget by defense and related agencies: Throughout the postwar period, federal funds have accounted for a large share (between 45 and 60 percent) of total national R&D spending. The federal R&D budget has in turn been dominated by defense-related expenditures, whose effects on commercial technologies and the firms marketing them were accentuated during the 1950s and 1960s by large-scale military procurement of components and systems in areas such as computers and microelectronics. In some instances, the combined effects of "spillovers" and military procurement policy supported the development of commercial applications.
-
The prominent role of U.S. universities as performers of research, especially basic research, most of which is funded from federal sources: A large share of the basic research performed in the United States, more than 50 percent in recent years, is carried out in universities. In the United States, universities account for a larger share of total national R&D performance than in Western Europe or Japan, although direct comparisons of what each nation defines as research and development are difficult.
-
Minimal assistance for industrial technology adoption: With the significant exception of agriculture, the large federal investment in military and civilian research and technology development provides virtually no support for the adoption of new technologies. In this respect, as Ergas has pointed out,35 postwar U.S. policy resembles that of France and the United Kingdom, both of which supported large defense-related R&D budgets, and contrasts with the policies of Germany, Sweden, and Japan, where a larger investment of public resources was directed to facilitating technology adoption.
Current U.S. technology policy relies primarily on federal funding of scientific research, especially basic research. It also includes an emphasis on funding of applied research and development in defense, nuclear power, and space-related technologies. The postwar policy of the United States is also differentiated from that of many other industrial economies by the prominent role federal procurement policies have played in the development of the defense, telecommunications, and transportation sectors, among others.
The resulting system for the creation, commercialization, and adoption of new technologies is diverse in terms of funding sources, performers, and objectives. It also links scientific research more closely to postgraduate education than is true of other industrial economies. In addition, the U.S. technological system is affected (as are other nations') by the structure of financial markets, firm size and ownership, and corporate management and oversight. There are significant differences between the United States and other industrialized countries in these areas, as well.
There are many new challenges to national technology performance, as based on the framework outlined above. These developments have intensified international competition, while at the same time creating new opportunities for U.S. firms to sell goods and services in an increasingly large global market. In our judgment, this new environment may have also reduced the economic payoffs to U.S. firms and citizens from the large federal investment in R&D. This is true even though research investment benefits both the United States and other nations, and any restriction on the diffusion of scientific research is a potentially costly and dangerous exercise.
The globalization of formerly national technical enterprises, dispersion of corporate R&D and manufacturing facilities, rising costs of R&D efforts, and shortened time horizons for the introduction of new products and processes all create special challenges for U.S. firms. Important changes in the global economy over the past two decades are related to the growth of world trade and its increased importance to U.S. industry. The growth of international trade has produced significant economic benefits to the United States through rising levels of income as the nation specializes in producing goods and services in which it enjoys a comparative advantage. International trade has doubled as a share of U.S. GNP over the past two decades, with imports rising to about 15 percent of total GNP and exports to 12 percent.
Merchandise imports have grown over the past decade with the rapid expansion of domestic spending relative to GNP, increasing about 100 percent between 1980 and 1990 from $253 billion to $518 billion. In 1982 constant dollars, exports have risen at an even more rapid rate. From 1980 to 1990, for example, U.S. merchandise exports alone grew by about 75 percent, from $241 billion to $424 billion.36 Moreover, export expansion
over the past five years (1986–1991) has accounted for 37 percent of U.S. growth (real) in GDP.37
The growth of international trade, as well as the increased pace at which capital and technology move across national borders, poses significant challenges to U.S. industry. U.S. manufacturers now compete with technologically sophisticated foreign firms in an international marketplace—at home as well as abroad. This is happening even as U.S. exports depend more than ever on R&D-intensive goods for further export expansion and as competitors challenge the United States in several important high-technology sectors. No longer can U.S. firms rely on producing solely for the domestic market. The world economy now represents a total global demand for goods and services that is four times greater than U.S. domestic demand.
The rising technological competence of foreign firms is one reason the rate of technology diffusion across international boundaries has increased. Some foreign firms are better able to absorb technology from multiple sources, and transnational corporations continue to establish R&D and manufacturing facilities around the world. Technology that was once appropriable (able to be used exclusively) by the innovator in one country is now transferred and diffused throughout the global economy with much greater ease.
Part of the trend toward globalization of economic and industrial activity is evident in the dispersion of transnational corporate R&D and manufacturing facilities. Companies have decentralized technology development assets in response to intensified international competition and the expansion of international opportunity. IBM, Texas Instruments, and Motorola have established facilities in Japan and Europe, for example, whereas Sony, NEC, and Philips have established operations in the United States. The number of R&D laboratories located outside a corporation's home base has grown substantially. Through investment and acquisitions in foreign firms, companies have expanded facilities overseas to strengthen the integration of product development, design, and marketing capabilities.38
The increasingly international character of research and innovation has evolved for many reasons. In part, this has taken place in response to the need to locate operations close to foreign markets and to reduce market-specific product development and manufacturing times as product life cycles shorten. In some cases, protectionist trade or technology policies have contributed to the location of R&D facilities outside the borders of a corporation's home base. The homogenization of world demand, especially with regard to technologically advanced products, has also shaped corporate decisions on the location of facilities overseas. Finally, advances in technology itself, including less costly and more advanced telecommunications and transportation systems, among others, have moved the world toward closer
integration. All of these factors have heightened international competition and complicated U.S. industry's R&D and commercialization efforts.
Another dimension of the changing environment for technology development is the rising cost of R&D and product development in a number of key technology-intensive industries. Over the past two decades, the costs of bringing new products and processes to market have risen sharply in the commercial aircraft, semiconductor, computer, and telecommunications industries. For example, it is estimated that a 4-megabyte (Mb) Dynamic Random Access Memory (DRAM) semiconductor production facility costs in excess of $400 million, not including the expenses associated with product development. For a 16-Mb production facility, the costs rise to an estimated $700 million, with product development adding another $300 million.39 Rising costs not only have contributed to the increased importance of export markets but have also encouraged the formation of cooperative R&D ventures.
Costs for R&D and commercialization efforts in many technology-intensive sectors have risen for many reasons. In part, this is due to the fact that firms often need to incorporate expertise in multiple fields into their R&D efforts. The rapid rate of technical change in many R&D areas puts added financial pressure on firms that require long lead times to develop products. For example, technology integration in the computer and telecommunications sectors and biotechnology processes as applied in new drug development mean that companies now must possess the capabilities to incorporate scientific and technical advances in a wide range of technical disciplines. Firms must invest funds in plant and equipment that often quickly become obsolete, and they are forced to capture returns on investment in R&D and capital equipment over shorter payback periods.
Another characteristic of the new technological environment is the growth in technical alliances between firms. Technology cooperation now extends beyond the sharing of technical information or joint production agreements. It increasingly involves joint research and development projects. These projects often form an important part of corporate strategic planning in the microelectronics, aviation, and telecommunications sectors, for example. Technical alliances also are increasingly being forged across national boundaries. In part, this makes it much more damaging to establish a strictly national or "self-sufficient" approach toward technology development.
Moreover, military-funded R&D and defense procurement are becoming less important sources of civilian technology. The celebrated examples of semiconductors, computers, jet engines, and airframes in the 1950s and 1960s, technologies in which military R&D and procurement yielded important civilian applications, have few contemporary counterparts. Military procurement has declined as a share of total demand in many sectors. Tech-
nologies and applications now increasingly flow from the civilian to the military sector. This change in technology flow has an important economic component. Some U.S. defense suppliers of high-technology components or systems are now economically dependent on their success in civilian markets.40
Postwar federal science and technology policies were not designed primarily to aid the capabilities of U.S. firms to commercialize new civilian technologies.41 Nevertheless, U.S. firms benefitted from the large federal R&D investment because of the relatively slow pace with which the results of this investment moved across international boundaries. Even when such movement occurred, many foreign firms were not well equipped to use these results quickly in commercial applications. These conditions do not apply today. Scientific and technological knowledge move more quickly in the international economy because foreign firms have improved their capabilities to absorb R&D and technology. They are also better able to apply advanced scientific or technological knowledge to the manufacturing process. In addition, as R&D costs and risks increase, access to foreign markets is increasingly important to the viability of U.S. high-technology firms. This is true even as these firms, in many instances, now derive a larger share of their components or advanced subassemblies from foreign sources.
Economic and technological advancement in Japan and Germany, among other countries, has improved rapidly compared to the post-World War II era. Other nations that have not been considered among the front rank of international competitors have proved to be strong exporters in specific markets. Data on the number of scientists and engineers engaged in R&D overseas also indicate the strength and growing capacity of other nations.42 The per capita level of scientists and engineers working on R&D-related activities in Japan and Europe is reaching U.S. levels. In 1965, Japan had approximately 24 scientists and engineers engaged in R&D work per 10,000 people in the labor force. By 1986, there were 67.4 Japanese scientists and engineers per 10,000 workers, approximately equal to the concentration of R&D scientists and engineers in the United States. As Japan and other nations make progress in providing training and high-value-added employment opportunities for scientists and engineers, they will become even more able competitors.
Productivity growth rates in manufacturing also attest to the improved base upon which the capacity to generate and commercialize new products and processes in other nations is being constructed. Table 1-6 shows output per hour for manufacturing in 14 countries. In Japan, manufacturing productivity has risen sharply since 1960. From 1960 to 1989, the average annual growth rate was 7.6 percent; in the United States, growth averaged 2.9 percent during the same period. Japanese manufacturing productivity
TABLE 1-6 Average Annual Rates of Change in Manufacturing Output per Hour
|
Country |
1960-1989 |
1960-1973 |
1973-1989 |
1973-1979 |
1979-1989 |
1979-1987 |
1988 |
1989 |
|
United States |
2.9 |
3.3 |
2.6 |
1.6 |
3.2 |
3.4 |
2.3 |
2.0 |
|
Canada |
3.1 |
4.5 |
1.9 |
2.1 |
1.8 |
1.7 |
1.7 |
2.2 |
|
Japan |
7.6 |
10.3 |
5.5 |
5.5 |
5.5 |
5.5 |
4.7 |
5.8 |
|
Korea |
NA |
NA |
NA |
NA |
NA |
NA |
NA |
NA |
|
Taiwan |
NA |
NA |
NA |
NA |
NA |
NA |
NA |
NA |
|
Belgium |
6.2 |
6.9 |
5.5 |
6.0 |
5.1 |
5.2 |
4.9 |
NA |
|
Denmark |
4.2 |
6.4 |
2.4 |
4.2 |
1.4 |
1.0 |
3.2 |
3.0 |
|
France |
5.0 |
6.4 |
3.8 |
4.6 |
3.4 |
3.0 |
5.1 |
4.7 |
|
Germany |
4.1 |
5.7 |
2.8 |
4.2 |
2.0 |
1.4 |
4.5 |
4.5 |
|
Italy |
5.4 |
6.4 |
4.6 |
5.7 |
4.0 |
4.2 |
2.8 |
2.9 |
|
Netherlands |
5.7 |
7.3 |
4.3 |
5.4 |
3.7 |
3.4 |
4.6 |
4.5 |
|
Norway |
3.6 |
4.7 |
2.7 |
2.1 |
3.0 |
2.6 |
2.9 |
6.4 |
|
Sweden |
4.2 |
6.4 |
2.4 |
2.6 |
2.2 |
2.4 |
1.4 |
1.6 |
|
United Kingdom |
3.8 |
4.2 |
3.4 |
1.2 |
4.8 |
4.7 |
5.4 |
5.1 |
|
SOURCE: Bureau of Labor Statistics. |
||||||||
growth (5.5 percent) also exceeded that of the United States (3.4 percent) between 1979 and 1987. Productivity in Italy and the United Kingdom in the 1980s also rose at a faster rate than it did in the United States.
Rising receipts and payments for patents and technical knowledge also indicate improvements in the technological strength of other nations. Data on royalties and fees are one indication of the global demand for a country's technology and intellectual property. They include payments for product and process inventions, copyrights, and other rights to use technology generated elsewhere. Table 1-7 shows U.S. receipts and payments (royalties and fees), over the period 1972 to 1988, from Japan, the United Kingdom, and Germany. The United States continues to exhibit considerable strength in technology output, based on this indicator.
Japan, in contrast, continues to be a net importer of technology. It has improved its ability to generate technological output, however, as evidenced in the data on royalties and fees for domestically generated technology. Receipts as a share of payments in Japan more than doubled, from 14 to 30 percent of the total, from 1970 to 1985. The United States has been increasing its payments to Japan through royalties and fees. In 1972 the United States made $6 million in yearly payments of royalties and fees to Japan. By 1988 the figure had risen to $112 million.43
It is important to note that improvement in the technological and com-
TABLE 1-7 U.S. Receipts and Payments of Royalties and Fees Associated with Unaffiliated Foreign Residents, 1972-1988 (millions of dollars)
|
Year |
All Countries |
West Germany |
United Kingdom |
Japan |
|
Receipts |
|
|
|
|
|
1972 |
655 |
56 |
63 |
240 |
|
1973 |
712 |
63 |
75 |
273 |
|
1974 |
751 |
78 |
71 |
249 |
|
1975 |
757 |
81 |
79 |
219 |
|
1976 |
822 |
83 |
72 |
246 |
|
1977 |
1,037 |
92 |
82 |
275 |
|
1978 |
1,180 |
119 |
93 |
343 |
|
1979 |
1,204 |
109 |
102 |
343 |
|
1980 |
1,305 |
145 |
113 |
403 |
|
1981 |
1,490 |
101 |
119 |
423 |
|
1982 |
1,669 |
105 |
122 |
502 |
|
1983 |
1,679 |
136 |
134 |
523 |
|
1984 |
1,709 |
127 |
133 |
549 |
|
1985 |
1,899 |
112 |
126 |
606 |
|
1986 |
1,842 |
114 |
112 |
679 |
|
1987 |
2,170 |
135 |
111 |
875 |
|
1988 |
2,416 |
126 |
127 |
1,016 |
|
Payments |
|
|
|
|
|
1972 |
139 |
29 |
44 |
6 |
|
1973 |
176 |
37 |
53 |
13 |
|
1974 |
186 |
34 |
67 |
12 |
|
1975 |
186 |
32 |
76 |
9 |
|
1976 |
189 |
34 |
77 |
13 |
|
1977 |
262 |
31 |
72 |
16 |
|
1978 |
277 |
27 |
84 |
15 |
|
1979 |
309 |
40 |
93 |
15 |
|
1980 |
297 |
61 |
96 |
20 |
|
1981 |
289 |
43 |
99 |
37 |
|
1982 |
292 |
35 |
94 |
31 |
|
1983 |
318 |
35 |
90 |
53 |
|
1984 |
359 |
59 |
85 |
63 |
|
1985 |
425 |
47 |
123 |
66 |
|
1986 |
460 |
87 |
76 |
113 |
|
1987 |
522 |
108 |
97 |
104 |
|
1988 |
1,080 |
131 |
143 |
112 |
|
Year |
All Countries |
West Germany |
United Kingdom |
Japan |
|
Balance |
|
|
|
|
|
1972 |
516 |
27 |
19 |
234 |
|
1973 |
536 |
26 |
22 |
260 |
|
1974 |
565 |
44 |
4 |
237 |
|
1975 |
571 |
49 |
3 |
210 |
|
1976 |
633 |
49 |
(5) |
233 |
|
1977 |
775 |
61 |
10 |
259 |
|
1978 |
903 |
92 |
9 |
328 |
|
1979 |
895 |
69 |
9 |
328 |
|
1980 |
1,008 |
84 |
17 |
383 |
|
1981 |
1,201 |
58 |
20 |
386 |
|
1982 |
1,377 |
70 |
28 |
471 |
|
1983 |
1,361 |
101 |
44 |
470 |
|
1984 |
1,350 |
68 |
48 |
486 |
|
1985 |
1,474 |
65 |
3 |
540 |
|
1986 |
1,382 |
27 |
36 |
519 |
|
1987 |
1,648 |
27 |
14 |
750 |
|
1988 |
1,336 |
(5) |
(16) |
904 |
|
SOURCE: U.S. Department of Commerce, Bureau of Economic Analysis data, as reported in International Science and Technology Data Update: 1991, National Science Foundation, Special Report, NSF 91-309, p. 117. |
||||
petitive capabilities of foreign firms is by no means a negative development. Indeed, by improving the quality of products and processes available to U.S. consumers (which include U.S. industrial firms that utilize foreign-source technologies and components), this development will improve U.S. standards of living, not erode them. As incomes rise overseas with increased technical, manufacturing, and export competence, aggregate levels of income in the United States rise, and demand for the nation's goods and services also increase. Moreover, rising standards of living overseas reflect the success of postwar U.S. policies that supported reconstruction and economic development. The U.S. economy benefits from innovations wherever they are generated. If, however, we can devise policies and programs that serve to improve U.S. performance, our standards of living will benefit more than if we do not act. Moreover, if the nation's capacity to commercialize and market goods and services (particularly high-technology manufactures) is improved from its current performance, it will benefit the economy over the long-term.
In sum, the developments in recent years that, in the panel's view, form a basis for carefully reviewing federal policy toward civilian technologies are (1) the increased exposure of U.S. firms to more intense international competition from more capable foreign firms, as well as their expanded opportunities in foreign markets; and (2) some decline in the ability of U.S. firms to derive economic benefits from the large federal investment in basic and defense-related R&D. These developments may, we believe, have reduced the technological lead of U.S. firms in terms of their ability to apply and adopt new technologies. These developments also may have increased the difficulties faced by U.S. firms in capturing high returns on investments in technology creation and commercialization.
OTHER POLICY ISSUES
A central theme of this report is the need to recognize the breadth of the array of policies and factors that influence technological performance. Many of these policies lie outside the group of instruments typically associated with science and technology policy. For example, capital requirements of technology creation, commercialization, and adoption are such that the domestic economic environment for capital formation is an important influence on technological performance. A cost of capital to U.S. firms that greatly exceeds the cost faced by foreign competitors would, over time, have a significant influence on investment decisions. These in turn will affect the processes of technology creation (through diminished expenditures on research, the returns from which may not be realized for many years), commercialization (reduced expenditures on development, plant, and equipment, etc.), and adoption (reduced investments in capital goods that embody new technologies).
To the extent that the cost of capital facing U.S. corporations may now exceed costs overseas (a point on which there is currently a lack of consensus), it suggests differences between the United States and other countries in a number of areas, including interest rates, tax structures, and operation of financial markets. A detailed examination of these factors is beyond the scope of this report; however, the apparent short-term focus of U.S. managers on investments in physical capital and R&D (whatever its causes) is a central concern.44 Moreover, for the recommendations of this panel to have any impact, U.S. firms must improve their management of technological assets. In the context of current public policies, U.S. managers have, in some cases, failed to manage these resources carefully or effectively. In other instances, they have failed to respond adequately to international competition and have been inattentive to technological and scientific advances not invented in their own firms. In addition, internal compensation and incentive practices have rarely rewarded managers who pursued careers in engi-
neering design and production. Compensation is greatest for those in marketing, finance, and even research and development.
Given the current environment in which managers operate, they should seek to create an atmosphere within their firms that supports long-term investment. Investments should focus on R&D, improving manufacturing performance, and enhancing employee skills. Senior managers of U.S. firms can no longer assume that they can compete in today's global economy without a deep understanding of the technological strengths, weaknesses, and needs of their firms, as well as domestic and foreign competitors. Management and engineering schools in the United States must also improve their performance in educating students on technology management and manufacturing issues.
Another area in which U.S. public policy and private investment decisions appear to be handicapping its technological performance is investment in the skills of the work force. This is true for both those entering the labor force and workers currently employed (or displaced). The U.S. higher education system remains strong, despite growing financial pressures on U.S. universities. The same cannot be said, however, of U.S. public primary and secondary education. The U.S. system appears to perform less well than educational systems in other industrial and some industrializing economies, particularly in equipping entrants to the work force with basic abilities in literacy, numeracy, science, and mathematics.
Job-related proficiency in many industries now centers on these abilities. In addition, they are often the foundation necessary for workers to make the transition to new jobs or to work with new technologies. The public and private institutions that support the transition from secondary school to the workplace in the U.S. economy are unequal, we believe, to the task. Programs to improve the skills of the employed work force and workers facing displacement also are considerably weaker in the United States than in Japan and Germany.45 In Japan, the central government and industrial firms emphasize programs that encourage all new engineers to begin training cycles on the shop floor. In Germany, apprentice systems allow workers to move into higher skill-based jobs, and the federal government supports the training of technicians. Both countries have undoubtedly benefitted from these and other efforts to enhance work force skills and training.
Improvements in U.S. technological performance will require steps by the private sector and by federal, state, and local governments to improve public primary and secondary education, with a strong emphasis on basic skills—literacy and numeracy. Investment in the skills of the employed work force, and investment in retraining the unemployed or imminently unemployed worker, are also important to the long-term technological performance of U.S. firms.
A final area in which public agencies carry an especially significant burden is in the provision of the physical infrastructure necessary to support highly productive economic activities. Here, too, the performance of federal, state, and local governments in recent years has been poor. Data on trends in U.S. investment in infrastructure show declining rates of investment during the 1970s and 1980s, relative to past decades. Not only has the rate of growth in the value of capital stock declined, particularly in the nonmilitary sector, but recent assessments show a reduced federal role in investments in infrastructure. From 1960 to 1987, federal support for capital investments, operations, and maintenance in infrastructure fell from 31 to 24 percent of total federal government expenditures.46 During the same period, the proportion of all government spending in the United States (federal, state, and local) allocated to public works projects in infrastructure fell from 12 to 7 percent.
Evidence for a relationship between investment in infrastructure and economic development is both intuitive and analytical. Moreover, the relationship is an interactive one—slower productivity growth implies slower growth in national income and reduced rates of growth in public revenues to support these expenditures. It seems evident that the growth of industry sectors such as automobiles and air transportation rested in large part on massive public investments in highways, airports, and air safety. Conversely, crumbling roads, collapsed bridges, and congested airports today seem to threaten afflicted regions with economic disruption. The panel supports efforts to increase levels of investment in the physical infrastructure of the U.S. economy.
SUMMARY AND CONCLUSIONS
The poor U.S. performance in improving measured productivity growth rates is a central cause for concern. This is particularly true when considering the economic environment for technology development in the United States. As we have seen, investment in physical capital and civilian research and development are important components of strong productivity growth rates. These are areas to which we must devote greater attention in the future. In addition, we have found that the innovative capacity of the United States through the development stage has remained strong relative to the nation's performance over the past several decades. There are many indications of continuing U.S. strengths as they relate to innovation and technology development, including a strong university system and basic research enterprise, U.S. dominance in generating technologies with potential commercial value, and strong real rates of growth in output of the manufacturing sector.
Nonetheless, the economic and technological challenge posed by our
major competitors has increased dramatically over the past two decades. U.S. firms can improve their performance in moving technology into the now global commercial marketplace (technology commercialization), where they face this challenge, and speed the transfer and adoption of new technologies throughout the economy. Federal government policy can affect industrial performance in these areas.
In addition, problems associated with design for manufacturability, incremental improvements in product and process technology, relations between suppliers and customers, and quality control require attention. These problems have little to do with the commercialization of new, innovative technologies, but progress in raising U.S. performance in these areas is critical to long-term economic advance. The time required to go from product design to commercialization in some important U.S. industries significantly exceeds that of foreign competitors, for example. The new competitive environment for technology development means that continuous improvements by U.S. firms in manufacturing process technology will be necessary. Progress here remains primarily a private sector responsibility.
The panel believes, however, that modifications in federal technology policies can also strengthen national performance in civilian technology and enhance long-term economic growth. The U.S. performance (relative to its past) in technology is being challenged more strongly than ever before in the postwar period. The United States can strengthen technology commercialization, at a stage prior to that at which private firms invest in commercialization activities, through federal action to facilitate pre-commercial R&D. There is a legitimate federal role in this area. The science and technology enterprise is not characterized by a linear model of development, as we have seen. It is an intense, interactive process whereby investment in pre-commercial activities can help promote commercialization and thereby support productivity growth. The United States can construct a technology policy (and design a program) that avoids direct subsidies for firms and industries, while at the same time supporting and leveraging U.S. comparative advantages in technological innovation.
NOTES


