
2
Current U.S. Data Systems
Information on U.S. international capital flows is published on a quarterly basis in the U.S. international transaction accounts (commonly referred to as the U.S. balance-of-payments accounts), along with data on U.S. merchandise trade, international services transactions, investment incomes (and payments), and unilateral transfers.1 The balance-of-payments accounts represent a summary statistical statement of transactions in goods, services, incomes, unilateral transfers, and capital flows between U.S. residents and nonresidents (foreigners) during a given period. Residents and nonresidents are distinguished by geographical boundaries.2
This chapter discusses concepts underlying the balance-of-payments accounts, describes the methods used to collect data on U.S. international capital transactions and the major sources of
the published information. Its purpose is twofold: to set the stage for the analysis in Chapter 3 and to note the use of the information required of data filers and how it is compiled into national statistics. In its survey of filers and users of currently required data, the panel found that filers were not familiar with the purposes of the data required of them and that users were uncertain about the quality of the published data. In addition, data filers and, to a certain extent, data users were not fully aware of the various published sources of information on U.S. international capital transactions (see Appendix B). The panel believes that accurate knowledge of the system will encourage accurate and timely reporting by filers and will enhance users' knowledge of the availability of the data and an understanding of its limitations.
BALANCE-OF-PAYMENTS FRAMEWORK: CONCEPTS AND USES
The basic assumption underlying the balance-of-payments framework is that receipts equal payments. Just as, in business accounting, debits equal credits, the same principle applies to the transactions of a nation. By definition, total receipts on current account items are necessarily equal to current account payments plus the net increase in claims on foreigners. The current account of the U.S. balance of payments covers exports and imports of goods and services, unilateral transfers, and incomes on investment, while the capital account records financial transactions. Data for these accounts for 1990-1993 are shown in Table 2-1. The Bureau of Economic Analysis (BEA) of the Department of Commerce is responsible for the compilation of the U.S. balance-of-payments accounts.
In principle, the balance of the current account equals that of the capital account because the underlying framework is the double-entry accounting concept. Under this concept, it is assumed that when merchandise is exported (a credit), the exporter receives a payment either in a foreign bank (a capital outflow debit) or in a domestic bank (a debit as a foreign account is drawn down) or extends credit to the importer (a capital outflow debit). It is an accounting convention that an export is treated as a credit or a plus entry; an import, a debit, is represented by a minus entry. For financial transactions, decreases in an economy's foreign assets or increases in an economy's foreign liabilities are treated as credit entries. Conversely, debit entries reflect increases in for-
TABLE 2-1 U.S. International Transactions, Current and Capital Accounts, 1990-1993 (in millions of dollars)
|
Category |
1990 |
1991 |
1992 |
1993 |
|
Current account |
||||
|
Exports of goods, services, and income |
696,841 |
717,041 |
731,373 |
755,533 |
|
Merchandise |
389,303 |
416,913 |
440,361 |
456,866 |
|
Services |
147,239 |
163,215 |
176,563 |
184,811 |
|
Income |
160,300 |
136,914 |
114,449 |
113,856 |
|
Imports of goods, services, and income |
-754,926 |
-730,680 |
-767,217 |
-827,312 |
|
Merchandise |
-498,336 |
-490,981 |
-536,458 |
-589,441 |
|
Services |
-117,016 |
-117,618 |
-120,850 |
-127,961 |
|
Income |
-139,574 |
-122,081 |
-109,909 |
-109,910 |
|
Unilateral transfers (excluding military grants of goods and services, net) |
-33,663 |
6,687 |
-32,042 |
-32,117 |
|
Current account balance |
-91,748 |
-6,952 |
-67,886 |
-103,896 |
|
Capital account |
||||
|
U.S. assets abroad, net |
-70,363 |
-51,512 |
-61,510 |
-147,898 |
|
U.S. official reserve assets |
-2,158 |
5,763 |
3,901 |
-1,379 |
|
U.S. government assets other than official reserve assets |
2,307 |
2,900 |
-1,652 |
-306 |
|
U.S. private assets |
-70,512 |
-60,175 |
-63,759 |
-146,213 |
|
Foreign assets in the U.S., net |
122,192 |
98,134 |
146,504 |
230,698 |
|
Foreign official assets in the U.S. |
33,910 |
17,199 |
40,858 |
71,681 |
|
Other foreign assets in the U.S. |
88,282 |
80,935 |
105,646 |
159,017 |
|
Capital account balance |
51,829 |
46,622 |
84,994 |
82,800 |
|
Statistical discrepancy |
39,919 |
-39,670 |
-17,108 |
21,096 |
|
SOURCE: Data from Bureau of Economic Analysis (1994a:94-95). |
||||
eign assets or decreases in foreign liabilities. This concept is useful because people want to know both the size of the trade balance and how it is financed. Or they want to know why a country is gaining or losing official reserves.
Under the double-entry concept, the sum of all transactions should be zero: both sides of each transaction should offset one another and the balance of the current account should equal that of the capital account, with opposite signs. However, unlike the internal consistency of ordinary business accounts, the compilers of the balance-of-payment accounts must gather information from a variety of independent sources: merchandise trade is based on
customs data, and the entries in banking or other financial accounts are derived from a variety of sources. Since the data or estimates used are from diverse sources, they usually cannot be reconciled exactly, leading to a balancing item representing the net errors or omissions, denoted as ''statistical discrepancy" in the accounts. The statistical discrepancy represents only the arithmetical difference between the balances of the current and the capital accounts; it does not reflect the gross errors and omissions of the different types of transactions, which may be larger than the statistical discrepancy. Gross errors and omissions in different accounts may offset one another.
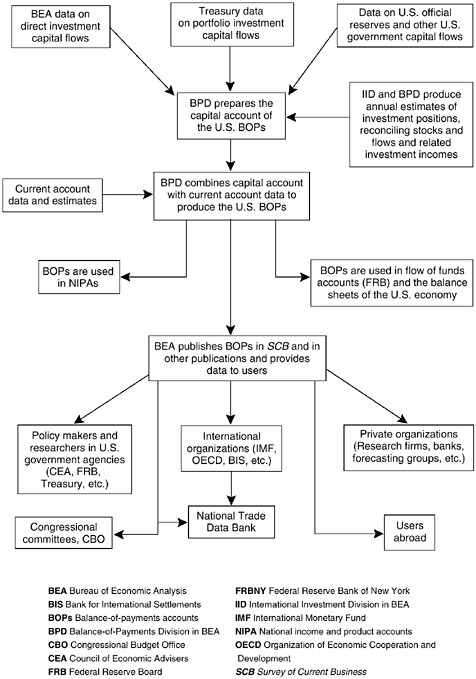
An important purpose of the balance-of-payments data is to provide information needed to understand the impact of the external sector on the domestic economy. The balance-of-payments data form a key component of the national accounts, which also include the national income and product accounts (NIPA) compiled by BEA, and the flow-of-funds accounts and the balance sheets of the U.S. economy, both prepared by the Federal Reserve. The balance-of-payments data enter into these other components of the accounts; Figure 2-1 shows the sources and uses of the balance-of-payments data.
The NIPA measures the production, distribution, and use of output in the United States by four economic groups: persons, business, government, and "the rest of the world." It would be impossible to have a complete set of NIPA for an open economy without taking account of net exports and their composition. Exports of goods and services are part of the gross domestic product (GDP). Imports are part of consumer expenditures, gross domestic investment, and the other components of gross national expenditure. The difference between a nation's saving and its investment has to include net foreign investment (positive or negative) to be complete.3 During the past decade, for example, the United States financed an important part of its federal budget deficit by incurring a current account deficit, which showed up, cumulatively, as a reduction in net foreign assets. This development is reflected in the balance-of-payments accounts.4
The flow-of-funds accounts detail the sources and uses of savings in the U.S. economy by sector and by type of transaction. They are useful in assessing the effect of monetary policy and the general financial conditions of various domestic sectors. The balance sheets of the U.S. economy show the assets and liabilities of the country. These data, together with other information gathered for regulatory purposes, are used in monitoring the safety and soundness of U.S. financial systems.
Another use of the balance-of-payments data is to show the external financial position of the nation as reflected in its net foreign investment position and how this position is changing over time. If the United States is increasingly becoming a net debtor to the rest of the world, that has implications for the welfare of future generations. Similarly, the trends of trade and capital flows, as displayed by the current and the capital account data over time, are intended to guide assessments about the nation's foreign exchange rate, whether the rate is likely to change or should be changed, and whether the country's external trade imbalance can be sustained.
BEA publishes U.S. balance-of-payments data quarterly in its Survey of Current Business. Figure 2-2 (box) lists selected publications prepared by BEA on U.S. international transactions.
In addition to providing an important data source for the preparation of the national accounts, various components of the U.S. balance of payments are used by both the public and the private sectors, as well as by international organizations and abroad. Researchers and policy analysts extensively use the direct investment data collected by BEA, as well as other available data sources, in their analysis of the effects of foreign direct investment in the United States on U.S. production and employment and the competitiveness of U.S. firms in global markets. Data on international transactions in U.S. and foreign securities, as well as other
available data sources, inform market research. Data on short-and long-term international capital transactions, by country, are examined to assess market pressures and determine worldwide capital flows. Data on cross-border deposits are analyzed to determine their significance for implementation of monetary policy. The data are also reviewed to assess the long-term sustainability of the U.S. external imbalances and their relationship to domestic saving and investment. In short, the balance-of-payments data are used in both the public and private sectors to analyze the nation's short-term external payment imbalances, its longer term structural finance, exchange rate movements, and sources of credit and liquidity creation, among others.
The statistical discrepancy in the U.S. balance-of-payments accounts grew significantly during the 1970s and 1980s, both in absolute and relative terms. It was also marked by large fluctuations; see Figure 2-3: it surged from a cumulative total of -$5.5 billion for 1960-1969 to +$36.9 billion for 1970-1979 and to +$221.6 billion for 1980-1989. In 1989 alone, the statistical discrepancy was +53.1 billion, or more than 8 percent of exports plus investment income. In 1992 and 1993 however, the discrepancy dropped to between 2 and 3 percent of exports plus investment income.
The striking difference in the magnitudes, variations, and trends between the statistical discrepancy before and after the early 1970s suggests that the net errors and omissions in the U.S. balance-of-payments accounts since the early 1970s have not resulted largely from random events. In its report (Kester, 1992), the Panel on Foreign Trade Statistics found that U.S. exports of goods and services have been persistently underreported. Complex developments in U.S. international financial transactions since the 1970s, coupled with a data collection system that lagged behind those changes, also led to increasingly inaccurate valuations, growing inadequacies in coverage, and errors in estimation procedures of capital flows and investment incomes that affected the size of the statistical discrepancy (see also Stekler, 1991). To understand how the adequacy of the existing data on U.S. international capital transactions has been affected by changes in the world financial markets, the next section describes how these data are collected.
CAPITAL ACCOUNT DATA
Capital flows in U.S. balance-of-payments accounts refer to transactions in financial assets between U.S. residents and nonresidents (foreigners). Financial assets include loans, bank deposits,
|
GENERAL |
|
The Balance of Payments of the United States: Concepts, Data Sources, and Estimating Procedures |
|
Survey of Current Business (monthly) |
|
U.S. international transactions (March, June, September, and December) |
|
The international investment position of the United States (June) |
|
Foreign direct investment in the United States |
|
Direct investment position and related flows of capital, income, and royalties and license fees (June) |
|
Operations of U.S. affiliates of foreign companies (May) |
|
U.S. business enterprises acquired or established by foreign direct investors (May) |
|
U.S direct investment abroad |
|
Direct investment position and related flows of capital, income, and royalties and license fees (June) |
|
Operations of U.S. parent companies and their foreign affiliates (June) |
|
Capital expenditures by majority-owned foreign affiliates of U.S. companies (March and September) |
|
U.S. DIRECT INVESTMENT ABROAD |
|
Gross Product of U.S. Multinational Companies, 1977-91 |
|
U.S. Direct Investment Abroad: 1989 Benchmark Survey, Final Results |
|
U.S. Direct Investment Abroad: Operations of U.S. Companies and Their Foreign Affiliates. Annually from 1990 |
|
U.S. Direct Investment Abroad: Balance of Payments and Direct Investment Position Estimates, 1977-81 |
|
U.S. Direct Investment Abroad, Country by Industry Estimates. 1950-91 (only on computer tape) |
|
FOREIGN DIRECT INVESTMENT IN THE UNITED STATES |
|
A Guide to BEA Statistics on Foreign Direct Investment in the United States |
|
Characteristics of Foreign-Owned U.S. Manufacturing Establishments |
|
Foreign Direct Investment in the United States: Operations of U.S. Affiliates of Foreign Companies. Annually from 1989 |
|
Foreign Direct Investment in the United States. 1987 Benchmark Survey. Final Results; 1992 preliminary result |
|
Foreign Direct Investment in the United States: Establishment Data for 1987 (also available on diskette). Establishment data for manufacturing available annually from 1988 |
|
Foreign Direct Investment in the United States: Balance of Payments and Direct Investment Position Estimates. 1980-86 |
|
Foreign Direct Investment in the United States: Direct Investment Position and Related Capital and Income Flows. Annually from 1980 (only on diskette) |
|
1992 Benchmark Survey Results |
|
U.S. Business Enterprises Acquired or Established by Foreign Direct Investors. Supplementary Tables |
|
OTHER RECENT STUDIES |
|
Gross product of U.S. affiliates of foreign direct investors, 1987-90, Survey of Current Business, November 1992 (updates data in June 1990 Lowe article, below) |
|
Rates of return on direct investment, by J. Steven Landefeld, Ann M. Lawson, and Douglas Weinberg, Survey of Current Business, August 1992 |
|
U.S. direct investment abroad: 1989 benchmark survey results, by Jeffrey Lowe and Raymond Mataloni, Survey of Current Business, October 1991 |
|
Valuation of the U.S. net international investment position, by J. Steven Landefeld and Ann M. Lawson, Survey of Current Business, May 1991 |
|
Gross product of U.S. affiliates of foreign direct investors, 1977-87, by Jeffrey Lowe, Survey of Current Business, June 1990 |
FIGURE 2-2 Selected BEA publications and articles on balance-of-payments data by topic.
drafts, acceptances, notes, government and private debt, equity securities, trade finance, and direct investments. When U.S. residents increase their financial assets abroad or foreigners decrease their financial assets in the United States, a capital outflow takes place and should be recorded. The converse is true for capital inflows.
There are two major types of capital flow transactions: private and official. Private capital flows include direct investment and portfolio investment (banking, securities, and other commercial and financial transactions). U.S. official capital flows include changes in the reserves of U.S. monetary authorities—monetary gold, foreign exchange, special drawing rights at the International Monetary Fund (IMF)—and loans and credits to foreigners by U.S. government agencies. These capital flows are reported in the capital account of the balance of payments (see Table 2-2). Incomes (earnings and profits) on direct and portfolio investment are reported in the current account.5
Among private capital flows, portfolio investments have far exceeded direct investment in recent years; see Figures 2-4 and 2-5. For example, in 1993, net private capital flows pertaining to inward and outward direct investment activities totaled approximately $79 billion in absolute terms ($21.4 billion and $57.9 bil-
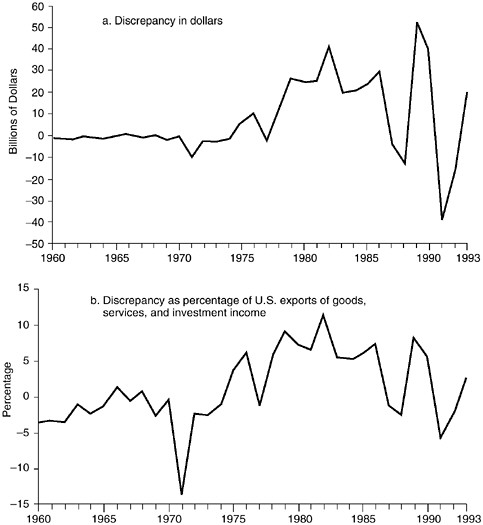
FIGURE 2-3 Statistical discrepancy of U.S. balance-of-payments accounts, 1960-1993.
lion, respectively); those that were induced by international portfolio transactions amounted to $226 billion in absolute terms (Table 2-2).
As noted above, the value of accumulated stocks of U.S. assets abroad and of foreign assets in the United States—resulting from capital flows in and out of this country over time (as adjusted for factors affecting their values)—is annually compiled and published in the statement of U.S. international investment position; see Table 2-3.
TABLE 2-2 U.S. Capital Account Transactions (in millions of dollars)
|
Transaction |
1991 |
1992 |
1993 |
|
|
U.S. assets abroad, net |
-51,512 |
-61,510 |
-147,898 |
|
|
U.S. official reserve assets, net |
5,763 |
3,901 |
-1,379 |
|
|
Gold |
0 |
0 |
0 |
|
|
Special drawing rights |
-177 |
2,316 |
-537 |
|
|
Reserve position in the International Monetary Fund |
-367 |
-2,692 |
-44 |
|
|
Foreign currencies |
6,307 |
4,277 |
-797 |
|
|
U.S. government assets, other than official reserve assets, net |
2,900 |
-1,652 |
-306 |
|
|
U.S. credits and other long-term assets |
-12,874 |
-7,392 |
-6,024 |
|
|
Repayments on U.S. credits and other long-term assets |
16,776 |
5,805 |
6,026 |
|
|
U.S. foreign currency holdings and U.S. short-term assets, net |
-1,002 |
-65 |
-308 |
|
|
U.S. private assets, net |
-60,175 |
-63,759 |
-146,213 |
|
|
Direct investment |
-31,295 |
-41,004 |
-57,870 |
|
|
Foreign securities |
-44,740 |
-45,114 |
-119,983 |
|
|
U.S. claims on unaffiliated foreigners reported by U.S. nonbanking concerns |
11,097 |
45 |
-598 |
|
|
U.S. claims reported by U.S. banks, not included elsewhere |
4,763 |
22,314 |
32,238 |
|
|
Foreign assets in the United States, net |
98,134 |
146,504 |
230,698 |
|
|
Foreign official assets in the United States, net |
17,199 |
40,858 |
71,681 |
|
|
U.S. government securities |
16,147 |
22,403 |
52,764 |
|
|
U.S. Treasury securities |
14,846 |
18,454 |
48,702 |
|
|
Other |
1,301 |
3,949 |
4,062 |
|
|
Other U.S. government liabilities |
1,177 |
2,572 |
1,666 |
|
|
U.S. liabilities reported by U.S. banks, not included elsewhere |
-1,484 |
16,571 |
14,666 |
|
|
Other foreign official assets |
1,359 |
-688 |
2,585 |
|
|
Other foreign assets in the United States, net |
80,935 |
105,646 |
159,017 |
|
|
Direct investment |
26,086 |
9,888 |
21,366 |
|
|
U.S. Treasury securities |
18,826 |
36,857 |
24,849 |
|
|
U.S. securities other than U.S. Treasury securities |
35,144 |
29,867 |
80,068 |
|
|
U.S. liabilities to unaffiliated foreigners reported by U.S. nonbanking concerns |
-3,115 |
13,573 |
14,282 |
|
|
U.S. liabilities reported by U.S. banks, not included elsewhere |
3,994 |
15,461 |
18,452 |
|
|
SOURCE: Data from Bureau of Economic Analysis (1994a:94-95). |
||||
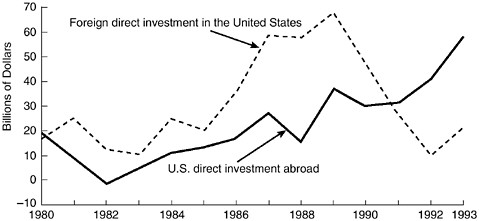
FIGURE 2-4 Direct investment flows, 1980-1993.
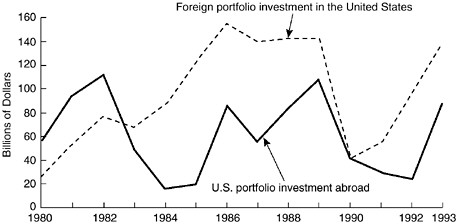
FIGURE 2-5 Private portfolio investment flows, 1980-1993.
DATA COLLECTION SYSTEM
With regard to capital flow data, there are three main elements in the present system (see Figure 2-1):
-
BEA collects information on U.S. direct investment abroad and foreign direct investment in the United States using a series of questionnaires completed by the U.S. parent companies that invest abroad and the U.S. affiliates of foreign companies in the United States.
-
The Treasury Department, using the Federal Reserve banks
TABLE 2-3 International Investment Position of the United States, December 31, 1993, preliminary figures (in billions of dollars)
|
Type of Investment |
Position |
|
Net international investment position of the United States |
|
|
With direct investment positions at current cost |
-556 |
|
[With direct investment positions at market value] |
[-508] |
|
U.S. assets abroad |
|
|
With direct investment positions at current cost |
2,370 |
|
[With direct investment positions at market value] |
[2,647] |
|
U.S. official reserve assets |
165 |
|
Gold |
103 |
|
Special drawing rights |
9 |
|
Reserve position in the International Monetary Fund |
12 |
|
Foreign currencies |
42 |
|
U.S. government assets, other than official reserve assets |
81 |
|
U.S. credits and other long-term assetsa |
79 |
|
Repayable in dollars |
78 |
|
Otherb |
1 |
|
U.S. foreign currency holdings and U.S. short-term assets |
2 |
|
U.S. private assets |
|
|
With direct investment at current cost |
2,125 |
|
[With direct investment at market value] |
[2,402] |
|
Direct investment abroad |
|
|
At current cost |
716 |
|
[At market value] |
[993] |
|
Foreign securities |
518 |
|
Bonds |
221 |
|
Corporate stocks |
298 |
|
U.S. claims on unaffiliated foreigners reported by |
|
|
U.S. nonbanking concerns |
255 |
|
U.S. claims reported by U.S. banks, not included elsewhere |
635 |
|
Foreign assets in the United States |
|
|
With direct investment at current cost |
2,926 |
|
[With direct investment at market value] |
[3,155] |
|
Foreign official assets in the United States |
517 |
|
U.S. government securities |
389 |
|
U.S. Treasury securities |
371 |
|
Other |
18 |
|
Other U.S. government liabilitiesc |
23 |
|
U.S. liabilities reported by U.S. banks, not included elsewhere |
70 |
|
Other foreign official assets |
36 |
-
as agents, collects data on portfolio investment, including international banking, securities, commercial, and miscellaneous capital flows and positions. These data are collected on a number of reporting forms called the TIC (Treasury International Capital) reports, and data aggregates are provided to BEA.
-
BEA obtains data from relevant U.S. government agencies on their international capital transactions. It also compiles data on the international official reserve assets and liabilities of the United States from the Treasury Department and the Federal Reserve system.
BEA is responsible for collating data from all these sources to construct the data for the U.S. balance of payments and U.S. international investment position. BEA's budget for these functions was about $12 million for fiscal 1992, of which about $8 million was allocated for the collection of data on foreign direct
investment in the United States and U.S. direct investment abroad. 6 The Treasury Department has no separate budget for its TIC data program. The costs to the Federal Reserve banks of collecting the TIC data are borne by their own budgets. The Federal Reserve Bank of New York (FRBNY) estimated that for 1992 Federal Reserve banks expended approximately $2 million for this purpose. To put these budget figures in perspective, one needs to note that, in the same year, the Bureau of the Census expended approximately $20 million in compiling data on U.S. merchandise exports and imports. In that year, federal funding for major statistical programs was about $2.4 billion, of which $944 million was allocated to ten major statistical agencies.7
Much of the data collection system on U.S. international capital transactions, which has been developed and refined over the years, depends on collaboration between BEA, the Treasury Department, and the Federal Reserve system.8 For instance, it is essential that all definitions used be consistent, that the coverage of respondents not be duplicated, that there not be major gaps due to missing potential respondents or to new or unusual types of international transactions or market participants, and that requirements of timeliness be met. Since June 1992 BEA has also moved to coordinate data on direct investments with data collected by the Bureau of the Census and the Bureau of Labor Statistics to develop more detailed information by industry and employment on foreign investment in the United States. Recently, BEA and
the Treasury Department have embarked on a data-sharing program intended to improve capital flow data. In all these collaborative efforts, strict confidentiality of individual reports is preserved.
All of the direct and portfolio investment reports are mandatory, although some exemption levels are set to avoid unduly burdensome reporting of relatively insignificant amounts. Current legal authority for the collection of data on international capital flows and investment positions is provided by the International Investment and Trade in Services Survey Act of 1984. As stated in the act, direct investment is defined as ''the ownership or control, directly or indirectly, by one person of 10 per centum or more of the voting securities of an incorporated business enterprise or an equivalent interest in an unincorporated business enterprise." Portfolio investment is defined as all investment that is not "direct investment." These definitions conform to the general guidelines provided by the International Monetary Fund (1993a).9
DIRECT INVESTMENTS
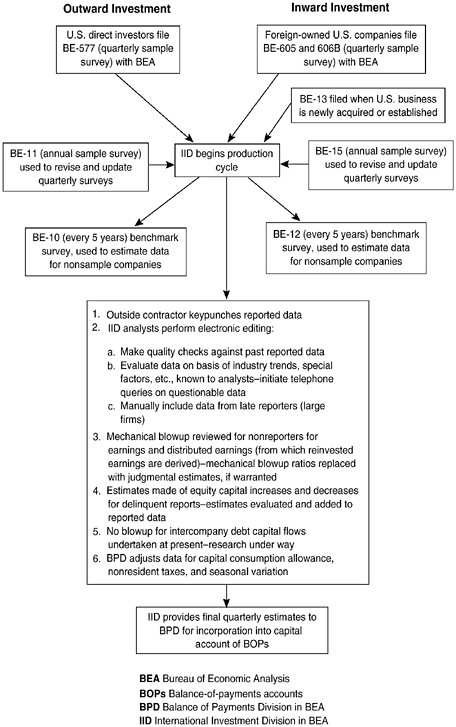
The BEA system for collecting data on direct investment, which has been developed since World War II, uses several sets of surveys to collect the data; see Table 2-4. Separate quarterly surveys are conducted to gather data on capital flows between U.S. parent companies and their foreign affiliates and between foreign companies and their U.S. affiliates. Data cover intracompany accounts, changes in holdings of equity or debt securities, and changes in capital employed out of undistributed profits (reinvested earnings). These data are tabulated in extensive geographic and industry detail. Data are collected from all known significant investors. For U.S. direct investment abroad, reports are required from U.S. companies that hold 10 percent or more of voting stock or equivalent interest in a foreign business enterprise (affiliate) when the affiliate's total assets, annual sales, or annual net income exceed $15 mil-
lion. For foreign direct investment in the United States, reports are required from U.S. business enterprises (affiliates) in which a foreign company holds 10 percent or more of voting stock or equivalent interest when the affiliate's assets, annual sales, or annual net income exceed $20 million. Annual reports are required from all significant direct investors to confirm the quarterly data and provide additional operating data. At approximately 5-year intervals, BEA conducts benchmark surveys (or censuses) of all outward and inward direct investments covering not only the data needed for the capital account, but also other economic data on each significant affiliate. These additional data are derived from the affiliates' balance sheets, profit and loss statements, and other operating accounts. They cover, for example, the book values of the enterprises, sales (local and exported), trade with the United States, wages paid and other operating expenses, taxes paid, and other information. With respect to inward direct investment, BEA also requires notification of any new acquisitions by foreigners (nonresidents) of direct investments in the United States.
Most U.S. outward and inward direct investments involve ownership of more than 50 percent, and certain types of data are required to be reported only when a majority ownership is held. When calculating the amount of earnings on direct investment in the international accounts, BEA makes allowance for the extent of partial ownerships. In addition, quarterly earnings data obtained by BEA are adjusted to allow for the relatively small amounts (below the exemption levels) not covered by the quarterly reporting system. Since 1992 BEA has made a similar adjustment to capital flow data to account for amounts below the exemption level and for delinquent reporters (see Bureau of Economic Analysis, 1992a:75). The process BEA uses in compiling direct investment data is illustrated in Figure 2-6.
By its nature, direct investment tends to be large, especially when the transaction involves the acquisition of an existing enterprise or the initiation of a new project. In order to maintain as complete coverage of each investment as possible, BEA actively seeks out all available sources of information—including the financial press and financial periodicals, among others—on new U.S. affiliates of foreign firms and new foreign affiliates of U.S. firms to identify new reporters.
According to BEA, reports by U.S. companies on their direct investment abroad in 1991 covered 9,200 affiliates in the quarterly reports (BE-577) and 10,800 in the annual reports. For the same year, 3,325 U.S. affiliates of foreign companies filed quar-
TABLE 2-4 Direct Investment Data Collected in BEA Surveys
|
Kind of Survey and Form Used |
Who Reported |
What Is Reported |
Requirement Cutoff for Reportinga |
Number of Reports Filed (year) |
|
Direct transactions of U.S. reporter with foreign affiliate: BE-577 |
U.S. persons who hold 10 percent or more of voting stock or equivalent interest in a foreign business enterprise |
Receipts of income on U.S. direct investment abroad; royalties and license fees; charges for services; U.S. direct investors' equity and debt position in their foreign affiliates |
$15 million |
9,200 (1991) |
|
Transactions of U.S. affiliate, except an unincorporated bank, with foreign parent; transactions of U.S. banking branch or agency with foreign parent: BE-605 and BE-606B |
U.S. business enterprises (affiliates) in which a foreign person holds 10 percent or more of voting stock or equivalent interest |
Payments of income on foreign direct investment in the U.S.; royalties and license fees; charges for services; foreign direct investors equity and debt position in their U.S. affiliates |
$20 million |
3,325 (1991) |
|
Kind of Survey and Form Used |
Who Reported |
What Is Reported |
Requirement Cutoff for Reportinga |
Number of Reports Filed (year) |
|
Benchmark survey of U.S. direct investment abroad: BE-10, BE-10A Bank, BE-10B, and BE-10B Bank |
U.S. persons who hold 10 percent or more of voting stock or equivalent interest in a foreign business enterprise and foreign affiliates of U.S. direct investors |
Complete financial and operating data for U.S. persons who are direct investors abroad for each foreign affiliate; data on investment position and transactions between foreign affiliates and U.S. direct investors |
$3 million |
18,800 (1987) |
|
Benchmark survey of foreign direct investment in the United States: BE-12 |
U.S. business enterprises (affiliates) in which one foreign person holds 10 percent or more of voting stock or equivalent interest |
Complete financial and operating data for each U.S. affiliate of foreign direct investors; data on investment position and transactions between U.S. affiliates and foreign direct investors |
$1 million |
10,500 (1989) |
|
NOTE: See Chapter 3 (Table 3-2) for details of all forms and their coverage. a Reporting is required when the affiliate's total assets, annual sales, or annual net income exceed the cutoff figure. SOURCES: Data from Bureau of Economic Analysis (1990), and BEA staff. |
||||
terly reports (BE-605/606B), and 5,100 of them filed annual ones (BE-15).
The value of the U.S. direct investment position abroad at the end of 1993 (historical cost basis) was $549 billion. Of this amount, 36 percent was in manufacturing; 33 percent in banking and other finance, insurance and real estate; and the remainder spread over other industries. The foreign direct investment position in the United States was $445 billion, of which 37 percent was in manufacturing and 28 percent in finance (including banking), insurance and real estate (Bureau of Economic Analysis, 1994a).
PORTFOLIO INVESTMENTS
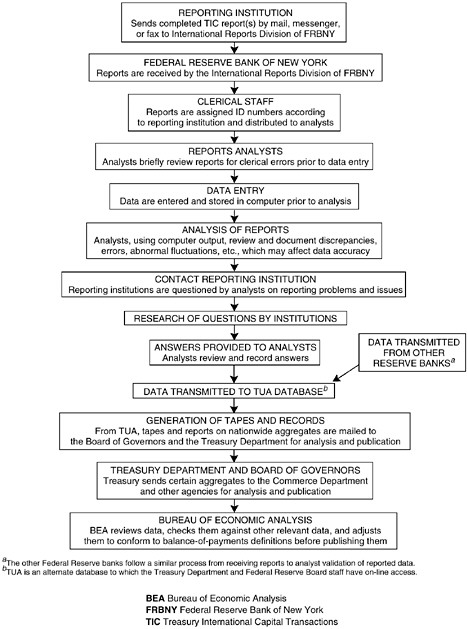
In principle, all international capital flows other than direct investment between private U.S. residents and nonresidents are covered by the Treasury Department's TIC reporting system. The TIC system also covers all foreign purchases or sales of U.S. government securities. The Treasury Department has been responsible for collecting data on capital movements between the United States and foreign countries in some form since 1935. The legal authority to collect these data is vested in the Treasury Department, which maintains an oversight of the system. Operation-ally, the 12 district Federal Reserve banks, principally the Federal Reserve Bank of New York, collect the data, maintain contact with respondents, and ensure the accuracy and integrity of the data. The Treasury Department also maintains contact with respondents and is responsible for resolving reporting issues, handling policy questions, and pursuing data enhancement efforts. The FRBNY consolidates the data from various Federal Reserve banks, but it does not tabulate the data for publication. The data remain in the FRBNY's computers in databases to which the Treasury Department has access. The Treasury Department publishes the aggregate data in its quarterly Treasury Bulletin. It also transmits the aggregate TIC data to BEA on a magnetic tape. In addition, the TIC data are provided to the Federal Reserve Board for internal use and for publication of selected aggregates in the monthly Federal Reserve Bulletin.10
Under the TIC system, information on international portfolio transactions is collected from both financial and nonfinancial institutions; see Figure 2-7. There are three main elements in the system; see Table 2-5. First, U.S. banks, other depository institutions (including the U.S. branches and agencies of foreign banks), bank holding companies, and securities dealers located in the United States are required to file a combination of monthly, quarterly, and semiannual B-series reports (B forms) on U.S. claims on and liabilities to foreign residents. The amounts of claims and liabilities outstanding, including short-term instruments held in custody for domestic customers, are reported by major types of claims and liabilities (such as deposits, loans, and U.S. government short-term obligations), by major types of foreign residents (such as official institutions, unaffiliated foreign banks, own foreign offices, and other foreign parties as a group), and by an extensive list of partner countries. Reports are required from entities whose aggregate claims on or liabilities to foreigners amount to at least $15 million as of the end of the month. About 950 institutions report monthly. Claims and liabilities denominated in foreign currencies are shown in a separate category as aggregate amounts in dollar-equivalent values, but not in separate foreign currencies. At the end of 1993, aggregate claims and liabilities reported on the B forms totaled $587 billion and $992 billion, respectively.
FRBNY's task of validating the B form data is facilitated by the fact that the Federal Reserve system has a supervisory relationship with the banking industry: all banks are required to file with banking regulators the quarterly Consolidated Reports of Condition and Income (commonly known as the Call Reports). These reports provide FRBNY with data to assess banks' TIC reporting compliance.
A second part of the TIC system is designed to capture all significant transactions between U.S. residents and nonresidents in domestic and foreign long-term securities. All banks, securities dealers, investment firms, and, in principle, any person in the United States conducting such transactions above a certain minimum amount ($2 million or more in the aggregate during a reporting month) directly with foreigners are required to report such transactions monthly on the S form to the Federal Reserve. The gross (turnover) value of reported securities transactions on the S forms in 1993 was $8.6 trillion. As of 1993, there were about 475 S form respondents. The data are broken down into domestic and foreign securities and into equity and debt securities. Domestic debt securities are further differentiated by type, including gov-
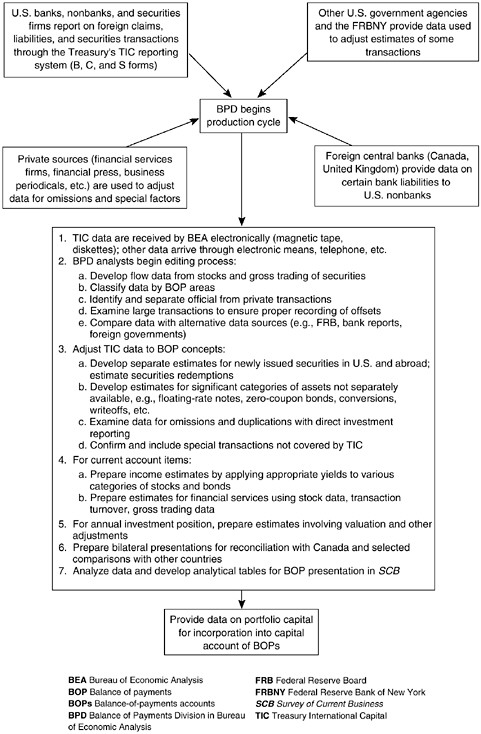
TABLE 2-5 Treasury International Capital Reports
|
Kind of Data and Form Used |
Who Reports |
What Is Reported |
Requirement Cutoff for Reporting |
Number of Respondents (1993) |
Aggregate Claims and Liabilities (1993) |
|
Banks' international positions: B forms |
Banks, depository institutions, bank holding companies, securities dealers in the United States |
U.S.-booked liabilities and claims positions, including custody items, with foreign residents, by major type of item (deposit, loan) and type of foreign resident (official institutions, unaffiliated foreign banks, own foreign offices, other foreign parties). Excludes positions in long-term securities |
$15 million or more at the end of the month |
950 |
Claims: $587 billion Liabilities: $992 billion |
|
U.S. international long-term securities transactions: S forms |
Banks, securities firms, investments intermediaries, other entities |
Transactions with foreign residents in domestic and foreign long-term securities |
$2 million or more in a reporting month |
475 |
Gross value of reported transactions: $8.6 trillion |
|
Positions of nonbanking firms with unaffiliated foreigners: C forms |
Nonbanks in the United States (such as exporters, industrial and commercial firms) |
Liabilities positions with unaffiliated foreigners. Excludes positions in long-term securities |
$10 million in either claims or liabilities |
400 |
Claims: $43 billion Liabilities: $50 billion |
|
NOTE: See Chapter 3 (Table 3-1) for details of all forms and their coverage. |
|||||
ernment obligations. The countries for which detail is provided are the same as for the banking data. Respondents do not report individual transactions; the monthly reports are a combination of all their transactions in the period.
Under the balance-of-payments framework, the geographic allocations of these data are based on the place of residence of the foreign transactor. A recorded transaction with Britain, for example, does not necessarily mean that the trade is in British securities, or that the ultimate buyer or seller is British. It can mean that a French broker, acting on behalf of a Japanese investor, carries out a transaction with a U.S. firm in London. This problem of geographic allocation applies to all balance-of-payments data compiled under the concept of residents and nonresidents as a basis of distinction between the United States and foreign countries. This distinction, however, is particularly problematic for securities transactions, as discussed in Chapter 3.11
This part of the TIC system currently covers only long-term securities (those with original maturities of longer than 1 year). For domestic securities, these include Treasury bonds and notes, federal agency issues, corporate bonds, and corporate stocks. For foreign long-term issues, the major categories are foreign bonds and foreign stocks. Warrants and options are covered only when the underlying security is a stock or long-term bond; the sales and purchases of such derivative instruments are not separately reported from purchases and sales of the underlying securities. Short-term securities (maturity of 1 year or less) are reported on either the B form or the C form, depending on type.
Unlike the B form data, which provide positions of claims and liabilities, S form data are flows, covering transactions each month. They do not provide information directly on U.S. holdings of foreign securities or foreign holdings of U.S. securities. Estimates for holdings (or investment positions) are derived by aggregating the annual flow data over time and adjusting for changes in securities prices. For foreign holdings of U.S. securities, the Treasury Department also conducts periodic benchmark surveys. As noted above, however, for U.S. holdings of foreign securities, there were no surveys between 1943 and 1994.
To validate the completeness and accuracy of the S reports, the FRBNY regularly compares the reported data with available information on international securities offerings, purchases, and redemptions. Since borrowers and lenders now have ready direct access to foreign markets and can easily bypass domestic financial intermediaries, it has become increasingly difficult for the FRBNY to ensure complete coverage and accuracy of the S form data.
The third major element in the TIC system covers the foreign claims and liabilities of U.S. nonbanks (other than those classified as direct investment or securities). Nonbanking enterprises in the United States include importers, exporters, industrial and commercial firms, and financial entities other than depository institutions and securities firms. A monthly report (CM) is required for dollar denominated deposits abroad (such as Eurodollar deposits and certificates of deposit), and quarterly reports (CQ-1 and CQ-2) are required, respectively, for financial claims and liabilities (deposits, loans, and borrowings abroad) and for commercial or trade-related claims and liabilities (such as international trade receivables and payables). The reporting threshold for these C forms is $10 million with respect to claims or liabilities on the bases of closing balances. In principle, all U.S. residents with foreign claims and liabilities that exceed the exemption level are required to report. The reports contain a limited amount of detail on the types of claims and liabilities. The geographic information is the same as in the other TIC reports; financial claims and liabilities denominated in foreign currencies are shown separately.
At the end of 1993, aggregate claims and liabilities shown on the C forms totaled $43 billion and $50 billion, respectively (see Table 2-5). In that year, about 400 nonbanking entities in the United States filed C forms. Since the universe of potential reporters of the C form is large and diverse, data validation for these forms is particularly difficult for the FRBNY. The possibility of missing some relevant potential reporters is high (see Chapter 3). Comparisons of the TIC data with data from other countries indicate that substantial amounts of foreign claims and liabilities by U.S. nonbanks are not reported in the TIC system.
On receipt of the TIC data from the Treasury Department, BEA collates the data with all other available information. It checks for internal consistency and consistency with other elements of the balance-of-payments accounts, makes adjustments, whenever necessary, to comply with the balance-of-payments definitions and concepts, and enters the data into the accounts; see Figure 2-8.
For example, for the B form banking data, BEA converts the position figures into flow data by ''differencing" the positions reported between two consecutive months and by making adjustments for changes in coverage and in the dollar equivalents of claims and liabilities items denominated in foreign currencies. For the S form securities data, BEA makes an adjustment to exclude fees and other charges, which are included in the reported transactions to account for capital flows in securities transactions.12 BEA also compares the TIC securities data with data on direct investment or any other information that might be available. With regard to the C form data, as in the case of the banking data, BEA converts the position data into flow data. BEA also compares these data with those received on direct investment flows. In view of the weakness in the C form coverage, BEA has begun to use banking data from the Bank for International Settlements and from some foreign central banks to supplement the C form data (see Bureau of Economic Analysis, 1994a:79ff).
U.S. GOVERNMENT CAPITAL FLOWS
The other major segment in the U.S. capital account is the financial activity of U.S. government agencies and the international reserves of the U.S. government. BEA compiles quarterly data on the lending activity and foreign asset and liability positions of the many federal government agencies involved in such activities; see Figure 2-9. These data are obtained through direct contact with the agencies involved. There is a wide range of such activities, which include the lending by the Export-Import Bank, military loans accounted for by the Defense Department, foreign currencies held by the Agency for International Development (AID), foreign Persian Gulf war pledges to the United States, and U.S. grants to foreign countries to pay off their outstanding debts. In addition to the data on loans and credits that BEA collects from U.S. government agencies, BEA compiles data on all other U.S. foreign grants and aid. BEA also includes in the balance-of-payments accounts the changes in U.S. international official reserves as reported by the Treasury Department, including changes in the gold stock, foreign currencies held, and special drawing rights and the reserve position with the IMF. As with other position data,
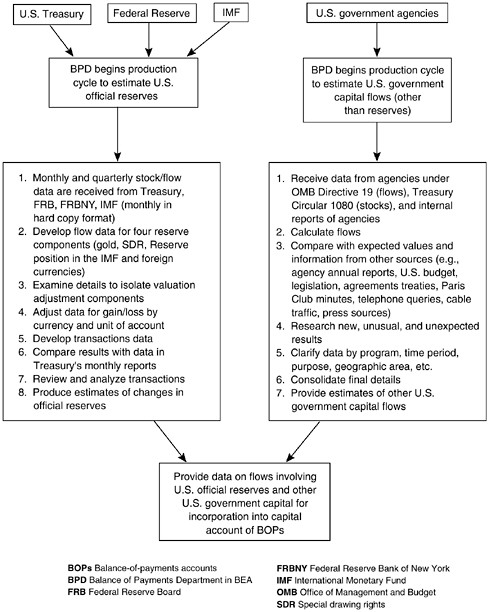
BEA makes adjustments to derive the flow amounts. Statistical Directive 19, from the U.S. Office of Management and Budget (OMB), provides the authority for collecting this information.
The information collected by BEA from the various government agencies is primarily in the form of government records. The great majority of these records are the accounting records that must be maintained to accomplish the various agencies' missions, to report to Congress, or to report to OMB. Those uses are different from BEA's uses. An example is loans to developing countries. An agency making a loan has a function that directly parallels that of a commercial bank: there is a need to service the loan, and data must be maintained on payments and disbursements as well as on closing balances. In contrast, BEA is primarily concerned with the flows between two consecutive closing balances. BEA computes the flow for balance-of-payments purposes by looking at the difference between the balance of the loan reported for the current quarter and that reported for the previous quarter. (As noted above, grants are classified as unilateral transfers and shown in the current account of the balance of payments, not the capital account.)
Reporting on government international capital transactions is expected to be comprehensive and complete; the information is not collected using sample surveys. Data cover all programs and subprograms that involve sending dollars overseas or receiving them from abroad. All transactions are reported on a cash basis and are, at least in theory, reported when they occur. More than 150 agencies typically report on U.S. government international capital transactions. Among the largest are the Department of State, the Export-Import Bank, AID, and the Departments of Defense and Agriculture. The organizations report on a quarterly basis. Unlike data on private capital flows, these transactions are reported in almost any format convenient to the provider.
Data editing and verification are accomplished in a number of ways. Historical comparisons are frequently made to determine whether information from a particular agency is out of the usual pattern. BEA maintains reported data from as far back as 1945. In addition, BEA monitors legislation and tracks changes—for example, when new programs begin, when programs are merged, or when programs are discontinued. In addition, budget statements and reports to Congress by the various agencies are compared with what is reported to BEA.
INTERNATIONAL INVESTMENT POSITION
BEA prepares an annual statement on the international investment position (assets and liabilities) of the United States and reconciles the changes in the investment position with the flow data shown in the capital account of the U.S. balance of payments (see Table 2-3). There are several factors other than capital flows that affect the value of outstanding assets and liabilities. Changes in exchange rates, for example, have an impact on the value of assets overseas. Changes in market prices of assets and capital gains and losses (including writeoffs) can also influence the market value of assets. To take into account these and other relevant factors, BEA includes in the U.S. international investment position a number of elements excluded from the balance-of-payments data:
-
for direct investment, capital gains and losses from exchange-rate translations or disposition of fixed assets;
-
also for direct investment, estimates of changes in market value or replacement cost;
-
for securities, estimates of changes in market value and exchange rates;
-
for banking positions, allowances for writeoffs, breaks in series, or other factors affecting reported positions; and
-
for U.S. government assets, any changes in reported amounts outstanding that do not result from actual transactions.
The basic data for the annual statement on U.S. international investment position are derived from the BEA and TIC systems described above. However, some flow data are supplemented by the collection of data on outstanding positions, as in the case of direct investment, and other banking and nonbank data are derived from original position statements as reported by banks and nonbanks. For securities, however, as indicated above, there are recent stock data, compiled from benchmark surveys, only for foreign holdings of U.S. securities. These data, which are collected on a 5-year schedule and are relatively comprehensive, provide a check at intervals on the accuracy of the flow data. Current position estimates for these holdings are essentially the summations of flow data and price and exchange rate changes over the years.
These data on the magnitude of U.S. international assets and liabilities are important in at least three respects: (1) they reflect the net external position of the United States (net debtor or net
creditor) with the rest of the world economy; (2) they are used to calculate the investment income flows (earnings) on portfolio claims and liabilities, which are reported in the current account of the balance of payments; and (3) insofar as they are generated by separate benchmark surveys, they serve as one of the few available checks on the accuracy of the flow data shown in the U.S. balance-of-payments accounts.
Rapid changes in world financial markets have strained the coverage of the existing data system, rendering some of the data inaccurate and incomplete in depicting U.S. international capital transactions. Chapters 3 and 4 discuss these issues in detail.


