
D
Survey of AMO Scientists
As part of the FAMOS panel's assessment, a survey of AMO scientists was conducted by mail, using the questionnaire reproduced at the end of this appendix. The mailing comprised a letter of introduction, the five-page questionnaire and postage-paid return envelope, a Research Specialties Directory (also reproduced at the end of this appendix), and a postage-paid quick-response postcard. This was sent to members of the American Chemical Society, the American Physical Society (APS), the Institute of Electrical and Electronics Engineers, the Materials Research Society, the Optical Society of America, and the Society of Photographic and Instrumentation Engineers who expressed interest in areas related to the present assessment as defined by the division, topical groups, technical interest groups, and so on, to which each belonged. The mailing lists from the different societies were cross-referenced and culled to minimize duplicate mailings to the same person. Budgetary constraints required that the mailing be limited principally to members with PhD degrees.
A total of 19,650 questionnaires were mailed, of which 3,424 were returned completed. Approximately 2,000 recipients responded by stating that they would not complete the questionnaire because they were not practicing AMO scientists. The overall response rate of approximately 28% is typical for surveys of this type. The number of questionnaires obtained, however, is sufficient to ensure a diversity of opinion and circumstance and allows the data to be broken down and analyzed by subgroups. Nonetheless, the possibility exists that the results of the survey will be biased by nonresponse; that is, the opinions of those AMO scientists who did not respond are not represented. It is difficult to estimate what fraction of practicing AMO doctoral scientists actually received and returned a
questionnaire. The categories included in setting up the mailing list were purposely kept broad to ensure good coverage of the field, and it was expected that the list would include many non-AMO scientists who might not respond at all. The 1990 APS employment survey reported 2,725 doctoral scientists actively employed in AMO physics in 1989, and that this number had remained essentially constant for several years. The panel's survey indicates that ~41% of AMO scientists hold degrees in physics, suggesting that there are about 6,000 to 7,000 AMO doctoral scientists active today. The completed questionnaires received therefore appear to represent a sampling of the opinions of approximately one-half of practicing AMO scientists.
Education And Employment Profile
As expected, given the selection criteria applied at the time of mailing, the majority of respondents (93%) had a PhD degree. Forty-six percent indicated that they were employed in universities/colleges, 30% in industry, and 18% in federally funded research and development (R&D) laboratories or government (to be termed simply government). Sixteen percent described their R&D activities as principally atomic, 46% as principally molecular, and 38% as principally optical. Approximately equal numbers of respondents characterized their work as being principally basic or principally applied. Eighty percent described their R&D activities as principally experimental. Of the 20% whose activities were principally theoretical, 76% considered their work computationally intensive.
The year that respondents received their highest degree is shown in Figure D.1, broken down by employment sector and principal area of research. The overall distributions reflect the effects of retirement and illustrate disproportionate growth in optical science over the past 30 years. A similar growth in industrial employment is also noted. The distribution of specialties in which respondents working in industry, government, and universities received their highest degrees is shown in Figure D.2. A total of 41% of the respondents received their highest degree in some area of physics, 36% in chemistry, and 23% in engineering or some other field. Respondents with degrees in optical physics, applied physics, electrical engineering, and materials science had the highest probability of being employed in industry. The places in which respondents work is shown in Figure D.3a, broken down by principal area of research. The difference in emphasis between work conducted in industry and in universities is clearly illustrated. In industry the focus is on optical science; in universities molecular science is dominant.
The distribution of times for which respondents have been employed by their present employer is presented in Figure D.3b. It is interesting to note that mobility appears highest in the industrial sector and that although some 38% of respondents have changed employers in the past 5 years, only ~18% received their highest degree in this interval.
The principal job positions of respondents employed in industry, government, and academe are shown in Figure D.4. In total, only 5% of respondents indicated that they held temporary positions. The professional societies to which respondents belong are indicated in Figure D.5. The number of different societies included in Figure D.5 illustrates the breadth of AMO science and the range of interests of its practitioners. On average, each respondent is a member of 2.3 societies.
Figure D.6 illustrates how the breakdowns between atomic, molecular, and optical, basic and applied, and experimental and theoretical R&D activities depend on employment sector. In industry, 87% of respondents are involved in applied work, whereas in universities 75% undertake basic research. The relative emphasis on basic and applied work is about equal in government laboratories. Theoretical activity is greatest in universities and significantly less in industry.
RESEARCH AND DEVELOPMENT ACTIVITIES AND TRENDS
The research specialties of respondents are shown in Figure D.7, broken down by employment sector. The emphasis on optical science in industry and on molecular (and atomic) science in universities is again evident. The enabling aspect of AMO science is also demonstrated in that a large majority of respondents in industry noted that their work interfaced with other areas of science and technology.
A substantial fraction of respondents (66% in industry, 77% in government, and 73% in universities) indicated that they are involved in collaborative programs with other groups in the United States. A smaller but still sizable fraction (32% in industry, 41% in government, and 45% in universities) reported collaborations with groups outside the United States. Of those respondents involved in collaborative research, 64% in industry, 62% in government, and 55% in universities described their work as cross-disciplinary, which further emphasizes the breadth of AMO science and its many applications. Their level of involvement in collaborative programs is illustrated by Figure D.8. Approximately 50% described themselves as being very involved, whereas only ~10% showed their involvement as peripheral. The large majority, over 85%, indicated that in the past 5 years their level of involvement has remained the same or increased; indeed, ~30% indicated that their involvement has increased substantially. This may reflect the broadening impact of the field and/or changes occurring in response to funding pressures.
The utilization of user facilities by respondents is shown in Figure D.9a. Only ~20% indicated that more than 50% of their experimental or computational work is undertaken at user facilities, whereas approximately 50% do not utilize such facilities at all. The utilization patterns change little between employment sectors (or major research area). A weighted average of the responses suggests that some 22% of the work in AMO science is undertaken at user facilities. The
responses also suggest that computational theorists are somewhat more likely to use user facilities than are experimenters. The data indicate that ~29% of computational work is undertaken at user facilities. Figure D.9b shows how the respondents' utilization of user facilities has changed in the past 5 years. No strong trends are evident. Approximately 17% indicated their activities at user facilities have increased, whereas 9% said these have decreased.
Figure D.10a shows the countries that respondents listed as having significant R&D activities in their major area. It is apparent that only a few respondents work in areas in which there is no competition from outside the United States. Competition from Japan is especially strong in optical science and from Germany in atomic and molecular science. Figure D.10b indicates how respondents believe the U.S. contribution to the total worldwide effort in their major area has changed in the past 5 years. Clearly, the perception is that in all areas of AMO science the U.S. contribution has decreased somewhat in this interval.
Figure D.11 shows how respondents rated R&D efforts in their area in the United States in comparison to those in other countries in terms of innovation, productivity, equipment, and facilities. The U.S. effort ranks well in each area, especially in innovation, where ~72% of respondents rated U.S. performance as strong/very strong, that is, a rating of 1 or 2. The rating in terms of productivity, equipment, and facilities is somewhat lower, but 48%, 50%, and 45% of respondents, respectively, still believe that the U.S. position is strong/very strong.
How respondents regard the balance between theory and experiment is illustrated in Figure D.12. It is apparent that researchers in all three employment sectors, and in each major research area, believe the balance between theory and experiment to be about right. To explore this question further, the data were sorted according to whether the respondents' interests were principally experimental or principally theoretical, but as is evident from Figure D.12, even theorists feel that the present balance between theory and experiment is reasonable.
The sources of R&D funding for the groups or teams to which respondents belong are shown in Figure D.13. A large percentage (~80%) of the university research groups represented receive support from federal agencies, highlighting the importance of federal funding in maintaining a strong university research effort. However, a significant number of university groups receive funding from other sources. In particular, ~19% and 13% receive support from industrial contracts and corporate donations, respectively (the largest number of these going to support optical and molecular science). Approximately 82% of industrial groups represented in the survey receive internal support, although ~35% also obtain funding from federal agencies. As expected, federal monies support the bulk of the research effort in government laboratories.
The total amounts and sources of annual support for AMO science listed by respondents are presented in Figure D.14a, which shows an aggregate annual support of $610M. This figure, however, does not include industrial funding from internal sources. Approximately 71% of university respondents served as
principal investigator or co-principal investigator on one (or more) grant, contract, or donation. This fraction was somewhat smaller in government (~60%) and much less in industry (~29%). The largest individual source of support is DOD, with an annual support level of $204M, followed by DOE ($103M), NSF ($59M), and NASA ($52M). Other federal support totals $48M. Industrial contracts ($69M) are also a significant source of funding. Private foundations, corporate donations, and state funds contribute ~$48M. Given that not all AMO scientists responded to the questionnaire, these numbers represent lower bounds to the annual funding level for AMO science, which is likely to be ~$1B. Nonetheless, it is clear that DOD is a major supporter of AMO science and that changes in its funding patterns could have a major impact on the field, especially in the industrial sector, where DOD support is dominant. In contrast, the present survey indicates that NSF is the largest supporter of university-based AMO R&D (~25%, $55M), followed by DOD (~21%, $47M), and DOE (~12%, $26M). Thus the fate of university-based AMO research is strongly tied to that of NSF. The total federal support listed by university-based researchers is $165M.
The mean and median values of the annual support that individual respondents receive from NSF, DOE, DOD, and NASA are shown in Figure D.14b . These may not reflect the true median/average grant sizes for those agencies, however, because a given respondent may have combined support from more than one grant/contract from a given agency or may be co-principal investigator and thus may have reported only his/her share of the total. It is apparent that the mean/median support levels provided to individual investigators by NSF and NASA are significantly lower than those provided by DOD and DOE. The large differences between the median and the mean values in the case of DOE, DOD, and NASA result because these agencies support a number of multimillion dollar projects that significantly increase the mean.
Approximately 76% of respondents receiving direct research support indicated that they were involved in mission-oriented research. The distribution of responses among the mission categories (energy, health and the environment, space science, defense, and commerce and technology) is shown in Figure D.15. R&D related to defense dominates in industry and is important in university and government laboratories, where, however, it is almost equaled by energy-related R&D. There are also significant activities in the areas of health and the environment, and space science. In optical science, defense dominates mission-oriented R&D. For atomic and molecular science, energy is the most important category, with defense a close second. AMO science is, however, clearly important in all mission areas.
The percentage of the total R&D funding that respondents receive that is used in salary/stipend support is shown in Figure D.16. Clearly, such support accounts for a major fraction of the research budget in each sector, leaving little flexibility, especially as regards purchase of major new research instrumentation. This inability to upgrade equipment can limit R&D progress and output
and reduces the exposure of graduate students to state-of-the-art equipment and techniques, a vital part of their training.
The distribution of the number of different sources from which individual respondents with R&D funding receive that funding is shown in Figure D.17a. Approximately 60% indicated that they receive support from only one or two sources. Fewer than 10% obtain funding from more than five sources. Figure D.17b shows how the number of sources from which respondents receive funding has changed in the past 5 years. This number appears to have remained largely unchanged in recent years.
The change in respondents' R&D support in the past 5 years is shown in Figure D.18. Approximately 51% indicated that in real terms their support has decreased, and only ~25% that it has increased. The situation appears to be worst in government laboratories. These figures may also underestimate the real decrease in funding, because respondents who had no current R&D funding but may have had support within the past 5 years were instructed not to answer this question. No significant differences in the funding history for each specialty area, that is, atomic, molecular, and optical, were evident. As demonstrated in Figure D.19, a large majority, ~71%, of respondents believe that funding for strong programs should not be increased at the expense of the total number of programs supported.
The percentage of time that respondents spend pursuing R&D support is shown in Figure D.20. Although ~61% of respondents reported spending less than 20% of their time seeking funding, a significant number, ~12%, stated that they spend greater than 50% of their time in this pursuit. However, researchers in universities tend to spend a somewhat larger average fraction of their time seeking support than do their colleagues in industrial or government laboratories.
The averaged relative priorities assigned to different categories are shown in Figure D.21, broken down by employment sector, and exhibit a number of prejudices. Respondents in all sectors, but especially universities, assign high priority to support of single-investigator, small-scale programs, which are the very heart of AMO science. Similarly broad support exists for funding young investigators, graduate students, and postdoctoral/research associates. It is also agreed that capital equipment items deserve strong support. There is unanimity that new user facilities, advanced computer facilities, centers of excellence, and soft-money positions are not of the highest priority. Respondents in government and industrial laboratories feel that existing user facilities and consortia/multi-investigator programs/interdisciplinary research deserve quite high priority, but workers in universities are somewhat less enthusiastic.
HUMAN RESOURCES AND DEMOGRAPHICS
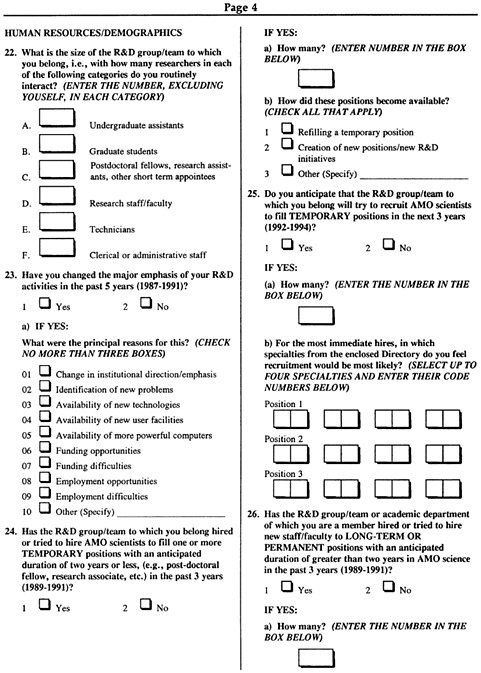
The size of R&D groups or teams to which respondents belong is shown in Figure D.22. As might be expected, interaction with graduate and undergraduate
students is greatest for respondents at universities/colleges. Indeed, ~67% of such respondents reported that they interact with one or more undergraduate research students, and 79% indicated that their research group contains one or more graduate students. Approximately 27% of respondents from government indicated interaction with undergraduate students, and ~41% involvement with graduate students. The corresponding numbers in industry are much lower, ~13% and ~18%, respectively. University and government laboratories also provide continued training for postdoctoral/research associates; ~56% and ~65% of respondents, respectively, in these sectors noted that they interact with one or more such researchers. In contrast, only ~23% of workers in industrial laboratories reported such interactions. A large fraction of the respondents in all these employment sectors reported interactions with one or more other research staff/faculty, although this is particularly high in government laboratories. Technical support is strongest in industrial and government laboratories, where somewhat more than 70% of respondents interact with one or more technicians. This figure is substantially smaller in universities (~35%). Clerical and administrative support in all three sectors appears comparable.
The fractions of respondents reporting changes in the major emphasis of their R&D activities in the past 5 years is shown in Figure D.23. Only ~45% of university researchers have changed their major R&D emphasis in this interval, which contrasts with the ~66% of industrial researchers who did. The major reasons for change appear to be changes in institutional direction/emphasis (except in universities), identification of new problems, funding and employment opportunities, and the availability of new technologies. Taken together, funding difficulties, employment difficulties, and the availability of new computer or user facilities do not appear to be major driving factors for changes in emphasis. These responses indicate that the evolution of the field is being governed principally by new scientific opportunities.
Information regarding hiring in the past 3 years to fill temporary positions is presented in Figure D.24. These data may be biased in that multiple returns from a large research group could result in an overestimation of available positions. However, given an overall response rate of only ~50%, and the typically small size of AMO R&D groups or teams, this effect should be relatively small. Also, comparisons of past and future trends are not affected by this bias. The data suggest that a majority (~60%) of R&D groups in government laboratories have hired, or tried to hire, AMO scientists to fill temporary positions. This figure is somewhat less (~46%) in universities. In industrial laboratories the situation is different, with only ~23% of such laboratories having attempted to fill temporary positions. Typically, in each sector groups that have sought to fill temporary positions have had only one, two, or possibly three openings. These positions appear to arise equally from refilling a temporary position and from creation of new positions.
Anticipated recruiting patterns for temporary positions for the next 3 years
are illustrated in Figure D.25a. A large fraction (~70%) of researchers in industrial laboratories do not anticipate any new hires in the next 3 years. The situation is somewhat better in government and university laboratories, where ~60% and 50% of respondents, respectively, anticipate new openings. Again those groups that anticipate having positions to fill expect typically only one or two openings. Comparison of Figure D.24 and D.25a provides little optimism that the availability of temporary positions will increase in the near future. Taken together, respondents in government, industry, and universities estimate there will be 740, 540, and 1,330 temporary positions, respectively, in these sectors in the next 3 years; that is, respondents expect an average of 870 temporary positions in AMO science per year. This availability is slightly lower than that reported (~930 per year) for temporary positions in the past 3 years. Figure D.25b shows the distribution of specialties in which recruitment is considered likely. These distributions vary according to employment sector; industry emphasizes interfaces with other areas of science and technology, and optical sciences in general. Government laboratories place emphasis on interface areas, but areas such as atomic and molecular collisions and structure, and their optical interactions and spectroscopy, are also considered important. Universities place emphasis on these latter areas.
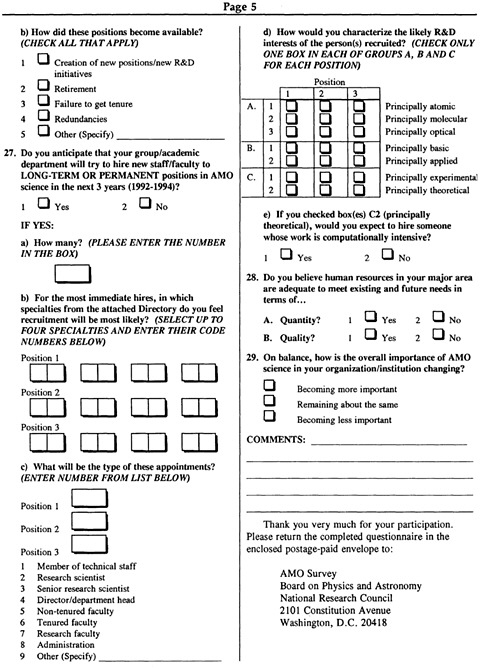
As illustrated in Figure D.26, somewhat over one-half the respondents from each employment sector indicated that their research group or team hired, or tried to hire, new faculty/staff to long-term or permanent positions in the past 3 years. Few respondents, however, reported more than two openings. In universities, only ~13% of openings are associated with failure to get tenure, the remainder arising approximately equally from retirement and creation of new positions. In government and industrial laboratories the majority of openings resulted from the creation of new positions.
Anticipated recruitment patterns for permanent or long-term positions are shown in Figures D.27a-d. Less than one-half the respondents in each employment sector anticipate hiring within the next 3 years, and comparison with Figure D.26 suggests that the job market in the immediate future will be tougher than in the past. Indeed, respondents in government, industry, and universities expect the availability of 360, 980, and 910 long-term positions, respectively, in these sectors. This corresponds to an average of ~750 positions per year, significantly less (~30%) than the average of ~1,070 positions per year reported for the past 3 years. Researchers in government laboratories are most pessimistic about the future, perhaps a response to uncertainties concerning the future role of government laboratories. The distribution of specialties in which recruiting is considered likely is shown in Figure D.27b. The emphasis in industry is on applications and optical science, and that in government and universities is more on atomic and molecular collisions and structure and their optical interactions and spectroscopy. As indicated in Figure D.27c, the majority of openings in universities (~51%) will be nontenured faculty positions, with ~31% tenured positions.
Only ~11% will be for research faculty/research scientist positions. In industry and government, most openings will be for members of technical staff or research scientists.
The likely R&D interests of the persons to be recruited are shown in Figure D.27d. The emphasis in industrial hiring will be on people with a background in optical science, and, to a lesser degree, molecular science. A similar bias is evident in the case of government laboratories. Molecular science will lead recruitment efforts at universities, which are more evenly divided among the three AMO categories. As expected, emphasis in industry will be on applied science, and in universities on basic science. In each employment sector, fewer than 16% of anticipated openings will be in theory, corresponding to a total of ~110 positions per year. Of these theorists, it is expected that ~80% will work on computationally intensive problems.
As indicated in Figure D.28, a substantial majority of respondents, especially those in industry, believe that human resources in AMO science are adequate to meet existing and future needs in terms of both quantity and quality. As demonstrated in Figure D.29, respondents do not believe that the importance of AMO science is decreasing. Indeed, researchers in universities believe that, at least in this setting, its importance is increasing significantly.
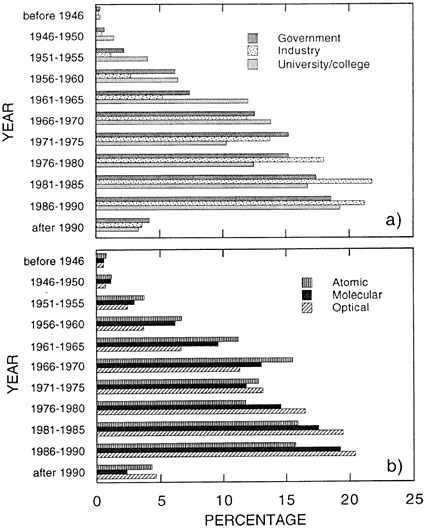
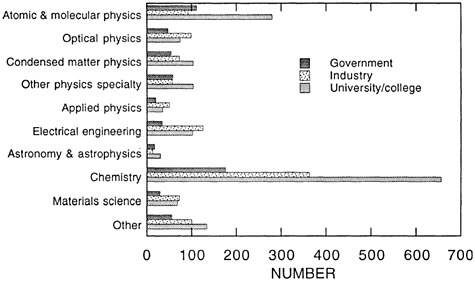
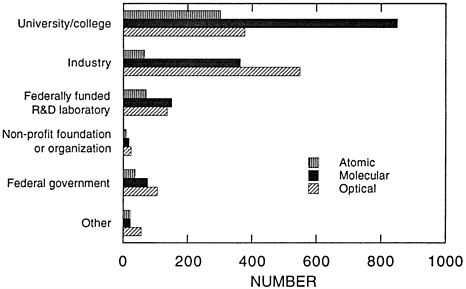
FIGURE D.3a Employment characteristics of respondents, broken down by major research area. The bars represent the number of respondents in each area in the employment sectors indicated.
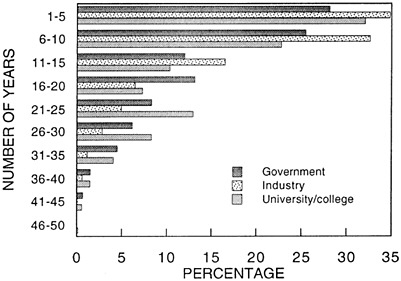
FIGURE D.3b The distribution of number of years that respondents have been employed by their present employer. The bars represent the percentage of respondents in each employment sector who have been employed for the time intervals indicated.
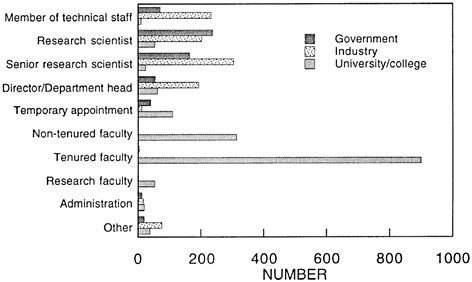
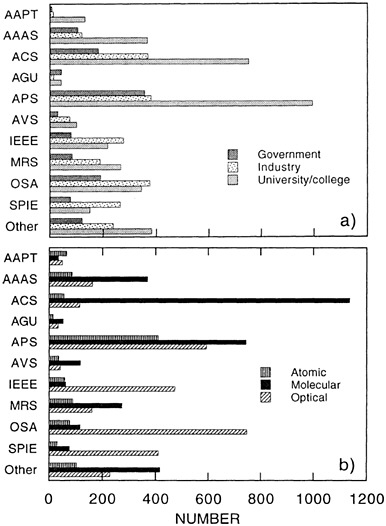
FIGURE D.5 Professional societies to which respondents belong, broken down by (a) employment sector and (b) major research area. The bars represent the number of respondents in each sector or area who are members of the societies indicated. [American Association of Physics Teachers (AAPT), American Association for the Advancement of Science (AAAS), American Chemical Society (ACS), American Geophysical Union (AGU), American Physical Society (APS), American Vacuum Society (AVS), Institute of Electrical and Electronics Engineers (IEEE), Materials Research Society (MRS), Optical Society of America (OSA), Society of Photographic and Instrumentation Engineers (SPIE).]
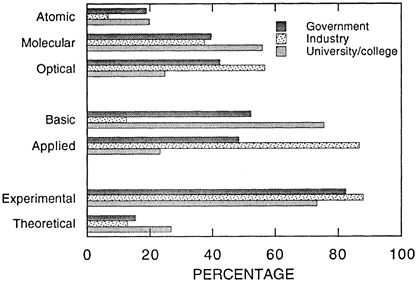
FIGURE D.6 Principal R&D activities and interests of respondents. The bars represent the percentage of respondents in each employment sector who characterized their principal R&D activities as indicated.
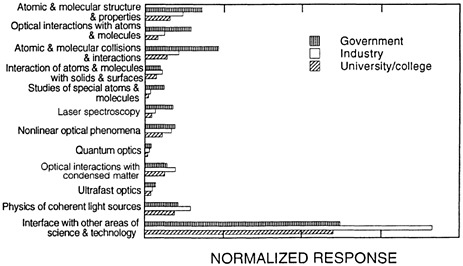
FIGURE D.7 Research specialties of respondents, broken down by employment sector. The topics included in each specialty are shown in the Research Specialties Directory (reproduced at the end of this appendix). The bars represent the number of responses in each listed specialty normalized to the number of respondents in each sector.
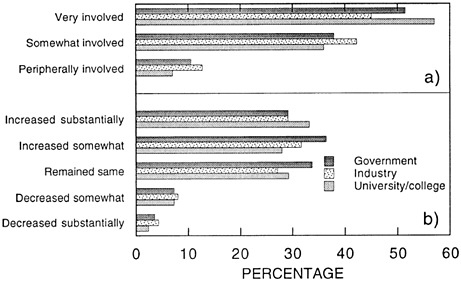
FIGURE D.8 (a) Level of involvement of respondents in collaborative research programs and (b) the history of this involvement, broken down by employment sector. The data set is limited to respondents undertaking collaborative R&D. The bars represent the percentage of these respondents whose level of involvement, and change in involvement over the past 5 years, is as indicated.
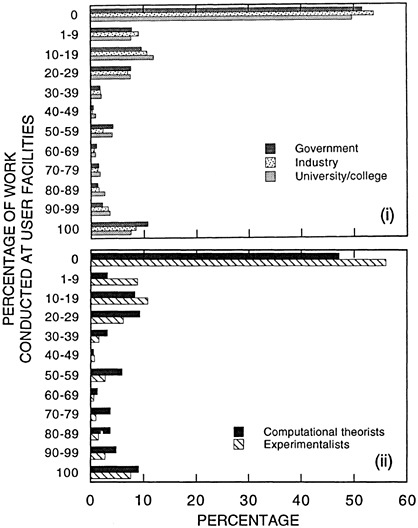
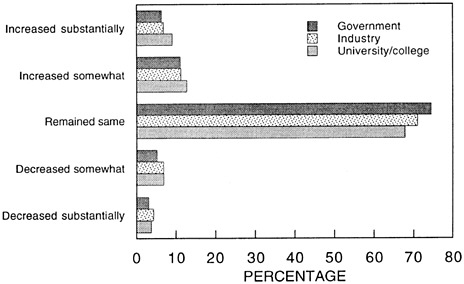
FIGURE D.9b Change in percentage of work conducted at user facilities over the past 5 years. The bars show the percentage of respondents in each employment sector who characterized the change in their involvement as indicated.

FIGURE D.10a Countries having significant R&D in the respondents' major area, broken down by major research area. The bars represent the percentage of respondents in each area who listed the countries indicated.
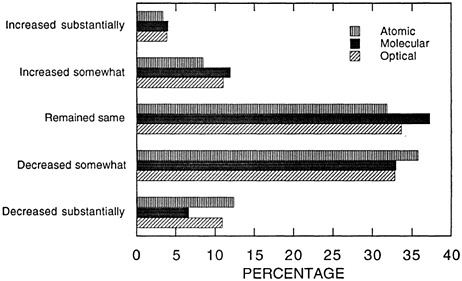
FIGURE D.10b Change in the relative U.S. contribution to the total world effort in the respondents' major research area over the past 5 years. The bars represent the percentage of respondents in each major research area who characterized the changes indicated.
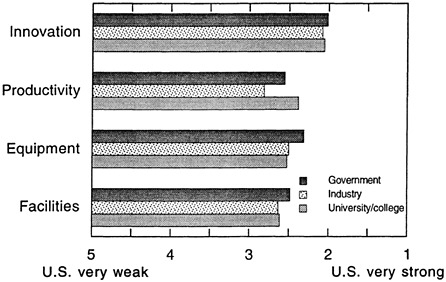
FIGURE D.11 Ranking of U.S. research efforts in the respondents' major research area in comparison to those in other countries, broken down by employment sector. The bars represent the mean ranking for each category indicated on a scale of 1 to 5.
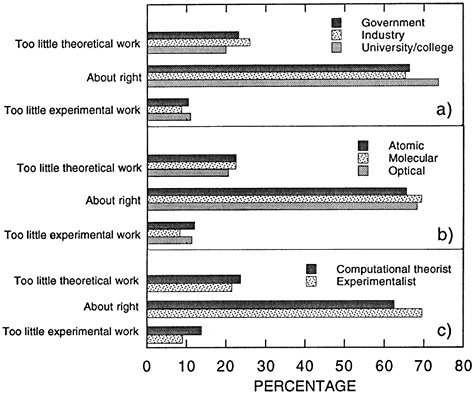
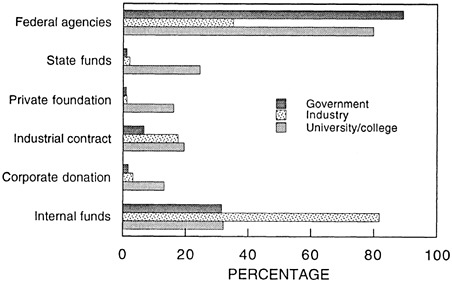
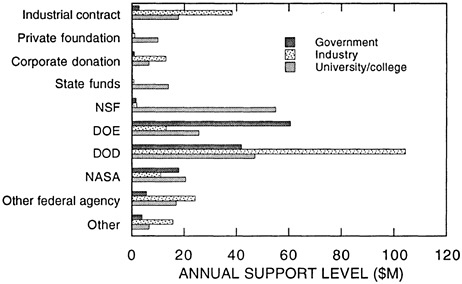
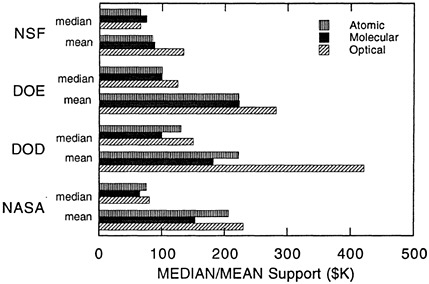
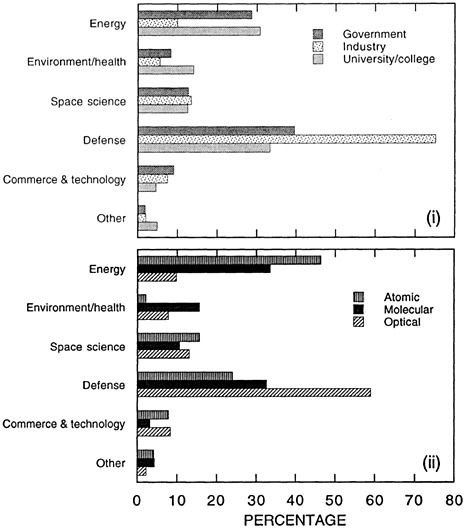
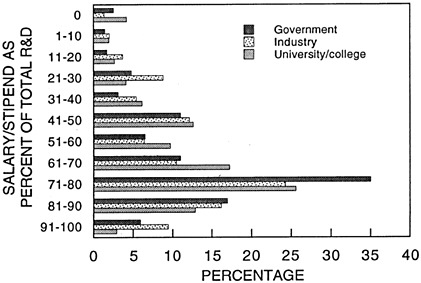
FIGURE D.16 Percentage of total R&D funding used by respondents in salary/ stipend support, broken down by employment sector. The bars represent the percentage of respondents with direct research funding who indicated each listed support level.
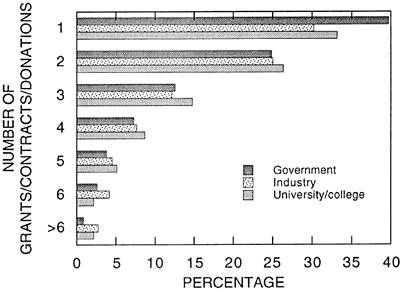
FIGURE D.17a Number of sources from which respondents receive research support, broken down by employment sector. The bars represent the percentage of respondents with direct research funding who reported each of the indicated number of sources.
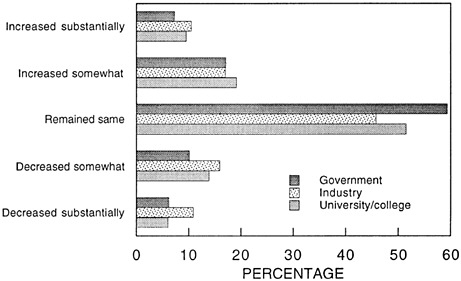
FIGURE D.17b Changes in the number of funding sources over the past 5 years, broken down by employment sector. The bars represent the percentage of respondents with direct research funding who characterized the change in number as indicated.
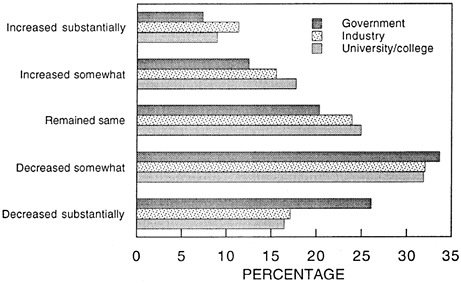
FIGURE D.18 Change in total research support over the past 5 years, broken down by employment sector. The bars represent the percentage of respondents with direct research funding who characterized their change in support as indicated.
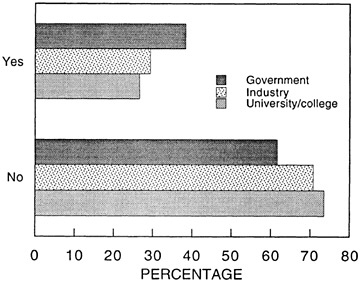
FIGURE D.19 Future funding patterns. The bars represent the percentage of respondents in each employment sector who r esponded ''yes" and "no" to the question, Should support for the strongest programs be increased at the expense of the total number of programs supported?
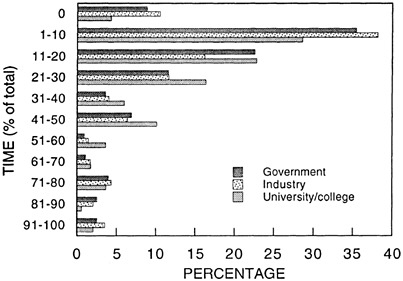
FIGURE D.20 Percentage of time that respondents spend pursuing research support. The bars represent the percentages of respondents in each employment sector who reported the time commitments shown.
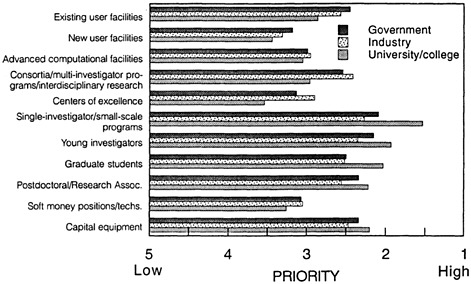
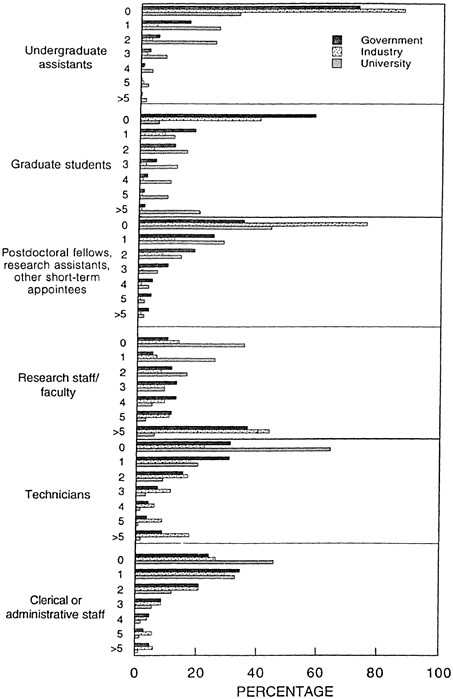
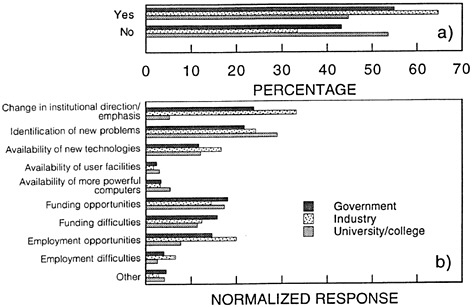
FIGURE D.23 Changes in research direction. (a) The percentage of respondents in each employment sector who reported changing (yes) and not changing (no) their major research emphasis in the past 5 years. (b) The reasons for this change. The data are normalized to the total number of respondents in each sector.
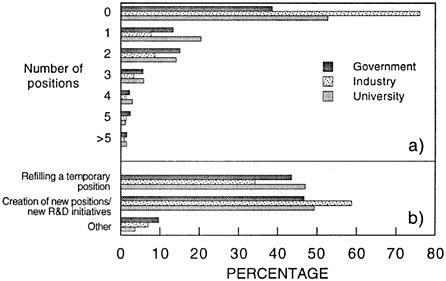
FIGURE D.24 Hiring patterns for temporary positions in AMO science over the past 3 years. The data are broken down by employment sector. (a) The distribution of the number of positions available in each sector. The bars represent the percentage of respondents in each sector who reported that the R&D group or team to which they belong hired or tried to hire the indicated number of AMO scientists to fill a temporary position(s). (b) The reasons these positions became available. The bars represent the percentage of responses in each category.
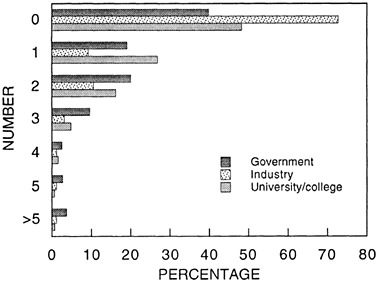
FIGURE D.25a Anticipated recruiting for temporary positions in AMO science. The bars represent the percentage of respondents in each sector who reported that the R&D group or team to which they belong will hire or try to hire the indicated number of AMO scientists to fill temporary positions in the next 3 years.
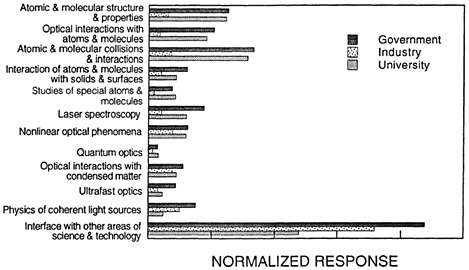
FIGURE D.25b Research specialties of likely candidates for temporary positions. The topics included in each specialty are shown in the Research Specialties Directory (reproduced at the end of this appendix). The data are broken down by employment sector. The bars represent the number of responses in each listed specialty, normalized to the number of respondents in each sector.
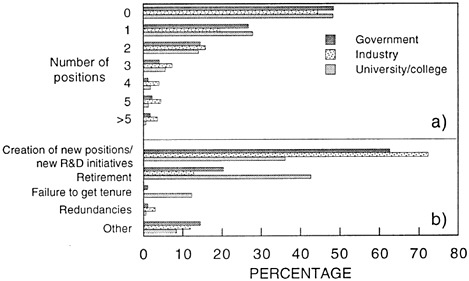
FIGURE D.26 Hiring patterns for permanent positions in AMO science over the past 3 years. The data are broken down by employment sector. (a) The distribution of the number of positions available in each sector. The bars represent the percentage of respondents in each sector who reported that the R&D group or team to which they belong hired or tried to hire the indicated number of AMO scientists to fill a permanent position(s). (b) The reasons these positions became available. The bars represent the percentage of responses in each category.
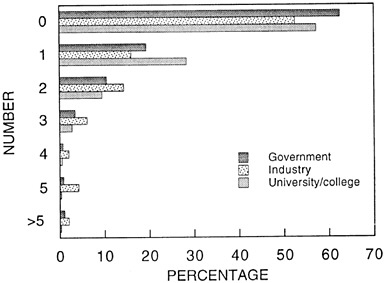
FIGURE D.27a Anticipated recruiting for permanent positions in AMO science. The bars represent the percentage of respondents in each employment sector who reported that the R&D group or team to which they belong will hire or try to hire the indicated number of AMO scientists to fill permanent positions in the next 3 years.
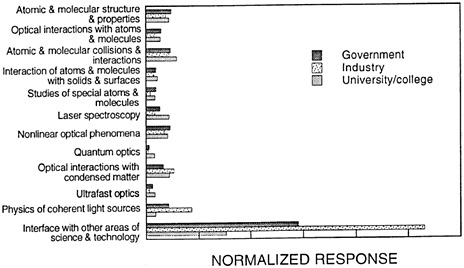
FIGURE D.27b Research specialties of likely candidates for permanent positions. The topics included in each specialty are listed in the Research Specialties Directory reproduced at the end of this appendix. The data are broken down by employment sector. The bars represent the number of responses in each listed specialty, normalized to the number of respondents in each sector.
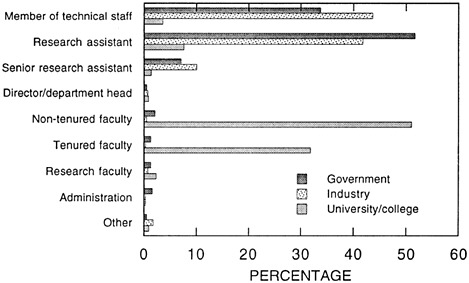
FIGURE D.27c The nature of future permanent positions, broken down by employment sector. The bars represent, for each sector, the percentage of available positions in each category.
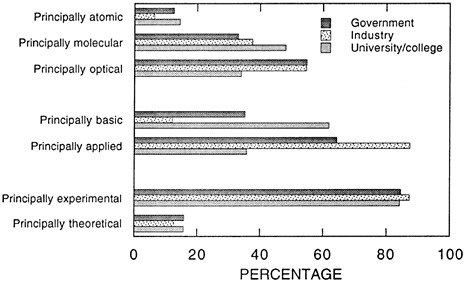
FIGURE D.27d Anticipated principal R&D activities and interests of likely candidates for permanent positions, broken down by employment sector. The bars represent the percentage of likely candidates with the different characteristics indicated.
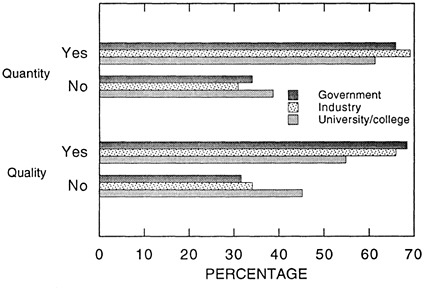
FIGURE D.28 Adequacy of human resources. The bars represent the percentage of respondents in each employment sector who believe that the human resources in their major research area are adequate (yes) or inadequate (no) to meet existing and future needs in terms of quantity and quality.
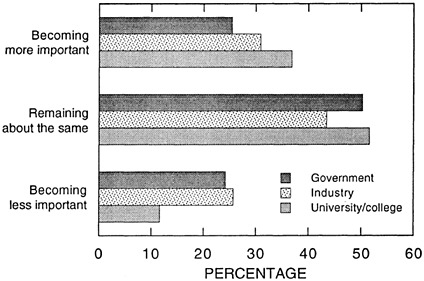
FIGURE D.29 The importance of AMO science. The bars represent the percentage of respondents in each employment sector who believe that AMO science in their organization is becoming more or less important, or remaining about the same.
RESEARCH SPECIALTIES DIRECTORY
ATOMIC AND MOLECULAR STRUCTURE AND PROPERTIES
|
01 |
RF, microwave and IR spectroscopy |
|
02 |
Visible and UV spectroscopy |
|
03 |
Oscillator strengths, transition moments, Franck-Condon factors |
|
04 |
Fluorescence and Phosphorescence, internal conversion |
|
05 |
Behavior in static fields |
|
06 |
Excited-state lifetimes |
|
07 |
Relativity, QED and parity violation effects |
|
08 |
Electron correlation effects |
|
09 |
Fundamental theory |
OPTICAL INTERACTIONS WITH ATOMS AND MOLECULES
|
10 |
Radiative transport, opacity |
|
11 |
Level crossing and optical pumping |
|
12 |
Photodissociation/molecular dynamics |
|
13 |
Photoionization/photodetachment, photoelectron spectroscopy |
|
14 |
Inner shell ionization, Auger processes |
|
15 |
Mechanical effects of light on atoms and molecules |
|
16 |
Intense field effects |
|
17 |
Photo-induced reactions, photochemistry |
ATOMIC AND MOLECULAR COLLISIONS AND INTERACTIONS
|
18 |
Ultracold collisions |
|
19 |
Transport phenomena, diffusion |
|
20 |
Interaction potentials and forces |
|
21 |
Rotational and vibrational energy transfer |
|
22 |
Reactive scattering, chemical kinetics |
|
23 |
Excitation, dissociation |
|
24 |
Charge transfer collisions, recombination |
|
25 |
Reaction rate constants and cross sections |
|
26 |
Electron impact excitation/ionization |
|
27 |
Polarization and orientation studies |
|
28 |
Development of special beam sources for AMO science |
|
29 |
Computational modelling, simulation |
|
30 |
Fundamental collision theory |
INTERACTION OF ATOMS AND MOLECULES WITH SOLIDS AND SURFACES
|
31 |
Channelling |
|
32 |
Atom/molecule-surface scattering |
|
33 |
Ion-surface scattering |
|
34 |
Properties of adsorbed atoms and molecules |
|
|
STUDIES OF SPECIAL ATOMS AND MOLECULES
|
35 |
Highly excited species |
|
36 |
Highly charged ions |
|
37 |
Exotic atoms and molecules |
|
38 |
Atomic and Molecular clusters |
LASER SPECTROSCOPY
|
39 |
Precision spectroscopy/Fundamental measurements |
|
40 |
High field effects in matter |
|
41 |
Multiphoton processes |
|
42 |
Trapping and cooling of atoms and molecules |
|
43 |
Novel techniques and concepts in spectroscopy |
|
44 |
Frequency measurement/absolute standards |
NONLINEAR OPTICAL PHENOMENA
|
45 |
Fundamental nonlinear optics |
|
46 |
Nonlinear optics in fiber, guided wave, and other structures |
|
47 |
Nonlinear optics at interfaces |
|
48 |
New nonlinear optical materials |
|
49 |
Phase conjugation |
|
50 |
Nonlinear spectroscopy |
QUANTUM OPTICS
|
51 |
Methods of production and properties of squeezed states |
|
52 |
Quantum aspects of light/Cavity QED |
|
53 |
Noise |
|
54 |
Nonlinear dynamics/Instabilities/Chaos |
|
55 |
Applications to fundamental measurements |
OPTICAL INTERACTIONS WITH CONDENSED MATTER
|
56 |
Interactions with liquids |
|
57 |
Interactions with solids, composites, superconductors |
|
58 |
Interactions with semiconductors and heterostructures |
|
59 |
Optical processes at surfaces and interfaces |
|
|
ULTRAFAST OPTICS
|
60 |
Methods for generation of ultrashort light pulses |
|
61 |
Ultrafast optical measurement techniques |
|
62 |
Ultrafast optical spectroscopy |
|
63 |
Applications of ultrafast optical pulses |
|
|
PHYSICS OF COHERENT LIGHT SOURCES
|
64 |
New sources and physical mechanisms, multiwave mixing |
|
65 |
XUV and X-ray lasers |
|
66 |
Gas lasers |
|
67 |
Solid state lasers |
|
68 |
Laser materials |
|
69 |
Free-electron lasers |
|
70 |
Semiconductor and quantum well lasers |
|
71 |
Non-linear dynamics in lasers |
INTERFACE WITH OTHER AREAS OF SCIENCE AND TECHNOLOGY
|
72 |
Computational methods |
|
73 |
Detector and imaging technology |
|
74 |
Materials characterization |
|
75 |
Laser materials processing |
|
76 |
Industrial applications of lasers |
|
77 |
Medical applications of lasers |
|
78 |
Application of lasers in biosciences |
|
79 |
Optical damage |
|
80 |
Optoelectronics |
|
81 |
Optical communications device design/fiber optic media engineering |
|
82 |
Optical data storage |
|
83 |
Microlithography, nanotechnology |
|
84 |
Holography |
|
85 |
Optical diagnostics |
|
86 |
Metrology |
|
87 |
Combustion science |
|
88 |
Laser-produced plasmas |
|
89 |
Plasma processing (CVD, etching, …) |
|
90 |
Fusion (MFE and ICF) |
|
91 |
Isotope separation |
|
92 |
Solar energy conversion |
|
93 |
Environmental/health science |
|
94 |
Aeronomy/Planetary science |
|
95 |
Astronomy and astrophysics |
|
96 |
Surface characterization |
|
97 |
Surface chemistry/catalysis |
|
98 |
Chemical analysis |


