
2
EXTRAMURAL FUNDING OF NEWLY INDEPENDENT INVESTIGATORS IN BIOMEDICAL RESEARCH
OVERVIEW OF FEDERAL SUPPORT OF LIFE-SCIENCE RESEARCH
The U.S. federal government in 1992 provided 43% of the national expenditure for life-science research and development; the remainder was provided primarily by industry with about 2% each from academe and nonprofit philanthropic and voluntary health organizations (130). Since 1980, the federal financial commitment to health research and development has steadily increased while support for other disciplines in the natural sciences (except space research) changed little (130). As a result, in recent years the major recipients of federal research funds have been life scientists (Figure 2-1).
In 1993, the federal government allocated over $6.6 billion for basic life-science research and $4.7 billion for applied life-science research. Those funds were distributed by a large number of federal agencies, as Table 2-1 indicates. Each federal agency has a specific mission, although missions overlap (40). Most of the funds for basic life-science research are allocated for biomedical research through the Department of Health and Human Services (DHHS), primarily through the National Institutes of Health (NIH). The Department of Agriculture (USDA), the Department of Energy (DOE), and the National Science Foundation (NSF) provide the majority of the funding for nonbiomedical life-science research, which is discussed in detail in Chapter 3.
Federal agencies dispense their funds for basic life-science research in a variety of ways. Some, such as the Department of Veterans Affairs, support
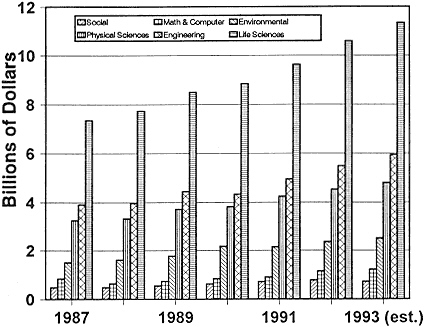
Figure 2-1
Federal obligations for total research, by detailed field of science and engineering, FY 1987–1993.
Source: NSF (133).
intramural programs exclusively. NSF relies entirely on external grants to support investigators at universities and research institutions. Most agencies-such as NIH, DOE, the Department of Defense, and USDA-use a combination of internal and external grants.
Most U.S. young investigators in the life sciences are employed at universities and research institutes and depend on extramural federal funding to initiate and support their independent research. Of all 1989–1990 doctoral recipients, 64% were employed by educational institutions, 16% by industry, 11% by government, and 9% by nonprofit organizations (unpublished data from the National Research Council 1991 Survey of Doctorate Recipients,
Table 2-1 Estimated Federal Obligations for Applied and Basic Research in Life Sciences, by Agency, FY 1992
|
Agency |
Applied Research, Thousands of Dollars |
Life Sciences as Percent of Total Applied-Research Budget |
Basic Research, Thousands of Dollars |
Life Sciences as Percent of Total Basic-Research Budget |
|
Department of Agriculture |
473,960 |
72.0 |
519,192 |
84.5 |
|
Department of Commerce |
85,872 |
17.3 |
n/a |
n/a |
|
Department of Defense |
205,443 |
6.8 |
128,316 |
11.7 |
|
Department of Education |
18,311 |
12.8 |
1,440 |
22.9 |
|
Department of Energy |
84,202 |
4.7 |
173,187 |
9.6 |
|
Department of Health and Human Services |
2,728,668 |
80.5 |
4,882,783 |
88.6 |
|
Department of the Interior |
95,392 |
28.5 |
6,300 |
2.7 |
|
Department of Justice |
400 |
2.4 |
300 |
0.6 |
|
Department of Transportation |
6,138 |
3.8 |
n/a |
n/a |
|
Department of Treasury |
160 |
0.75 |
n/a |
n/a |
|
Department of Veterans Affairs |
179,839 |
91.1 |
15,385 |
98 |
|
Agency for International Development |
287,590 |
87.2 |
3,953 |
79.6 |
|
Environmental Protection Agency |
128,362 |
41.1 |
40,662 |
39.5 |
|
National Aeronautics and Space Administration |
136,876 |
7.8 |
56,901 |
3.0 |
|
National Science Foundation |
9,682 |
7.5 |
280,988 |
15.5 |
|
Smithsonian Institution |
n/a |
n/a |
34,219 |
34.2 |
|
Tennessee Valley Authority |
2,458 |
11.2 |
1,862 |
82.8 |
|
Source: NSF (132). |
||||
personal communication from Dan Pasquini, Office of Scientific and Engineering Personnel). They begin to apply for research grants either shortly before assuming their new position or immediately thereafter. The grant application typically includes an outline of the investigator's research accomplishments, the rationale for the research, and a detailed description of the experimental plan. It is evaluated by the agency staff, a panel of external reviewers who are experts in the field, or a combination of the two (64,68,76,90,103,113,120,144). Proposals are then ranked according to the applicants' professional qualifications, the quality and importance of the proposed research, and the likelihood that the applicants can achieve their research aims. Grants are funded in descending order of rank; occasionally, out-of-order funding occurs to fulfill programmatic goals of the agency or to encourage newly independent scientists or particularly innovative and risky proposals.
A grant budget typically covers both the direct and indirect costs of performing the research. The direct costs may cover some portion of the salary of the principal investigator, the salaries of others who will carry out the research, supplies, travel, equipment purchases, and miscellaneous charges. All these expenditures are largely under the control of the principal investigator. Indirect costs defray institutional costs for carrying out the research, such as the costs of building maintenance, common facilities, and support services.
In addition to grants to individuals, many federal agencies provide grants to groups of scientists who have common research interests. These grants are designed to take advantage of the synergism that can result when several scientists collaborate on a common problem. For example, a core research facility might be funded to prepare monoclonal antibodies for a group to reduce duplication of effort in individual laboratories. Research program project grants (P01), center core grants (P30), and specialized center grants (P50) at DHHS are used by NIH1 for these purposes (146). Research program project grants are funded from the same part of the agency's budget
as individual investigator-initiated grants, whereas center grants are a separate line item in the federal budget.
Several federal agencies provide a flexible source of funds to local directors with allocations based on mathematical formulas that include the size of the research institution (see Chapter 3). Examples of this form of funding are the National Oceanic and Atmospheric Administration Sea Grant funds, the USDA Hatch Act funds, and Fish and Wildlife Cooperative Research Program funds. These funds, although not earmarked for newly independent investigators, are sometimes used by local institutions as startup funds to establish the laboratories of these investigators. NIH terminated such a program, the NIH Biological Research Support Grant (BRSG).
FEDERAL FUNDING OF BASIC BIOMEDICAL RESEARCH2
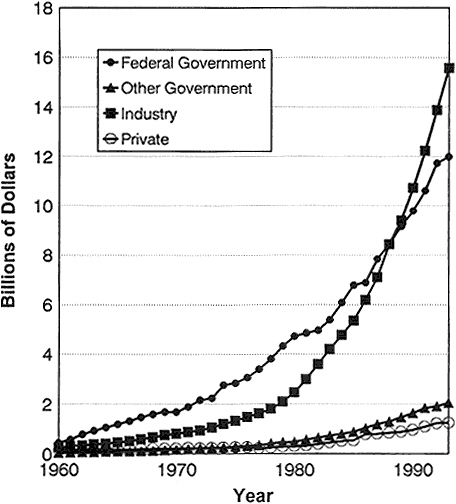
From the 1940s until the late 1980s, the federal government emerged as the major underwriter of biomedical research. Before 1940, philanthropy and industry outpaced the federal government in support of research in the biomedical sciences. In recent years, industry has surpassed government expenditures (Figure 2-2) (95). Nevertheless, spending by every sector has increased dramatically. For example, although the relative contribution by nonprofit organizations remained about the same between 1982 and 1992 as a percentage of the total biomedical research and development (R&D) budget (4%), the actual expenditures almost tripled from $390 million to $1,196 million (95).
The largest source of federal funds for biomedical research is NIH, whose primary mission is to improve the health of the U.S. population. With an annual budget of $8.4 billion in FY 1991, NIH provided approximately 29.2% of the national expenditure in health research and development (95). Of the
NIH budget, about 83% (Figure 2-3) went to extramural awards to independent hospitals, research institutions, and institutions of higher education in 1991 (95). The dominant role of NIH in funding biomedical research means that any perturbations in the manner in which its funds are distributed have profound effects on the nation's research.
GRANTING VEHICLES3
Extramural grants are funds provided by NIH for research, training, and contract support outside NIH. Research grants are extramural awards made for research projects, research centers, and other research. NIH groups research grants into activities and identifies them with activity codes; for example, research projects are coded as R01, R22, R23, R29, R35, R37, R44, P01, P42, U01, etc. The traditional research project grant (R01) is the long-standing principal vehicle for the support of extramural research by NIH, the Food and Drug Administration, the Centers for Disease Control and Prevention (CDC), and the Agency for Health Care Policy and Research. R01 grants were designed to support well-specified, discrete projects performed by principal investigators holding positions in universities, colleges, or research institutions (146). The grants have a term of 3–5 years, have no budget ceiling, and cover research-related expenses-such as equipment, supplies, and support-service charges-and the salaries of postdoctoral researchers, graduate students, and technicians. In recent years, R01 budgets have covered an increasing fraction of the salaries of the principal investigators. In FY 1991, the average term of NIH support for R01 grants was 3.8 years with an average annual total cost of $184,000 (95). Successful R01 applications require substantial technical and experimental justification and benefit greatly from extensive preliminary results, so newly independent researchers are at a disadvantage in competing for them.
In 1971, NIH initiated its first program in which newly independent investigators were distinguished as a cohort from more seasoned investigators. The goal of the New Investigator Research Award (R23) was to provide funds to launch the independent research programs of senior postdoctoral fellows
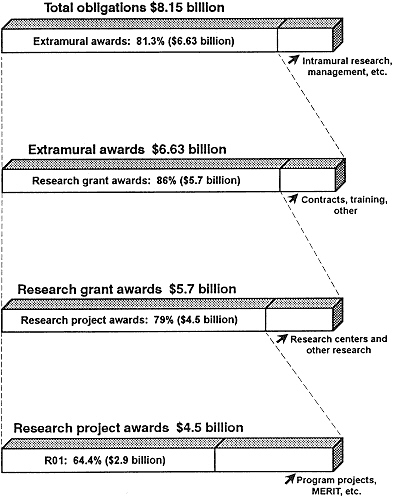
Figure 2-3 NIH obligations, FY 1991.
Source: NIH (95, Tables 8, 18, and 29).
in basic and clinical science (146). The grant was designed as a 3-year award with a maximum total value of $107,500.
The R23 program was phased out beginning in 1986. Its demise resulted from three underlying problems. First, as postdoctoral tenures lengthened beyond the 2–3 years normally supported by fellowship programs, the R23 grant became a mechanism whereby established investigators could support senior postdoctoral fellows in their laboratories. It was impossible for the peer-review panels to distinguish between R23 applicants who were truly independent and those who were not. Second, the small R23 grant budget discouraged applications from precisely the investigators that the grant was designed for-starting assistant professors. With the advent at many institutions of a requirement that assistant professors pay a substantial part (or even all) of their salaries from their research grants, the R23 budget limit proved particularly unattractive. Third, the restriction of the grant to 3 years required investigators to reapply for grants after just 2 years of funding. That encouraged less-risky, short-term experiments that were continuations of postdoctoral studies and discouraged the initiation of innovative research programs.
The R23 grant was replaced in 1986 by the R29 or First Independent Research Support and Transition (FIRST) Award. FIRST grants were developed to support the research of newly independent biomedical researchers-those genuinely independent of other principal investigators and in the initial stages of their research careers (87,99,146). R29 grants are unusual in that they are nonrenewable 5-year grants with a maximum direct cost of $350,000, or $70,000 per year. In FY 1990, after budget negotiations, the average R29 grant provided a direct cost of $64,612 per year. The longer funding period (i.e., relative to R23 grants) was intended to provide young scientists with sufficient time to demonstrate the creativity and productivity needed to obtain an R01 grant. From 1986 to 1993, almost 4,000 R29s were awarded by NIH and ADAMHA.
No formal procedure ensures that R29 applications are distinguished in the review or funding process from R01 applications. Both types of applications are reviewed by the same peer-review groups in the same sessions. In addition, funds for R29 grants are not separately budgeted by the NIH institutes; newly independent investigators compete for the same funds as their more seasoned colleagues. The burden of ensuring that new investigators are given a fair opportunity to compete for funds is on the members of the review groups or study sections at NIH that evaluate applications. In the committee members' experience, most study sections judge R29 applications more leniently than R01 applications. The reviewers tend to require less preliminary evidence that a proposed project will succeed
and overlook errors in ''grantsmanship,'' such as proposing far more than can be accomplished in the grant period.
The NIH staff and their advisory councils provide a second level of application approval and budget review. Some institutes have encouraged the out-of-order funding of some R29 applications whose scores were below the funding cutoff. In 1990, for example, the advisory council of NIAID decided to fund 40% of the approved R29 applications, irrespective of whether their scores were competitive with those of R01 applications.
The consequence of such practices is that a newly independent investigator has a somewhat greater likelihood of being funded through the R29 mechanism than through the R01 mechanism. For example, in 1993, the success rate, defined as the percentage of reviewed grant applications that are funded, was about 27% for R29 applications and about 21% for R01 applications (NIH/SAES data from Robert Moore and James Tucker).
R29 grants, which provide one avenue for improving the likelihood of funding of new biomedical investigators, are underused. In 1993, only 36% of new investigators under the age of 36 who applied for R01 or R29 grants chose R29 grants (NIH/SAES). The explanation lies in two drawbacks of the program. First, the direct-cost ceiling of $350,000, which is distributed over 5 years, is inadequate for many newly independent biomedical investigators who must support both research and salaries. The second drawback is ironically one of the program's strengths. The commitment of 5 years of stable support is important for a fledgling independent research project. Yet, by the fourth year of a successful program, the $70,000 budget is often insufficient to support the expanding scope of the research project and the efforts of additional graduate students and postdoctoral fellows. The investigator is then forced to write another grant application, an effort that is hindered by the restriction that the aims of the new grant cannot overlap with those stated in the original R29 application.
In addition to the R01 and R29 grants to support specific research projects, NIH sponsors grants that provide salary support to independent investigators. The most prestigious of these is the Research Career Development Award (RCDA or K04), a 5-year salary award for "persons who have demonstrated independent research accomplishments but need additional time in a productive, scientific environment to establish an independent research program" (94,146). To be eligible, a candidate must have "at least 5 years of postdoctoral research experience, including 2 years as the principal
investigator of an independent peer-reviewed research grant" (94,146). The novel aspect of this award is a "matching" requirement from the host institution to reduce teaching and administrative responsibilities during the duration of the award so that the recipient can focus on research. The award places no limit on an investigator's research plans or additional research support.
FUNDING ENVIRONMENT
In FY 1990, the Public Health Service-primarily through NIH, ADAMHA, and CDC-was funding almost 40,000 research-related grants amounting to a yearly expenditure of $6.4 billion. Because NIH supported the majority of the research, only the NIH statistics and programs are discussed here. The percentage of the NIH extramural research budget that is allocated to research projects and other types of research-related grants rose from 57% in 1980 to 81.3% in 1991 (see Figure 2-3). The individual institutes of NIH independently determine their research priorities, and this is reflected in the emphasis that each places on individual research grants versus larger project and center grants. In 1991, the National Cancer Institute (NCI) allotted the smallest percentage of funds (59%) to R01s; the percentages of the National Institute of Neurological Disorders and Stroke (83%), the National Eye Institute (79%), and the National Institute of General Medical Science (79%) were among the largest (95,101).
The confidence of newly independent investigators that they could reasonably expect initial funding for establishing a laboratory was eroded during the period 1985–1990 by the sharp decline in the percentage of new and competitively funded grants from NIH (Figure 2-4). As the number of their applications rose from 18,470 to 20,154 during that period, the success rate declined. The overall success rate had remained roughly constant over 1985–1988 at around 35%. The rate fell in 1989 to 28% and in 1990 to about 25%. There was an apparent rebound in the success rate in 1991 (Figure 2-4), but it dropped to the low 20% range in 1993. The indicated rebound in success rates in 1991 must be considered in the light of other events that were occurring. NIH counts amended applications (applications that are resubmissions of previously unsuccessful applications) only once if they are submitted in the same fiscal year. That is, even if an application is reviewed more than once in one fiscal year, it is counted only once for purposes of calculating the annual success rate. As the success rate fell from 1988 to 1990, the number of amended R01 applications reviewed by NIH increased by 27% (91,104). By 1990, 31% of all applications and 41% of competing renewal
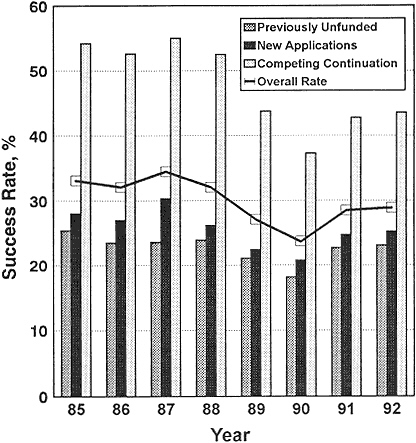
Figure 2-4 Success rates of all (except ADAMHA) NIH competing research-project applications, FY 1985–1992.
Source: NIH (102).
applications reviewed by the study sections were amended applications (104). Because applications that are amended (and they are often extensively revised) are counted only once, the success rate appears higher than it would if amended applications were treated as separate submissions. The success rates calculated by including and excluding amended applications are different by a factor that is directly proportional to the fraction of amended applications
submitted to NIH. In fact, at some of the smaller NIH institutes, the success rate fell from 1991 to 1992 to about 10% of reviewed applications.
The decrease in the success rate is attributed to several causes. First, a 1986 policy change within NIH increased the length of research grants. Previously, both new and competing renewal applications were usually funded for 3 years, with 5-year grants restricted to seasoned investigators with proven track records. The result was that the average period for which funds were committed to a project was 3.3 years (89). The primary problem with 3-year grants was that investigators were required to submit competing renewal applications after 2.3 years of work. The consensus among the study sections, advisory councils, and investigators was that 2.3 years was not sufficient to generate adequate data to judge the success of a project. That was especially true for new investigators, who were beginning projects and establishing laboratory groups simultaneously.
Several steps were set in motion in response to that concern and to make grant application and review more efficient. First, the 3-year R23 grant was replaced with the 5-year R29 grant. Second, study sections were required by most advisory councils to justify any reduction in the term of a competing renewal request. Third, in 1986, several new programs were initiated to provide 7 or 10 years of support for well-established investigators.
The Method to Extend Research in Time Award (MERIT or R37 award) (146) consists of an initial 5-year grant that can be extended for 3–5 years by action of the advisory council alone on the basis of a highly abbreviated renewal application. R37 grants are restricted to investigators whose "research competence and productivity are distinctly superior and who are likely to continue to perform in an outstanding manner" (146). Investigators could not apply for MERIT grants; rather, study sections could make recommendations to institute staff, who selected those likely to continue productive careers. The applications were then presented to the advisory councils for approval. By 1990, a total of 895 MERIT grants had been given, representing 5.3% of the research-project grants budget and 8.3% of the competing and continuation R01 budget. By 1993, 1,789 MERIT grants had been awarded since inception of the program.
Another new long-term grant, the Outstanding Investigator Grant (OIG or R35), also provides long-term support (7 years) to proven investigators (146). It differs from MERIT awards in that investigators may apply for them through the regular peer-review channels. R35 grants are designed to
consolidate an investigator's support from two or more funded research-project grants within an institute with new funds for innovative research. Compared with the R37 program, the R35 program is small. NCI is the primary distributor of the R35 grant (93,95).
The increase in the average term of an NIH grant resulted in an increase in grant period from 3.3 years in 1980 to 4.2 years in 1990 (95). That meant that a greater percentage of the extramural-research dollars was unavailable for new grants in the fourth and fifth years of the new programs. The percentage of the extramural budget that was tied up in the noncompeting continuation of funded projects rose from 66% in 1985 to 77% in 1990 (Figure 2-5) (88,95,145). The percentage of funds committed to noncompeting continuations fell in 1991 to 73% and in 1992 to 71%, indicating that the system is slowly beginning to adjust as NIH strives for an average grant length of 4 years to improve the prospects for new grants.
Two additional financial pressures exacerbated the decline in the funds available for supporting new projects and the decline in success rate (12). First, the average size of a research grant rose steadily throughout the 1980s and into the 1990s, from $100,400 in 1982 to $163,400 in 1989 and $184,800 in 1991 in current dollars (89,93,95). Even if the higher rate of inflation in research costs than in other costs is accounted for with the Biomedical Research and Development Price Index, there was a 15% increase from 1982 to 1991. The majority of that increase was due to increases in indirect costs, which rose rapidly between 1980 and 1985 and then stabilized considerably (89,95). Second, the inflation-corrected NIH extramural budget has been essentially flat since 1987 (91). Thus, while the average cost of a grant has increased, the total number of dollars available has not kept pace.
As the success rate declined to the 20% range in the late 1980s in response to those changes, there was a growing belief within the scientific community that the peer-review system is not prepared to distinguish properly among grant applications whose ranking is close to the dividing line between those which will and those which will not be funded. When the success rate stood at 35%, funding was essentially ensured for all the best investigators. As the success rate has declined, study sections have been increasingly uncomfortable in making fine distinctions among applications that are deemed highly meritorious. The difficulty in making those distinctions has led to an erosion in confidence in the peer-review system and the growth of the perception that luck plays a major role in the fate of a grant application.
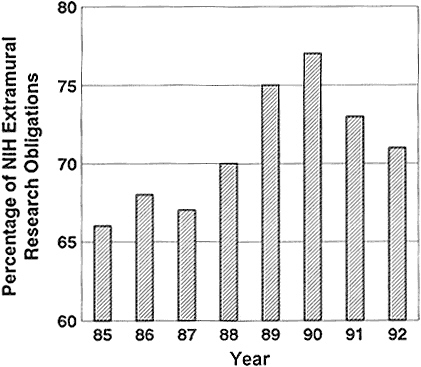
Figure 2-5 Percentage of NIH extramural obligations used in noncompeting continuation of funded projects.
Source: NIH (102).
It is the decline in the success rate at NIH that causes the greatest concern to newly independent biomedical investigators (40,48,49). During their tenure as graduate students and postdoctoral fellows, they see well-established investigators with proven track records failing to renew sources of funding and outstanding younger scientists competing unsuccessfully for grants as independent investigators. They also see both types of investigators spending far greater amounts of time in writing grant applications.
A disproportionate decline in the success rate of previously unfunded applicants at NIH, compared with established investigators submitting new applications and competing continuation applications, is suggested by results of a comparison of the success rate of previously unfunded applications with that of competing renewal applications for previously funded projects. In 1992, 43.5% of competing continuation research-project grant renewals were successful, independently of the ages of the investigators; the success rate was down substantially from 55% in 1987 but was still considerably above the new-application success rate of previously unfunded applications of 23.1% (91). Those figures leave the impression that the NIH peer-review system seems to favor continuation of existing programs, rather than encouraging new ones. Such a policy would present a disadvantage to both newly independent investigators and established investigators who submit new grant applications. In fact, the comparison between the success rates of new and competing renewal applications is affected by the fact that the cohort applying for renewal funds has successfully competed in at least one round of peer review, so it is a preselected group, and success rates would be expected to be higher than for new proposals.
Perhaps a more accurate way to determine whether the funding crisis has presented a disadvantage to newly independent investigators is to compare the decline in this age group's success rate with that of other age groups. Figure 2-6 displays by age groups the 1985–1993 success rates for competing R01 applications. The numbers show that the adverse effects of the decline in the success rate were shared among all age groups. Nevertheless, before 1989, investigators under 41 years old achieved the highest success rates for R01 applications at NIH. Beginning in 1989 and continuing through 1991, there was a change in this pattern such that investigators under 41 years old were less successful than many of their more senior colleagues in competing for R01 grants. Thus, the perception by young investigators is borne out that more-experienced investigators were more successful in the competition for funds during the period when overall success rates reached a low point in 1990 and during the period when success rates rose in 1991. By 1992, younger investigators again had the highest success rates among all age groups, but when overall success rates decreased sharply again in 1993, young investigators' success rates decreased to near the average for all age groups—their marginal advantage was decreased.
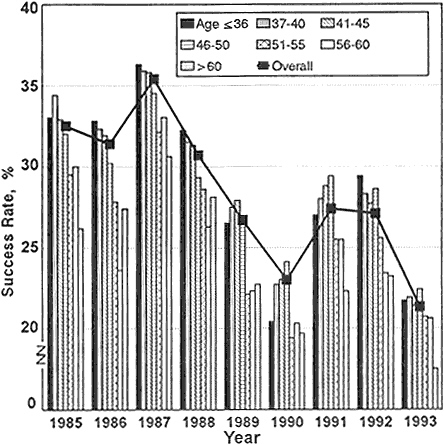
Figure 2-6 Success rates of R01 NIH research-project applications, by age of applicant, FY 1985–1992.
Source: Personal communication, Robert Moore, NIH, DRG, ISB, SAES.
Table 2-2 and Figure 2-7 provide data on events concurrent with changes in success rates during the period 1985–1993 (see appendix for complete data and notes about them). The data show that:
-
Applications for R01 grants from investigators age 36 and under dropped from 3,040 in 1985 to 1,389 in 1993, a 54% decrease. At the
-
same time, applications from investigators 37 and older increased from 14,630 to 17,925.
-
The number of R01 grants awarded to persons 36 and younger dropped from 1,002 in 1985 to 302 in 1993 (70% decrease) while the number of awards to investigators 37 and older decreased from 4,749 to 3,819 (20% decrease).
-
The creation of the R29 grant program in 1986 did not stem the decrease in the number of grants for young investigators. The number of R23 awards (predecessor of the R29 grants) in 1985 to persons 36 and younger was 306; in 1993, they received 225 R29 awards. The number of R01 plus R23/R29 awardees in this age group was 1,308 in 1985 and 527 in 1993, a 60% decrease. The number of awards to investigators 37 and older decreased from 4,600 to 4,032, a 12% decrease.
-
In 1985, 21% of all applications for R01 plus R23/R29 grants were from persons under 37, and in 1993, 10% of the applications were from persons in that age group.
The committee believes that the reduction in numbers of young applicants and awards to them demonstrates, more than the small changes in success rates, a problem that has serious implications for the future of the life sciences. This report calls attention to these facts. Because the committee wishes to make these data available without further delay, it has not attempted to determine the causes of these events, but we believe that it is imperative to initiate such a study.
The events described above do not reflect the differential effects of the decline on the morale of the two groups. A seasoned investigator might have multiple sources of funding, which confer some degree of insulation from the loss of one grant or failure to secure a new grant. Likewise, established investigators tend to be far more philosophical about changes in the funding environment, having already experienced similar fluctuations. It is the newly independent investigator, at the beginning of a research career for which he or she has trained for many years, that feels the effects of the decreased success rate most severely. The committee believes that encouraging greater numbers of newly independent investigators to remain in academic science is important because this cohort represents the future of basic-science research.
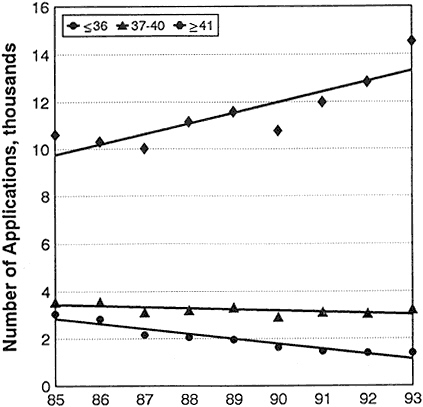
Figure 2-7 Numbers of applications for competing R01 grants, by age.
Source: Personal communication, Robert Moore, NIH, DRG, ISB, SAES.
To be so encouraged, newly independent investigators must have an advantage in applying for funding.
One innovative response of NIH to the decline in the success rate was the creation of the James A. Shannon Director's Award. This award provides funds for high-quality R01 and R29 proposals that were approved but not funded (24,92). Proposals are nominated by institutes for review by an 11-member NIH advisory panel, and final funding decisions are made by the
Table 2-2 Number of Applications, Success Rates, and Number of Awards for Competing NIH R01 and R23/29 Grants, by Age
|
Age |
≤36 |
37 – 40 |
41 – 45 |
46 – 50 |
||||||||
|
Fiscal Year |
No. of Apps. |
Success Rate |
No. Supported |
No. of Apps. |
Success Rate |
No. Supported |
No. of Apps. |
Success Rate |
No. Supported |
No. of Apps. |
Success Rate |
No. Supported |
|
R01 Applications by Age |
||||||||||||
|
1985 |
3,040 |
33.0 |
1,002 |
3,547 |
34.4 |
1,221 |
4,061 |
32.9 |
1,338 |
2,637 |
32.0 |
843 |
|
1986 |
2,823 |
32.8 |
927 |
3,556 |
32.3 |
1,150 |
4,019 |
31.9 |
1,281 |
2,514 |
30.2 |
759 |
|
1987 |
2,160 |
36.3 |
784 |
3,132 |
35.9 |
1,123 |
3,804 |
35.8 |
1,362 |
2,592 |
34.5 |
893 |
|
1988 |
2,059 |
32.2 |
662 |
3,207 |
31.5 |
1,011 |
4,155 |
31.3 |
1,299 |
3,092 |
29.3 |
906 |
|
1989 |
1,945 |
26.5 |
516 |
3,316 |
27.5 |
913 |
4,137 |
27.9 |
1,153 |
3,259 |
26.7 |
871 |
|
1990 |
1,621 |
20.4 |
330 |
2,910 |
22.7 |
661 |
3,792 |
23.0 |
872 |
3,050 |
24.1 |
736 |
|
1991 |
1,458 |
27.0 |
393 |
3,112 |
28.0 |
872 |
4,275 |
28.8 |
1,231 |
3,355 |
29.4 |
986 |
|
1992 |
1,393 |
29.4 |
410 |
3,054 |
28.3 |
863 |
4,448 |
27.7 |
1,230 |
3,542 |
28.6 |
1,014 |
|
1993 |
1,389 |
21.7 |
302 |
3,231 |
21.9 |
708 |
4,983 |
21.4 |
1,066 |
4,003 |
22.4 |
895 |
|
R23 and R29 Applications by Age |
||||||||||||
|
1985 |
786 |
38.9 |
306 |
214 |
28.5 |
61 |
73 |
23.3 |
17 |
17 |
17.6 |
3 |
|
1986 |
711 |
37.6 |
267 |
190 |
27.9 |
53 |
66 |
28.8 |
19 |
18 |
11.1 |
2 |
|
1987 |
1,234 |
27.6 |
340 |
519 |
21.4 |
111 |
202 |
18.8 |
38 |
49 |
10.2 |
5 |
|
1988 |
1,207 |
34.2 |
413 |
594 |
29.5 |
175 |
245 |
24.5 |
60 |
55 |
16.4 |
9 |
|
1989 |
957 |
34.1 |
326 |
563 |
29.7 |
167 |
182 |
22.0 |
40 |
41 |
14.6 |
6 |
|
1990 |
803 |
27.1 |
218 |
473 |
30.0 |
142 |
166 |
19.9 |
33 |
40 |
7.5 |
3 |
|
1991 |
760 |
33.9 |
258 |
508 |
28.7 |
146 |
187 |
22.5 |
42 |
47 |
25.5 |
12 |
|
1992 |
791 |
35.8 |
283 |
620 |
31.1 |
193 |
226 |
26.5 |
60 |
50 |
20.0 |
10 |
|
1993 |
787 |
28.6 |
225 |
669 |
28.3 |
189 |
307 |
21.2 |
65 |
68 |
23.5 |
16 |
|
R01 and R23/R29 Applications by Age |
||||||||||||
|
1985 |
3,826 |
34.2 |
1,308 |
3,761 |
34.1 |
1,282 |
4,134 |
32.8 |
1,355 |
2,654 |
31.9 |
846 |
|
1986 |
3,534 |
33.8 |
1,194 |
3,746 |
32.1 |
1,203 |
4,085 |
31.8 |
1,300 |
2,532 |
30.1 |
761 |
|
1987 |
3,394 |
33.1 |
1,124 |
3,651 |
33.8 |
1,234 |
4,006 |
34.9 |
1,400 |
2,641 |
34.0 |
898 |
|
1988 |
3,266 |
32.9 |
1,075 |
3,801 |
31.2 |
1,186 |
4,400 |
30.9 |
1,359 |
3,147 |
29.1 |
915 |
|
1989 |
2,902 |
29.0 |
842 |
3,879 |
27.8 |
1,080 |
4,319 |
27.6 |
1,193 |
3,300 |
26.6 |
877 |
|
1990 |
2,424 |
22.6 |
548 |
3,383 |
23.7 |
803 |
3,958 |
22.9 |
905 |
3,090 |
23.9 |
739 |
|
1991 |
2,218 |
29.4 |
651 |
3,620 |
28.1 |
1,018 |
4,462 |
28.5 |
1,273 |
3,402 |
29.3 |
998 |
|
1992 |
2,184 |
31.7 |
693 |
3,674 |
28.7 |
1,056 |
4,674 |
27.6 |
1,290 |
3,592 |
28.5 |
1,024 |
|
1993 |
2,176 |
24.2 |
527 |
3,900 |
23.0 |
897 |
5,290 |
21.4 |
1,131 |
4,071 |
22.4 |
911 |
|
Source: Personal communication, Robert Moore, NIH, DRG, ISB, SAES. |
||||||||||||
|
Age |
51–55 |
56–60 |
>60 |
||||||
|
Fiscal Year |
No. of Apps. |
Success Rate |
No. Supported |
No. of Apps. |
Success Rate |
No. Supported |
No. of Apps. |
Success Rate |
No. Supported |
|
R01 Applications by Age |
|||||||||
|
1995 |
1,660 |
29.0 |
482 |
1,225 |
30.0 |
367 |
1,021 |
26.2 |
267 |
|
1986 |
1,641 |
28.3 |
465 |
1,144 |
23.6 |
270 |
989 |
27.4 |
271 |
|
1987 |
1,559 |
30.8 |
480 |
1,141 |
33.0 |
376 |
928 |
30.6 |
284 |
|
1988 |
1,662 |
28.0 |
465 |
1,213 |
26.3 |
319 |
1,039 |
28.1 |
292 |
|
1989 |
1,894 |
23.2 |
439 |
1,175 |
22.3 |
262 |
1,105 |
22.7 |
251 |
|
1990 |
1,825 |
20.9 |
382 |
1,051 |
20.3 |
213 |
1,048 |
19.7 |
206 |
|
1991 |
2,033 |
25.4 |
516 |
1,153 |
25.5 |
294 |
1,168 |
22.3 |
260 |
|
1992 |
2,316 |
24.3 |
562 |
1,271 |
23.4 |
297 |
1,258 |
23.2 |
292 |
|
1993 |
2,722 |
20.3 |
553 |
1,361 |
20.6 |
281 |
1,469 |
17.5 |
257 |
|
R23 and R29 Applications by Age |
|||||||||
|
1985 |
4 |
25.0 |
1 |
1 |
0.0 |
0 |
0 |
|
0 |
|
1986 |
4 |
0.0 |
0 |
4 |
25.0 |
1 |
3 |
0.0 |
0 |
|
1987 |
13 |
15.4 |
2 |
6 |
0.0 |
0 |
1 |
0.0 |
0 |
|
1988 |
15 |
0.0 |
0 |
5 |
0.0 |
0 |
5 |
20.0 |
1 |
|
1989 |
12 |
25.0 |
3 |
2 |
0.0 |
0 |
2 |
0.0 |
0 |
|
1990 |
15 |
13.3 |
2 |
4 |
0.0 |
0 |
1 |
0.0 |
0 |
|
1991 |
13 |
15.4 |
2 |
4 |
75.0 |
3 |
2 |
0.0 |
0 |
|
1992 |
9 |
55.6 |
5 |
1 |
0.0 |
0 |
1 |
0.0 |
0 |
|
1993 |
18 |
11.1 |
2 |
3 |
0.0 |
0 |
0 |
|
0 |
|
R01 and R23/R29 Applications by Age |
|||||||||
|
1985 |
1,664 |
29.0 |
483 |
1,226 |
29.9 |
367 |
1,021 |
26.2 |
267 |
|
1986 |
1,645 |
28.3 |
465 |
1,148 |
23.6 |
271 |
992 |
27.3 |
271 |
|
1987 |
1,572 |
30.7 |
482 |
1,147 |
32.8 |
376 |
929 |
30.6 |
284 |
|
1988 |
1,677 |
27.7 |
465 |
1,218 |
26.2 |
319 |
1,044 |
28.1 |
293 |
|
1989 |
1,906 |
23.2 |
442 |
1,177 |
22.3 |
262 |
1,107 |
22.7 |
251 |
|
1990 |
1,840 |
20.9 |
384 |
1,055 |
20.2 |
213 |
1,049 |
19.6 |
206 |
|
1991 |
2,046 |
25.3 |
518 |
1,157 |
25.7 |
297 |
1,170 |
22.2 |
260 |
|
1992 |
2,325 |
24.4 |
567 |
1,272 |
23.3 |
297 |
1,259 |
23.2 |
292 |
|
1993 |
2,740 |
20.3 |
555 |
1,364 |
20.6 |
281 |
1,469 |
17.5 |
257 |
NIH director. Shannon grants are for $100,000 allocated over 2 years, with an indirect-cost ceiling of 25% (or a maximum of $20,000). The NIH director used $15 million from the director's discretionary fund and $15 million collected through the director's transfer authority to support 310 researchers at 146 institutions in 1991, the award's first year (50). Although this remains a small program, it provides an important safety net for those who succeed in obtaining these funds.
NONFEDERAL FUNDING AND MECHANISMS OF SUPPORT OF LIFE-SCIENCE RESEARCH
The federal government is the predominant source of funding for life-science research, but support is also derived from state governments, academic institutions, philanthropic and voluntary health organizations, and industry (10,21,125). When considered as a whole, the spectrum of research activities supported is similar to that supported by the federal government, but the research scope of any one funding source is generally much more focused. For example, an industry typically funds applied research or development work in fields directly related to its own interests (126). Likewise, private philanthropies, voluntary health organizations, and industry-supported foundations generally focus on a single research topic or disease.
Through institutional support of research and development—about $6 billion in 1993 for all fields (112)—academic institutions provide funds for their own researchers. Because these institutions design and negotiate startup packages, they play a critical role in the funding of newly independent investigators. These startup packages provide for salary and research support, laboratory remodeling, and equipment purchase. Funds for the packages are derived from indirect-cost recovery, grants from federal and state agencies and nonprofit organizations, and endowment income and taxes.
Nonfederal sources usually provide grants that are smaller in amount and of shorter duration (1–2 years) than federal sources. The grants often contain salary and overhead restrictions and matching-fund requirements. However, these programs are important sources of funds during the first few independent years; they can supplement and extend the startup funds provided by universities to new investigators.
INDUSTRY
The U.S. pharmaceutical industry invested about $8 billion in R&D in 1989 and $9.2 billion in 1991. The latter figure represents 16% of total sales-a high level of investment. Within the industry, R&D expenditures rose at an estimated 16% per year from 1979 to 1989. Several factors contributed to the rapid increase in investment levels; one is industry leaders' perception of the level of investment required to remain competitive.
Within the scope of the subject of this report, there are two issues of vital importance for the U.S. pharmaceutical industry. First, the industry needs a continuous source of trained biologists; an estimated one-third will need to have at least doctoral and also postdoctoral training. Second, the industry needs a strong fundamental science base derived from discoveries made in universities and independent research institutes on which to build its own applied research.
Drug discovery is an applied-research problem that builds on fundamental knowledge and technology. Much contemporary pharmaceutical research rests on newly acquired knowledge of cell growth and differentiation, cell recognition and communication, the molecular organization of cells, the structure of macromolecules (proteins, DNA, and RNA), receptor structure and function, cell signaling pathways, and gene regulation. Moreover, the research in the pharmaceutical industry is being transformed by the new technologies developed elsewhere, such as those used in gene cloning and expression, gene and protein sequencing and synthesis, production of monoclonal antibodies, cell-culture technology, x-ray crystallography and computer graphics, nuclear magnetic resonance studies, and the development of transgenic animals as models of human disease.
The information-base and technology development has relied heavily on university-based research, which benefits not only U.S. pharmaceutical companies, but also physicians and patients around the world. A long time is required for the economic and medical benefits of fundamental research to be realized: successful commercial innovations can lag fundamental discoveries by 30–50 years. For example, the determination of the double-helical structure of DNA was presented by Watson and Crick in 1953, preceding by about 30 years the successful commercial production of the first recombinant therapeutic proteins. In the United States, human insulin, human growth hormone, and human alpha-interferon were introduced as drugs produced by recombinant methods in 1982, 1985, and 1986, respectively.
The lag from the appearance of enabling technology to successful commercial production can be 10–15 years. The enabling technology that permitted the commercial innovations just noted was the demonstration in 1973 that chimeric plasmids containing foreign DNA fragments could be created and functionally inserted into the bacterium Escherichia coli. A strong, productive academic research enterprise is critical for making the enabling discoveries and providing the additional knowledge needed for introduction into the marketplace. A weakened basic-research endeavor or a decrease in the availability of trained scientists would have a damaging effect on the competitiveness of the U.S. pharmaceutical industry.
Pharmaceutical and biotechnology companies have developed a variety of ways of providing extramural support for research. These include training and research grants to universities; university-industry liaison programs and joint mentorship of graduate students; graduate and postdoctoral fellowships; postdoctoral positions in industry and federal laboratories; university-industry cooperative research alliances; charitable support via company-funded foundations or fellowships in federal laboratories; funds for equipment, travel, and sabbaticals; and matching funds for NSF's Presidential Young Investigator awards.
Members of the Pharmaceutical Manufacturers Association and the Industrial Biotechnology Association were surveyed for their approach in funding basic research. The 47 respondents indicated that their inhouse and off-site postdoctoral research support increased from an average of $528,000 and $185,000 per company, respectively, in 1985 to $2,634,000 and $219,000 per company in 1990. Targeted grants are the most commonly used vehicle, although institutional grants, gifts, indirect funding via faculty support, and cooperative research and development agreements (CRADAs) are also used.
A small number of newly independent investigators are supported through industrial research grants. This type of funding has increased more slowly than postdoctoral support, from an average of $518,000 per company in 1985 to $747,000 in 1990. In addition to targeted research grants, vehicles include gifts, institutional grants, consulting agreements, and contracts. Survey respondents indicated that their preferred solutions to the perceived impending shortage of scientists were to enhance high-school programs and to increase federal and industrial support of trainees and newly independent investigators.
The relatively small proportion of funds expended to support newly independent investigators reflects a bias in industry in favor of established investigators and their postdoctoral researchers, who are likely to obtain data more expeditiously. Supporting a new investigator is more risky and requires a longer-term commitment.
PHILANTHROPY
Philanthropic and voluntary health agencies provide support for biomedical research, often emphasizing awards for the young investigator. Because of the variety of such organizations and the varied terms, amounts, and conditions of their awards, it is difficult to determine the degree to which such support made up for the decrease in support of young investigators by NIH and NSF during the late 1980s. It is safe to assume that their role, although important, was smaller than that of the federal agencies, which have vastly greater resources. For example, the largest of the philanthropic institutions, the Howard Hughes Medical Institute, supports over 200 investigators, more than one-third of whom are assistant investigators (and probably less than 41 years old). But NIH awarded 1,421 R01 and R29 grants to investigators under 41 in 1993 alone.
Young Investigator Programs
The philanthropic foundations are a diverse group of organizations that fund initiatives in public welfare, education, religion, liberal arts, and environmental concerns, as well as basic science. The Foundation Directory lists 7,581 private and community foundations that each have at least $1 million in assets or provide at least $100,000 in annual funding (20). These organizations have been highly responsive to the needs of young investigators, as reflected in their programs that target young investigators. Although their awards are few, they are prestigious (6,16,31,36,51). Some examples are highlighted below.
-
The Pew Charitable Trusts Scholars Program in the Biomedical Sciences identifies about 20 young investigators per year who have shown outstanding promise in basic or clinical sciences. Each scholar receives $200,000 over a 4-year period. The only restriction on the use of the funds is that expenditures must be related to research or work activities and that only 10% of the funds can be used to cover salary (51).
-
The Searle Scholars Program invites 100 academic institutions each year to nominate newly appointed faculty candidates who are likely to make an important contribution to biomedical science. Each institution can nominate no more than two candidates per year, from whom about 18 are selected for the award. The award consists of $180,000 over 3 years. The achievements of Searle Scholars attest to the success of the program. Of the 121 Scholars appointed from April 1981 to April 1987, 30 have become full professors and 62 associate professors (55).
-
The Lucille P. Markey Charitable Trust's Scholars In Biomedical Science Program (36) is unusual in that its awards span the critical transition from postdoctoral fellow to independent investigator. During the last 10 years, the average tenure of a postdoctoral fellow has gradually increased with no parallel increase in the duration of most postdoctoral fellowship awards. In response to the federal funding gap, the trust created a program that begins in the third postdoctoral year and supports young investigators through the last years of postdoctoral training and the first 5 years of a faculty appointment. The award provides full salary support through this period in addition to a decreasing annual amount of research funds during the faculty years. The sliding scale of research funds is based on the expectation that the scholars will attract extramural support. These awards were particularly attractive to newly independent investigators because they provided research support in the first year of independence, at a time when many young scientists have no extramural support and must therefore depend on the startup funds of their institutions. Unfortunately, the program was small: only eight Ph.D. and eight M.D. or M.D.-Ph.D. Scholars were selected each year. The last group of Scholars was chosen in 1991, and the trust will be discontinued in 1999, when its funds will have been spent. Thus, the impact of this innovative and successful program will be brief.
Awards from philanthropic foundations to newly independent investigators are few, so they can ease the struggle of only a small number of young scientists. Many of the philanthropic foundations compete for the same group of elite young scientists, thereby further reducing their overall impact (6). In the near future, philanthropic support of biomedical research can be expected, at best, to be maintained at a steady rate. In fact, there might be a slight decline as foundations withdraw their support or largely redirect it to what are considered to be the more pressing needs of ensuring health-care accessibility
and quality in clinical practice. Providing support to the biomedical sciences already represents a major portion of some foundations' grant capacity, and an increase in their support is highly unlikely.
For others, finding a meaningful and visible niche in the biomedical sciences has been difficult in the face of the large federal commitment in the field. Many foundations find it important to have some assurance that their investments make a difference. There is a concomitant tendency to withdraw from fields where their contributions are likely to be lost among those of the larger funders. Indeed, some major philanthropies in the health-care field have specific prohibitions against supporting biomedical science.
The financial grounding of this field is expected to continue as it has over the last 50 years: federal and corporate resources will remain dominant. Foundations will play a smaller role in supporting training and research, but it is hoped that they will continue to serve as catalysts for change and as proponents of neglected subjects and new frontiers.
Howard Hughes Medical Institute
The Howard Hughes Medical Institute (HHMI), a philanthropic organization, is the second largest provider of basic biomedical research funds, after the federal government. Its 1953 charter states that ''the primary purpose and objective of the Institute shall be the promotion of human knowledge within the field of basic sciences (principally the field of medical research and medical education) and the effective application thereof for the benefit of mankind'' (25).
The endowment of HHMI came from the sale of Hughes Aircraft Company to General Motors in 1985. In an agreement with the federal government in 1987, HHMI was designated a medical research organization that, unlike a foundation or voluntary health organization, can employ scientists and also make educational grants (25,28). HHMI does not provide grants to investigators; rather, it employs researchers who work in university, hospital, or academic medical-center laboratories. In this cooperative structure, a university benefits from the presence of HHMI scientists who function as university faculty, and HHMI does not need to create new research facilities.
In 1992, HHMI employed 222 investigators at 53 institutions (29). Over one-third were assistant investigators. An assistant investigator is nominated
by the host university and appointed to HHMI after its review. HHMI provides full salary support and a generous research allowance, which is sufficient to launch a newly independent investigator's research career. Although encouraged to obtain additional sources of extramural support, an assistant investigator is usually funded well enough by HHMI to make the need for additional funds less urgent. The FY 1992 budget for HHMI investigators is $237 million.
In addition to funding its own investigators directly, HHMI provides funds for construction and renovation of laboratory space at its host institutions, some of which may be used by newly independent investigators. It also funds fellowships to persons enrolled in Ph.D., M.D., and postdoctoral programs.
HHMI has been particularly active in targeting funding for improvements in science education at minority-group colleges and liberal-arts colleges that have little research base. Since 1987, HHMI has provided about $219 million in a grants program for education and training in biomedical and medical science (29).
VOLUNTARY HEALTH ORGANIZATIONS
Voluntary health organizations (VHOs) raise funds from the public and dispense a portion of them for research either directly or through academic societies that foster intellectual exchange and educational or curricular initiatives (10). Each organization is dedicated to encouraging research on specific health problems. The VHOs have generally targeted newly independent investigators to receive funds because they represent tomorrow's established scientists and future progress of disease-related research (Table 2-3). In addition, they support established scientists and the training of graduate students and postdoctoral scientists.
The total of annual funds available for research from all VHOs in the United States is difficult to estimate. The most recent available figure for 23 of the largest VHOs is $188 million. That 1986 figure, found in the report of HHMI, included grants for "science education and research" (26). Spending in 1991 can be approximated from the projected investment of the American Cancer Society (ACS). ACS spent about $100 million in biomedical-and behavioral-science research in 1992, an increase of about 77% over 1986. In fiscal 1993, over $9 million was invested in the Postdoctoral/Physician Training Fellowship program at ACS. If that increase is applied to the other
22 organizations, the 1992 spending by the 23 organizations can be estimated at $300–350 million.
The research grants offered by the VHOs vary widely in size, duration, and eligibility requirements. The usual pattern is short-term, nonrenewable provision (1–2 years) of small amounts. A relatively large number of grants to young scientists provide partial salary (up to $40,000 per year), although some limit the use of the funds to supplies and small equipment. Most of the VHO grants carry little or no indirect-cost reimbursement to the host institution. The grant applications are generally reviewed by an independent peer-review panel and funded in order of quality.
Table 2-3 summarizes examples of the monetary support available specifically to newly independent investigators from some VHOs. It is not a comprehensive list of organizations and is intended only to illustrate the characteristic favorable attitude by VHOs to newly independent investigators. The evidence from the reports of large and small VHOs points overwhelmingly to an emphasis on support of young investigators. Almost 54% of the funds spent by the organizations listed in Table 2-3 is designated for young investigators as a means of attracting physicians and scientists into research on the diseases for which the VHOs solicit funds from the public. The research focus and funding mechanism are peculiar to each VHO, so newly independent investigators are obliged to search carefully among the VHOs for the precise grants for which they qualify.
ACADEMIC AND RESEARCH INSTITUTIONS
Universities and research institutions have a remarkable variety of mechanisms to support the efforts of their researchers. The majority of institutions allocate startup funds to support beginning investigators. Although the expectation is that a newly hired faculty member will secure outside research funding, the university is often the primary source of funding in the first year. In an informal survey, the committee found that startup funds vary with institution and discipline: $250,000 approximates an upper limit, and these once-only awards average about $50,000. In addition to funds for research supplies and equipment, startup packages can include a reduced teaching responsibility for the first year, faculty summer salary, graduate-assistant salaries, and travel and equipment funds.
Table 2-3 Estimated 1990 Research Funds Provided by 17 Representative Voluntary Health Organizations
|
Organization |
Research Funds, Millions of Dollars |
Amount to Newly Independent Investigators, Millions of Dollars |
|
American Cancer Society |
87 |
37 |
|
American Diabetes Association and Associates |
9 |
7 |
|
American Federation for Aging Research |
1.3 |
1.3 |
|
American Heart Association and Affiliates |
70 |
30 |
|
American Lung Association and Affiliates |
5 |
5 |
|
Arthritis Foundation |
10 |
6 |
|
Cystic Fibrosis Foundation |
13 |
10 |
|
Epilepsy Foundation of America |
1 |
1 |
|
Juvenile Diabetes Foundation International |
14 |
11 |
|
Leukemia Society of America |
6 |
5 |
|
March of Dimes |
15 |
7 |
|
Muscular Dystrophy Association |
21 |
10 |
|
Crohn's and Colitis Foundation of America |
3 |
2 |
|
National Kidney Foundation |
3 |
2 |
|
National Multiple Sclerosis Society |
22 |
13 |
|
National Society to Prevent Blindness |
12 |
9 |
|
United Cerebral Palsy Research and Education Foundation |
1.5 |
1.5 |
|
Source: Personal communication with representatives of the organizations listed. |
||
In addition, universities and research institutions provide support to both senior and junior faculty in the form of small competitive grants and one-time project initiation or pilot grants to encourage exploratory research and interdisciplinary collaboration. Interim or bridge grants are used to provide funds for brief periods when there are lapses in external funding. Applied-research grants (for both planning and operational phases), assistance in identifying industrial partners, and technology-transfer assistance are provided to encourage university-industry cooperation and identification of sources for matching funds. Grants for travel, conferences, salary (including release time from teaching to do research), summer-salary support, sabbatical leave, equipment, and technical support are provided. Most of these grants provide modest funds for short periods. In many cases, the funds are distributed through a formal application process in which applications are peer-reviewed and funded in order of quality and need. The institutional funds also provide the universities with some ability to develop their own unique blends of research disciplines.
Novel faculty appointments have been adopted by several U.S. universities and research institutions—for example, the Carnegie Institution of Washington and the Whitehead Institute at the Massachusetts Institute of Technology—to counteract the dilemma facing a young investigator who has to establish an active research program while juggling the ancillary duties of university life, including teaching and administrative responsibilities. These appointments provide unusually gifted young investigators the time to launch an original line of research and to set up an experimental system that will provide a basis for future direction and grant support. Little or no institutional responsibilities accompany the position. The investigator, often called a "fellow," is appointed for a nonrenewable term of 5 years, either directly out of graduate (or medical) school or after postdoctoral (or residency) training. The newly independent investigator is not part of any faculty member's "team." Funding sources vary, but usually a young investigator in one of these programs will eventually need to apply for an extramural grant.
Extramural grants are usually procured by newly independent investigators in the second year. To assist their junior faculty, many universities have developed information networks to enhance extramural grant procurement, including seminars, information packages, workshops, grant-writing assistance, and offices to monitor requests for proposals. Some universities organize workshops that are attended by representatives of federal funding agencies; these act as conduits for information exchange and personal contact between
researchers who have sparse funds or few opportunities to visit federal agencies.
It is increasingly difficult for universities to support their intramural research because the mechanisms available to pump money into the system are under great stress. Federal and state support is leveling off, if not declining; full recovery of indirect costs is being questioned; and there are increasing calls to provide matching funds for projects. The NIH Biological Research Support Grant (BRSG) program, a long-standing source of federal funding to universities, has been terminated. The BRSG provided a flexible source of noncompetitive dollars that was based on the size and number of Public Health Service research grants to, and cooperative agreements with, principal investigators at a given institution (23,56). In FY 1991, 628 institutions were eligible for BRSG awards; the largest was $131,000, and the average was $38,000. Although those do not appear to be large sums, the committee's informal survey of universities and a survey by the Association of American Medical Colleges (56) indicated that the BRSG program provided valuable support for newly independent investigators. In FY 1990, more than 220 investigators who had received BRSG funds in FY 1988 and 1989 were awarded 5-year FIRST awards totaling $19.6 million. Recipients of BRSG awards in those 2 years garnered 18% of the new regular research grants (R01s) awarded by NIH (105).


