
3
Transatlantic Movement of Atlantic Bluefin Tuna
INTRODUCTION
The degree of fish movement between fishing grounds in the eastern and western Atlantic Ocean and the degree of genetic mixing in the spawning areas in the eastern and western Atlantic Ocean are both important topics relevant to the management of Atlantic bluefin tuna. The review and reanalysis of tagging data constitute the committee's evaluation of the scientific basis for physical movement or mixing of fish between fishing grounds. These tagging data, however, do not provide information on the degree of genetic mixing.
TAG-RECAPTURE DATA
Tag-recapture data provide the strongest evidence available for transatlantic movement of fish. Atlantic bluefin tuna were marked and released in the western Atlantic Ocean from 1954 in varying numbers until 1987 (Parrack, 1990). The total number tagged by the National Marine Fisheries Service (NMFS) since the inception of the program has been over 15,000. Early releases were primarily of large (giant) fish, although more recently releases have included numerous small fish.
West to East
An overview of movement from the west to the east by size class (i.e., from age 0 fish to giant fish), as indicated by tag returns, appears in Suzuki (1990).
TABLE 3-1 Synopsis of release and recapture (tagging experiments) of western Atlantic bluefin tuna. Data are from Mather (1980) and Brunenmeister (1980).
|
Tag locality |
# Released |
Size |
# Recaptured |
|
|
Bahamas |
1,709 |
Giant fish |
17 |
|
|
NW Atlantic Ocean |
1,881 |
Giant fish |
81 |
|
|
US Coast* |
468 |
Medium fish |
10 |
|
|
NW Atlantic Ocean |
>17,700 |
Small fish |
>2,180 |
|
|
Bahamas to eastern Atlantic Ocean |
9 [giant fish] |
|
|
|
|
US Coast* to eastern Atlantic Ocean |
1 [medium fish] |
|
|
|
|
NW Atlantic to eastern Atlantic Ocean |
46 [small fish] |
|
|
|
|
Trans-Atlantic giant fish released in Bahamas |
9/17 |
52.9% |
||
|
Trans-Atlantic giant fish released in W Atlantic Ocean |
9/98 |
9.2% |
||
|
Trans-Atlantic medium fish released off US Coast* |
1/10 |
10.0% |
||
|
Trans-Atlantic small fish released in NW Atlantic Ocean |
46/2,180 |
2.1%** |
||
|
* From Mather (1980): "mostly" medium fish were released north of 35°N and west of 60°W. ** More than 2,180 fish released; estimate of 2.1% is maximum. |
||||
Recaptures through 1978 of large fish released in the Bahamas in the 1960s, and of small fish released along the U.S. Atlantic coast, document unequivocally that transatlantic migration occurs (Table 3-1). Transatlantic migrants include nine giant fish taken off the Norwegian coast, one medium fish (recovered as a giant tuna over 10 years later) taken off the southern coast of Spain, and 46 small fish taken chiefly from the Bay of Biscay. Estimates of the total proportion of fish tagged in the western Atlantic Ocean in eastern Atlantic samples (Table 3-1) range from 9.3% for giant fish and medium fish to 2.1% for small fish. Estimates for giant and medium fish differ slightly from those given in Mather (1980), who found a total of 10 western migrants in 126 eastern Atlantic recaptures (10/126 = 7.9%). Suzuki (1990) estimated an "overall" proportion of western-tagged fish in eastern Atlantic samples of 3.2% as of 1988.
Estimates of west to east transatlantic movement are variable and depend on the size of fish tagged and tagging locality. All but one of the giant fish transatlantic recoveries were tagged near the Bahamas, and five of the nine migrants were recovered in Norwegian waters in the same year. These results indicate that giant bluefin tuna can travel long distances; only one of the remaining 91 giant tuna or medium fish tagged in the western Atlantic Ocean was recovered in the eastern Atlantic Ocean. This fish was tagged near Bermuda and recovered 10 years later. Mather (1980) hypothesized that the transatlantic migration of
giant fish was not part of an annual pattern but rather represented irregular migration of varying numbers of fish in different years. This hypothesis deserves consideration because bluefin tuna tend to follow ocean currents (Sella, 1929, cited in Mather, 1980) and because of the proximity of the Bahamian tagging sites to the Gulf Stream. This possible transatlantic "route" for giant fish is strikingly similar to the one for larvae proposed by Murphy (1990). Finally, Mather (1980) also noted that the transatlantic movement of small bluefin tuna was variable and that virtually all transatlantic movements of small fish were from the Mid-Atlantic Bight to the Bay of Biscay. Mather concluded that the west to east transatlantic movement of small fish might be due to unusual stimuli and that the great majority of Atlantic bluefin tuna remain on one side of the Atlantic Ocean or the other. Alternatively, the "nonrandom" movement of small bluefin tuna from the Mid-Atlantic Bight to the Bay of Biscay may reflect the importance of both nursery areas for small bluefin tuna.
East to West
Eastern Atlantic/Mediterranean bluefin tuna have been tagged and released since 1911, although most of the tag and release data are from 1957 to the present (Cort and Liorzou, 1990c). As in the western Atlantic Ocean, most of the early releases were giant tuna, with the number of small fish released and recovered increasing over the past two decades. Numbers of fish released and recaptured from the eastern Atlantic Ocean and Mediterranean Sea from 1911 through 1992 are listed in Brunenmeister (1980), Cort and Liorzou (1990c), and Cort and de la Serna (1993). A synopsis of these listings is shown in Table 3-2. The proportion of eastern-tagged fish among western Atlantic recaptures varies from 0% for giant fish to 4.5% for small fish. Virtually all of the transatlantic migrants recaptured off the U.S. coast were released from the Bay of Biscay, and most were captured between 10 and 20 months after first released. The "total" proportion of eastern fish among western Atlantic recaptures is 4.0% (19/472) after adjustment for the greater number of small fish among recaptures. This estimate is similar to the estimate of 4.4% of Cort and Loirzou (1990c). Estimates of eastern Atlantic fish among Mediterranean recaptures are 11.3% for giant fish and 2.8% for small fish. The proportion of Mediterranean fish among eastern Atlantic recaptures is 2.8% for small fish.
The absence of documented east to west transatlantic movement of large fish is striking and merits further investigation. Considering only small fish, the proportion of transatlantic immigrants in western and eastern Atlantic samples differs: estimates made here suggest an overall proportion of small western fish among eastern Atlantic recaptures of 2.1% and a proportion of 4.5% eastern-tagged fish among western recaptures.
TABLE 3-2 Synopsis of release and recapture (tagging experiments) of eastern Atlantic/Mediterranean bluefin tuna. Data are from Brunenmeister (1980), Cort and Loirzou (1990c), and Cort and de la Serna (1993).
|
Tag Locality |
# Released |
Size |
# Recaptured |
|
|
Eastern Atlantic Ocean |
599-604 |
Giant fish |
53 |
|
|
|
6,144 |
Small fish |
418-420 |
|
|
|
107-232 |
Unknown* |
3 |
|
|
Mediterranean Sea |
3,993 |
Small fish |
70 |
|
|
|
20-30 |
Unknown* |
0 |
|
|
Eastern Atlantic to western Atlantic Ocean |
19 [small fish] |
|||
|
Eastern Atlantic Ocean to Mediterranean Sea |
13 [6 giant fish, 7 small fish] |
|||
|
Mediterranean Sea to eastern Atlantic Ocean |
11 [small fish] |
|||
|
Trans-Atlantic giant fish released in eastern Atlantic Ocean |
0 |
|
||
|
Trans-Atlantic small fish released in eastern Atlantic Ocean |
19/419 |
4.5% |
||
|
Mediterranean small fish to eastern Atlantic Ocean |
11/70 |
15.7% |
||
|
Eastern Atlantic giant fish to Mediterranean Sea |
6/53 |
11.3% |
||
|
Eastern Atlantic small fish to Mediterranean Sea |
13/472 |
2.8% |
||
|
* From studies carried out prior to 1940 in Italy and Portugal. |
||||
Reanalysis of Tagging Data
Tagging data suggest that physical movement or mixing of Atlantic bluefin tuna in fishing grounds from opposite sides of the Atlantic Ocean is significant. Thus, the committee reanalyzed the tagging data to estimate rates of transatlantic movement between fishing grounds. This analysis was undertaken to provide rigorous estimates of transfer across the Atlantic Ocean, which has not been attempted previously. Because it is not possible to estimate transfer rates without knowledge of the total mortality rates and the nonreporting rates (tags recovered but not reported), these quantities are also estimated.
METHODS
The problem of transfer rates is described by the rates of change in the population sizes, Nw for the west and Ne for the east. Equations for the transfer of fish from the west to the east, applicable to fish tagged with a single tag, are:
(1)
(2)
M = annual rate of instantaneous natural mortality plus shedding. 1
Fw = annual rate of instantaneous fishing mortality in the west.
Fe = annual rate of instantaneous fishing mortality in the east.
Tw = annual rate of instantaneous transfer from west to east.
Integration of this pair of equations provides estimates of the population size at any time t, over the interval for which Fw is constant in the west and Fe is constant in the east. The solutions are given by:
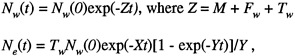
where X = M + Fe and Y = Fw-Fe + Tw
Similarly, the equations for the caches are:
When t is sufficiently large:
When Pw and Pe are the proportions of tags recovered that are reported for the west and east, respectively, then:
(3)
Analogous equations (with the subscripts e and w reversed) are used to estimate the transfer rate of fish from the east to the west. Because the models given by Equations (1) and (2) do not admit roundtrip movement, any such return movement would cause the transfer rates estimated by Equation (3) to be underestimates of movement rates from one side of the ocean to the other. Also, if fishing mortality decreases with age, as it appears to do, the movement rates estimated by assuming a constant fishing mortality will be underestimated.
Tag-recovery information from Corte and de la Serna (1993) (Table 2; which is reproduced below as Table 3-3) and from NMFS archives (file name MRFISH)
TABLE 3-3 Spanish tagging data for Atlantic bluefin tuna in the Cantabrian Sea (Bay of Biscay) from 1976 to 1991.
|
Recoveries |
|||||||||||
|
|
Recoveries in the Eastern Atlantic With Known Years At Liberty |
||||||||||
|
Year |
N |
0 |
1 |
2 |
3 |
4 |
Trans Atlantic |
Med. Sea |
East Atlantic* |
No data |
Total |
|
1976 |
3 |
- |
- |
- |
- |
- |
0 |
- |
0 |
0 |
- |
|
1977 |
10 |
- |
- |
- |
- |
- |
0 |
- |
0 |
0 |
- |
|
1978 |
170 |
29 |
2 |
4 |
1 |
- |
1 |
- |
0 |
5 |
42 |
|
1979 |
101 |
1 |
10 |
- |
- |
- |
2 |
- |
0 |
1 |
14 |
|
1980 |
302 |
15 |
2 |
2 |
- |
- |
3 |
- |
2 |
8 |
32 |
|
1981 |
293 |
3 |
5 |
- |
1 |
- |
0 |
2 |
0 |
2 |
13 |
|
1982 |
395 |
5 |
6 |
4 |
2 |
- |
1 |
3 |
2 |
2 |
25 |
|
1983 |
370 |
2 |
1 |
1 |
- |
- |
0 |
1 |
0 |
1 |
6 |
|
1984 |
513 |
8 |
7 |
1 |
- |
1 |
0 |
1 |
2 |
6 |
26 |
|
1985 |
407 |
12 |
2 |
- |
2 |
- |
1 |
- |
0 |
4 |
21 |
|
1986 |
838 |
37 |
8 |
6 |
1 |
1 |
5 |
- |
0 |
10 |
68 |
|
1987 |
- |
- |
- |
- |
- |
- |
0 |
- |
0 |
0 |
- |
|
1988 |
1,151 |
26 |
17 |
5 |
- |
2 |
1 |
- |
0 |
7 |
58 |
|
1989 |
122 |
2 |
1 |
2 |
2 |
- |
0 |
- |
0 |
0 |
7 |
|
1990 |
973 |
8 |
22 |
2 |
- |
- |
3 |
- |
0 |
0 |
39 |
|
1991 |
15 |
4 |
1 |
- |
- |
- |
0 |
- |
0 |
0 |
5 |
|
Total |
5,663 |
152 |
84 |
29 |
11 |
4 |
17 |
7 |
6 |
46 |
356 |
|
* This column refers to recoveries in the eastern Atlantic without known recovery year. |
|||||||||||
was used to obtain values of catch (C). Some descriptions of qualitative features of the tagging data with respect to movement are given below in the Results section. Shedding (L = M -0.14) (0.14 was taken from the literature as the natural mortality rate; ICCAT, 1993) was estimated from these catch data using the method of Chapman, Fink, and Bennet (1965, equations 5, 6, and 7) to estimate L. This method was used rather than that of Bayliff and Mobrand (1972), because shedding rates do not appear to be constant and appear to be insensitive to type I (initial) shedding. Once the estimate of M (L + 0.14) was available, VPA analysis was done on the catches over time to obtain estimates of F.
Results
Tables 3-4, 3-5, and 3-6 show the number of fish tagged in the western Atlantic Ocean (from MRFISH) and the number of recoveries by year after tagging. Year 0 means fish caught in the same calendar year as tagged; year 1 means fish caught in the calendar year following tagging, etc. Table 3-7 (eastern Atlantic Ocean, ICCAT data) and Table 3-8 (western Atlantic Ocean, NMFS data) show the months in which the fish were tagged and the months in which the fisheries captured the tagged fish. Because most tagged fish were small (less than four years old), inferences about fishing times based on these tag recoveries should apply to small fish.
From 1971 to 1978, there was intensive tagging in the west with both single-and double tagged fish (a small number of double tagged fish actually had more than two tags). Table 3-9 shows the number of recoveries from single tagged fish (SS), the number of recoveries of fish with two tags from double tagged fish (DD), and the number of recoveries of fish with one tag from double tagged fish (DS), by year of recovery. Tagging time varied, so data from the west were sorted into periods of one-quarter year; that is, if a tag was recovered with the same quarter as the release, it was placed in quarter 1. If the recovery was made after more than 91 days but before 182 days, it was placed in quarter 2, and so on. Table 3-10 shows the recovery data for recoveries SS, DD, and DS by year of release and quarter of recovery.
The western data from Table 3-10 were used to estimate shedding rates (Table 3-11). Comparison of SS to DD (Db Db vs. Sing in Table 3-11) shows the most variability, and comparison of DD to DS (Db Db vs. Db Sing) shows the most stability. After examining Table 3-11, it was decided to try L = 0.26 for all ages and also to try L(1) = 0.50, L(2) = 0.40, L(3) = 0.30, and L(4+) = 0.20, corresponding to quarter 1, quarter 2, quarter 3, and all quarters 4 or more. These values are not much different from the value of 0.205 estimated by Baglin et al. (1980).
With the shedding rates mentioned above, and the catch vectors for SS and DD in Table 3-11, VPA analysis was performed showing that the two sets of
TABLE 3-4 Atlantic bluefin tuna release and recovery data from the United States tagging program in the western Atlantic Ocean. Tag returns are by year tagged and years out for all tag types.
TABLE 3-5 Atlantic bluefin tuna release and recovery data from the U.S. tagging program in the western Atlantic Ocean. Tag returns are by year tagged and years out for fish tagged with a single tag.
TABLE 3-6 Atlantic bluefin tuna release and recovery data from the U.S. tagging program in the western Atlantic Ocean.
Tag returns are by year tagged and years out for fish tagged with two or more tags.
TABLE 3-7 Atlantic bluefin tuna tagged in the eastern Atlantic Ocean from 1976 to 1991. Month of tagging versus month of recapture, all types of tag.
TABLE 3-8 Atlantic bluefin tuna tagged in the western Atlantic Ocean from 1954 to 1990. Month of tagging versus month of recapture.
TABLE 3-9 Atlantic bluefin tuna release and recovery data from the U.S. tagging program in the western Atlantic Ocean. Tag returns are by year tagged and years out for single tags, double tags recovered with two tags, and double tags recovered with single tags.
TABLE 3-10 Atlantic bluefin tuna release and recovery data from the U.S. tagging program in the western Atlantic Ocean. Tag returns are by year tagged and quarters out for fish tagged with a single tag, tagged with two tags and recovered with two tags, and tagged with two tags and returned with one tag.
|
SINGLE TAGGED-SINGLE RECOVERY |
|||||||||
|
|
Year Tagged |
||||||||
|
QR |
1971 |
1972 |
1973 |
1974 |
1975 |
1976 |
1977 |
1978 |
TOTAL |
|
1 |
2 |
2 |
4 |
15 |
15 |
138 |
35 |
17 |
228 |
|
2 |
- |
1 |
- |
4 |
5 |
5 |
4 |
3 |
22 |
|
3 |
- |
- |
- |
- |
- |
4 |
7 |
1 |
12 |
|
4 |
1 |
- |
2 |
15 |
3 |
8 |
49 |
32 |
110 |
|
5 |
10 |
11 |
5 |
26 |
13 |
37 |
65 |
3 |
170 |
|
6 |
- |
2 |
1 |
1 |
- |
1 |
7 |
- |
12 |
|
7 |
- |
2 |
- |
- |
- |
6 |
2 |
3 |
13 |
|
8 |
1 |
- |
1 |
8 |
4 |
3 |
45 |
3 |
65 |
|
9 |
2 |
2 |
- |
5 |
- |
53 |
3 |
6 |
71 |
|
10 |
- |
- |
- |
- |
- |
5 |
- |
1 |
6 |
|
11 |
- |
- |
- |
- |
- |
4 |
1 |
- |
5 |
|
12 |
- |
- |
1 |
4 |
- |
3 |
- |
- |
8 |
|
13+ |
1 |
1 |
- |
9 |
1 |
2 |
6 |
11 |
31 |
|
Totals |
17 |
21 |
14 |
87 |
41 |
269 |
224 |
80 |
753 |
|
DOUBLE TAGGED-DOUBLE RECOVERY |
|||||||||
|
|
Year Tagged |
||||||||
|
QR |
1971 |
1972 |
1973 |
1974 |
1975 |
1976 |
1977 |
1978 |
TOTAL |
|
1 |
8 |
6 |
26 |
50 |
1 |
36 |
10 |
4 |
141 |
|
2 |
- |
- |
3 |
2 |
- |
- |
2 |
1 |
8 |
|
3 |
- |
- |
- |
- |
1 |
1 |
- |
- |
2 |
|
4 |
9 |
20 |
- |
14 |
- |
1 |
23 |
56 |
123 |
|
5 |
21 |
7 |
7 |
43 |
4 |
6 |
30 |
4 |
122 |
|
6 |
- |
- |
- |
- |
- |
- |
3 |
- |
3 |
|
7 |
- |
- |
1 |
- |
- |
- |
1 |
- |
2 |
|
8 |
- |
- |
1 |
4 |
2 |
- |
20 |
4 |
31 |
|
9 |
5 |
1 |
- |
15 |
- |
2 |
2 |
5 |
30 |
|
10 |
- |
- |
- |
- |
- |
1 |
- |
- |
1 |
|
11 |
- |
- |
- |
- |
- |
1 |
- |
1 |
2 |
|
12 |
- |
- |
- |
1 |
- |
- |
- |
- |
1 |
|
13+ |
- |
- |
- |
4 |
- |
1 |
1 |
2 |
8 |
|
Totals |
43 |
34 |
38 |
133 |
8 |
49 |
92 |
77 |
474 |
values of M (natural mortality plus shedding constant and variable) are compatible with known values of initial population size (number originally marked) and cause only minor changes in age-specific F (Table 3-12 for SS and Table 3-13 for DD). Also, further testing shows that VPA has low sensitivity to the arbitrarily assumed reporting rate of 80% (Table 3-14 for SS and Table 3-15 for DD).
Preliminary examination of the transfer of fish from the east to the west shows 17 fish out of 356 recoveries (Cort and de la Serna, 1993) for the period 1976 through 1991. For west to east movement, the data from MRFISH show 65 of 3,102 total recoveries made in the east. The west to east data are highly variable between years (Table 3-16). When the data were sorted by time elapsed since tagging, the ratio of eastern to western Atlantic recoveries increased with time elapsed (Table 3-17). To obtain more detailed information, the file MRFISH was searched for data on fish tagged from 1960 to 1981 in the west with a single tag. Table 3-5 shows the number tagged by year; Table 3-18 shows the recoveries of single tags in the western Atlantic Ocean by year and quarter after tagging; and Table 3-19 shows the eastern Atlantic Ocean recoveries by year and quarter after tagging. Data for 31 or more quarter years were combined. The longest time to recovery was 18 years (Table 3-5), supporting the belief that the natural mortality rate of bluefin tuna is low.
Data with known times at recovery from the eastern Atlantic Ocean (Table 3-3) were used to estimate fishing mortality rates (Fe). A plot of the natural
TABLE 3-11 Atlantic bluefin tuna tagged in the western Atlantic Ocean from 1971 to 1978. Estimates of annual instantaneous shedding rates using observed catches are shown in A, while B shows the observed catches increased by 20% for nonreporting (i.e., multiplied by 1.2). 5,409 single tagged fish and 4,056 double tagged fish were released. The method used is that of Chapman et al. (1975).
|
A. |
Time Out Mid Point |
Db Db vs Sing |
Db Sing vs Sing |
Db Db vs Db Sing |
Catch Sing |
Catch Db Db |
Catch Db Sing |
|
|
|
0.125 |
1.5418 |
0.4574 |
0.5216 |
228 |
141 |
19 |
|
|
|
0.375 |
1.9300 |
0.2542 |
0.4583 |
22 |
8 |
3 |
|
|
|
0.625 |
2.4062 |
0.0915 |
0.3570 |
12 |
2 |
1 |
|
|
|
0.875 |
-0.4567 |
0.2902 |
0.1601 |
110 |
123 |
37 |
|
|
|
1.125 |
0.0390 |
0.2340 |
0.1925 |
170 |
122 |
59 |
|
|
|
1.375 |
0.7989 |
0.1326 |
0.2949 |
12 |
3 |
3 |
|
|
|
1.625 |
0.9747 |
0.1028 |
0.3444 |
13 |
2 |
3 |
|
|
|
1.875 |
0.2414 |
0.1089 |
0.1359 |
65 |
31 |
18 |
|
|
|
2.125 |
0.2699 |
0.1557 |
0.1908 |
71 |
30 |
30 |
|
|
|
2.375 |
0.6332 |
0.1058 |
0.2919 |
6 |
1 |
2 |
|
|
|
2.625 |
0.2394 |
0.6134 |
0.3491 |
5 |
2 |
6 |
|
|
|
2.875 |
0.6232 |
0.0634 |
0.2411 |
8 |
1 |
2 |
|
|
B. |
Time Out Mid Point |
Db Db vs Sing |
Db Sing vs Sing |
Db Db vs Db Sing |
Catch Sing |
Catch Db Db |
Catch Db Sing |
|
|
|
0.125 |
1.5417 |
0.4574 |
0.5216 |
274 |
169 |
23 |
|
|
|
0.375 |
1.9300 |
0.2542 |
0.4583 |
26 |
10 |
4 |
|
|
|
0.625 |
2.4062 |
0.0915 |
0.3570 |
14 |
2 |
1 |
|
|
|
0.875 |
-0.4567 |
0.2902 |
0.1601 |
132 |
148 |
44 |
|
|
|
1.125 |
0.0390 |
0.2340 |
0.1925 |
204 |
146 |
71 |
|
|
|
1.375 |
0.7989 |
0.1326 |
0.2949 |
14 |
4 |
4 |
|
|
|
1.625 |
0.9747 |
0.1028 |
0.3444 |
16 |
2 |
4 |
|
|
|
1.875 |
0.2414 |
0.1089 |
0.1359 |
78 |
37 |
22 |
|
|
|
2.125 |
0.2699 |
0.1557 |
0.1908 |
85 |
36 |
36 |
|
|
|
2.375 |
0.6332 |
0.1058 |
0.2919 |
7 |
1 |
2 |
|
|
|
2.625 |
0.2394 |
0.6134 |
0.3491 |
6 |
2 |
7 |
|
|
|
2.875 |
0.6232 |
0.0634 |
0.2411 |
10 |
1 |
2 |
|
|
Sing = Tagged with single tag-recovered with tag Db Db = Tagged with 2 or more tags recovered with 2 or more tags Db Sing = Tagged with 2 or more tags recovered with one tag Almost all double tagged fish had only 2 tags. |
||||||||
TABLE 3-12 Atlantic bluefin tuna tagged with a single tag from 1971 to 1978, 5,409 single tagged fish were released. VPA analysis on the reported catches in number of fish by time before recapture stratified by quarter-year intervals. A and B show two different estimates of tag shedding.
|
A |
Time Interval |
Initial Pop. Size |
Catch |
Inst. Fish. Mort. |
Inst. Nat. Mort. |
Tag Loss Rate |
Elapsed Time |
|
|
1 |
5,349.1 |
228.00 |
0.1833 |
0.1400 |
0.2600 |
0.25 |
|
|
2 |
4,623.4 |
22.00 |
0.0200 |
0.1400 |
0.2600 |
0.25 |
|
|
3 |
4,162.5 |
12.00 |
0.0121 |
0.1400 |
0.2600 |
0.25 |
|
|
4 |
3,755.1 |
110.00 |
0.1250 |
0.1400 |
0.2600 |
0.25 |
|
|
5 |
3,293.2 |
170.00 |
0.2229 |
0.1400 |
0.2600 |
0.25 |
|
|
6 |
2,818.3 |
12.00 |
0.0179 |
0.1400 |
0.2600 |
0.25 |
|
|
7 |
2,538.8 |
13.00 |
0.0215 |
0.1400 |
0.2600 |
0.25 |
|
|
8 |
2,284.8 |
65.00 |
0.1213 |
0.1400 |
0.2600 |
0.25 |
|
|
9 |
2,005.6 |
71.00 |
0.1515 |
0.1400 |
0.2600 |
0.25 |
|
|
10 |
1,747.3 |
6.00 |
0.0145 |
0.1400 |
0.2600 |
0.25 |
|
|
11 |
1,575.3 |
5.00 |
0.0133 |
0.1400 |
0.2600 |
0.25 |
|
|
12 |
1,420.7 |
8.00 |
0.0237 |
0.1400 |
0.2600 |
0.25 |
|
|
13 |
930.0 |
31.00 |
0.0138 |
0.1400 |
0.2600 |
12.25 |
|
TOTALS |
|
753.0 |
0.2317 |
2.9150 |
3.1850 |
15.25 |
|
|
B |
Time Interval |
Initial Pop. Size |
Catch |
Inst. Fish. Mort. |
Inst. Nat. Mort. |
Tag Loss Rate |
Elapsed Time |
|
|
1 |
5,357.8 |
228.00 |
0.1884 |
0.1400 |
0.5000 |
0.25 |
|
|
2 |
4,355.5 |
22.00 |
0.0215 |
0.1400 |
0.4000 |
0.25 |
|
|
3 |
3,785.1 |
12.00 |
0.0133 |
0.1400 |
0.3000 |
0.25 |
|
|
4 |
,3379.6 |
110.00 |
0.1381 |
0.1400 |
0.2000 |
0.25 |
|
|
5 |
2,998.8 |
170.00 |
0.2437 |
0.1400 |
0.2000 |
0.25 |
|
|
6 |
2,591.7 |
12.00 |
0.0194 |
0.1400 |
0.2000 |
0.25 |
|
|
7 |
2,369.0 |
13.00 |
0.0230 |
0.1400 |
0.2000 |
0.25 |
|
|
8 |
2,163.4 |
65.00 |
0.1274 |
0.1400 |
0.2000 |
0.25 |
|
|
9 |
1,924.8 |
71.00 |
0.1570 |
0.1400 |
0.2000 |
0.25 |
|
|
10 |
1,699.9 |
6.00 |
0.0148 |
0.1400 |
0.2000 |
0.25 |
|
|
11 |
1,555.6 |
5.00 |
0.0136 |
0.1400 |
0.2000 |
0.25 |
|
|
12 |
1,424.0 |
8.00 |
0.0237 |
0.1400 |
0.2000 |
0.25 |
|
|
13 |
990.0 |
31.00 |
0.0110 |
0.1400 |
0.2000 |
12.25 |
|
TOTALS |
|
753.0 |
0.2460 |
2.8850 |
2.4500 |
15.25 |
|
TABLE 3-13 Atlantic bluefin tuna tagged with two or more tags from 1971 to 1978, 4,056 fish were released. VPA analysis on the reported catches, with two tags remaining, in number of fish by time before recapture stratified by quarter-year intervals. A and B show two different estimates of tag shedding.
|
A |
Time Interval |
Initial Pop Size |
Catch |
Inst. Fish. Mort. |
Inst. Nat. Mort. |
Tag Loss Rate |
Elapsed Time |
|
|
1 |
3,955.0 |
141.00 |
0.1576 |
0.1400 |
0.5200 |
0.25 |
|
|
2 |
3,223.9 |
8.00 |
0.0108 |
0.1400 |
0.5200 |
0.25 |
|
|
3 |
2,726.1 |
2.00 |
0.0032 |
0.1400 |
0.5200 |
0.25 |
|
|
4 |
2,309.6 |
123.00 |
0.2379 |
0.1400 |
0.5200 |
0.25 |
|
|
5 |
1,845.2 |
122.00 |
0.2974 |
0.1400 |
0.5200 |
0.25 |
|
|
6 |
1,452.5 |
3.00 |
0.0090 |
0.1400 |
0.5200 |
0.25 |
|
|
7 |
1,228.8 |
2.00 |
0.0072 |
0.1400 |
0.5200 |
0.25 |
|
|
8 |
1,040.0 |
31.00 |
0.1314 |
0.1400 |
0.5200 |
0.25 |
|
|
9 |
853.3 |
30.00 |
0.1555 |
0.1400 |
0.5200 |
0.25 |
|
|
10 |
695.9 |
1.00 |
0.0063 |
0.1400 |
0.5200 |
0.25 |
|
|
11 |
589.2 |
2.00 |
0.0148 |
0.1400 |
0.5200 |
0.25 |
|
|
12 |
497.7 |
1.00 |
0.0087 |
0.1400 |
0.5200 |
0.25 |
|
|
13 |
255.0 |
8.00 |
0.0214 |
0.1400 |
0.5200 |
12.25 |
|
TOTALS |
|
474.00 |
0.2599 |
3.6950 |
6.3700 |
15.25 |
|
|
B |
Time Interval |
Initial Pop Size |
Catch |
Inst. Fish. Mort. |
Inst. Nat. Mort. |
Tag Loss Rate |
Elapsed Time |
|
|
1 |
3,958.7 |
141.00 |
0.1671 |
0.1400 |
1.0000 |
0.25 |
|
|
2 |
2,855.2 |
8.00 |
0.0127 |
0.1400 |
0.8000 |
0.25 |
|
|
3 |
2,250.1 |
2.00 |
0.0038 |
0.1400 |
0.6000 |
0.25 |
|
|
4 |
1,868.3 |
123.00 |
0.2916 |
0.1400 |
0.4000 |
0.25 |
|
|
5 |
1,517.6 |
122.00 |
0.3590 |
0.1400 |
0.4000 |
0.25 |
|
|
6 |
1,212.1 |
3.00 |
0.0105 |
0.1400 |
0.4000 |
0.25 |
|
|
7 |
1,056.3 |
2.00 |
0.0081 |
0.1400 |
0.4000 |
0.25 |
|
|
8 |
921.0 |
31.00 |
0.1466 |
0.1400 |
0.4000 |
0.25 |
|
|
9 |
775.7 |
30.00 |
0.1689 |
0.1400 |
0.4000 |
0.25 |
|
|
10 |
649.8 |
1.00 |
0.0066 |
0.1400 |
0.4000 |
0.25 |
|
|
11 |
566.8 |
2.00 |
0.0151 |
0.1400 |
0.4000 |
0.25 |
|
|
12 |
493.3 |
1.00 |
0.0087 |
0.1400 |
0.4000 |
0.25 |
|
|
13 |
285.0 |
8.00 |
0.0156 |
0.1400 |
0.4000 |
12.25 |
|
TOTALS |
|
474.00 |
0.2997 |
3.6350 |
4.9000 |
15.25 |
|
TABLE 3-14 Atlantic bluefin tuna tagged with a single tag from 1971 to 1978, 5,409 fish were released. VPA analysis on the reported catches in number of fish, increased by 20% (i.e. multiplied by 1.2) to account for assumed non-reporting of tags, by time before recapture stratified by quarter-year intervals. A and B show two different estimates of tag shedding.
|
A |
Time Interval |
Initial Pop. Size |
Catch |
Inst. Fish. Mort. |
Inst. Nat. Mort. |
Tag Loss Rate |
Elapsed Time |
|
|
1 |
5,347.9 |
273.60 |
0.2208 |
0.1400 |
0.2600 |
0.25 |
|
|
2 |
4,579.1 |
26.40 |
0.0243 |
0.1400 |
0.2600 |
0.25 |
|
|
3 |
4,118.3 |
14.40 |
0.0148 |
0.1400 |
0.2600 |
0.25 |
|
|
4 |
3,712.6 |
132.00 |
0.1521 |
0.1400 |
0.2600 |
0.25 |
|
|
5 |
3,233.9 |
204.00 |
0.2742 |
0.1400 |
0.2600 |
0.25 |
|
|
6 |
2,732.3 |
14.40 |
0.0221 |
0.1400 |
0.2600 |
0.25 |
|
|
7 |
2,458.7 |
15.60 |
0.0267 |
0.1400 |
0.2600 |
0.25 |
|
|
8 |
2,209.9 |
78.00 |
0.1512 |
0.1400 |
0.2600 |
0.25 |
|
|
9 |
1,925.4 |
85.20 |
0.1903 |
0.1400 |
0.2600 |
0.25 |
|
|
10 |
1,661.3 |
7.20 |
0.0182 |
0.1400 |
0.2600 |
0.25 |
|
|
11 |
1,496.4 |
6.00 |
0.0169 |
0.1400 |
0.2600 |
0.25 |
|
|
12 |
1,348.2 |
9.60 |
0.0301 |
0.1400 |
0.2600 |
0.25 |
|
|
13 |
877.0 |
37.20 |
0.0177 |
0.1400 |
0.2600 |
12.25 |
|
TOTALS |
|
903.60 |
0.2854 |
2.9150 |
3.1850 |
15.25 |
|
|
B |
Time Interval |
Initial Pop. Size |
Catch |
Inst. Fish. Mort. |
Inst. Nat. Mort. |
Tag Loss Rate |
Elapsed Time |
|
|
1 |
5,355.8 |
273.60 |
0.2272 |
0.1400 |
0.5000 |
0.25 |
|
|
2 |
4,311.9 |
26.40 |
0.0264 |
0.1400 |
0.4000 |
0.25 |
|
|
3 |
3,742.6 |
14.40 |
0.0163 |
0.1400 |
0.3000 |
0.25 |
|
|
4 |
3,339.1 |
132.00 |
0.1683 |
0.1400 |
0.2000 |
0.25 |
|
|
5 |
2,940.6 |
204.00 |
0.3001 |
0.1400 |
0.2000 |
0.25 |
|
|
6 |
2,505.7 |
14.40 |
0.0240 |
0.1400 |
0.2000 |
0.25 |
|
|
7 |
2,287.8 |
15.60 |
0.0285 |
0.1400 |
0.2000 |
0.25 |
|
|
8 |
2,086.4 |
78.00 |
0.1591 |
0.1400 |
0.2000 |
0.25 |
|
|
9 |
1,841.7 |
85.20 |
0.1979 |
0.1400 |
0.2000 |
0.25 |
|
|
10 |
1,609.9 |
7.20 |
0.0188 |
0.1400 |
0.2000 |
0.25 |
|
|
11 |
1,471.8 |
6.00 |
0.0169 |
0.1400 |
0.2000 |
0.25 |
|
|
12 |
1,346.2 |
9.60 |
0.0298 |
0.1400 |
0.2000 |
0.25 |
|
|
13 |
930.0 |
37.20 |
0.0142 |
0.1400 |
0.2000 |
12.25 |
|
TOTALS |
|
903.60 |
0.3033 |
2.8850 |
2.4500 |
15.25 |
|
TABLE 3-15 Atlantic bluefin tuna tagged with a two or more tags from 1971 to 1978, 4,056 fish were released. VPA analysis on the reported catches in number of fish with two tags remaining, increased by 20% (i.e. multiplied by 1.2) to account for assumed non-reporting of tags, by time before recapture stratified by quarter-year intervals. A and B show two different estimates of tag shedding.
|
A |
Time Interval |
Initial Pop. Size |
Catch |
Inst. Fish. Mort. |
Inst. Nat. Mort. |
Tag Loss Rate |
Elapsed Time |
|
|
1 |
3,961.0 |
169.20 |
0.1897 |
0.1400 |
0.5200 |
0.25 |
|
|
2 |
3,203.0 |
9.60 |
0.0130 |
0.1400 |
0.5200 |
0.25 |
|
|
3 |
2,707.0 |
2.40 |
0.0038 |
0.1400 |
0.5200 |
0.25 |
|
|
4 |
2,293.0 |
147.60 |
0.2892 |
0.1400 |
0.5200 |
0.25 |
|
|
5 |
1,808.7 |
146.40 |
0.3670 |
0.1400 |
0.5200 |
0.25 |
|
|
6 |
1,399.1 |
3.60 |
0.0111 |
0.1400 |
0.5200 |
0.25 |
|
|
7 |
1,183.0 |
2.40 |
0.0087 |
0.1400 |
0.5200 |
0.25 |
|
|
8 |
1,000.9 |
37.20 |
0.1646 |
0.1400 |
0.5200 |
0.25 |
|
|
9 |
814.4 |
36.00 |
0.1964 |
0.1400 |
0.5200 |
0.25 |
|
|
10 |
657.5 |
1.20 |
0.0078 |
0.1400 |
0.5200 |
0.25 |
|
|
11 |
556.4 |
2.40 |
0.0188 |
0.1400 |
0.5200 |
0.25 |
|
|
12 |
469.5 |
1.20 |
0.0111 |
0.1400 |
0.5200 |
0.25 |
|
|
13 |
240.0 |
9.60 |
0.0275 |
0.1400 |
0.5200 |
12.25 |
|
TOTALS |
|
568.80 |
0.3203 |
3.6950 |
6.3700 |
15.25 |
|
|
B |
Time Interval |
Initial Pop. Size |
Catch |
Inst. Fish. Mort. |
Inst. Nat. Mort. |
Tag Loss Rate |
Elapsed Time |
|
|
1 |
3,962.3 |
169.20 |
0.2010 |
0.1400 |
1.0000 |
0.25 |
|
|
2 |
2,833.7 |
9.60 |
0.0151 |
0.1400 |
0.8000 |
0.25 |
|
|
3 |
2,231.8 |
2.40 |
0.0047 |
0.1400 |
0.6000 |
0.25 |
|
|
4 |
1,852.7 |
147.60 |
0.3557 |
0.1400 |
0.4000 |
0.25 |
|
|
5 |
1,481.0 |
146.40 |
0.4463 |
0.1400 |
0.4000 |
0.25 |
|
|
6 |
1,157.3 |
3.60 |
0.0133 |
0.1400 |
0.4000 |
0.25 |
|
|
7 |
1,007.8 |
2.40 |
0.0102 |
0.1400 |
0.4000 |
0.25 |
|
|
8 |
878.3 |
37.20 |
0.1851 |
0.1400 |
0.4000 |
0.25 |
|
|
9 |
732.7 |
36.00 |
0.2156 |
0.1400 |
0.4000 |
0.25 |
|
|
10 |
606.6 |
1.20 |
0.0084 |
0.1400 |
0.4000 |
0.25 |
|
|
11 |
528.9 |
2.40 |
0.0194 |
0.1400 |
0.4000 |
0.25 |
|
|
12 |
459.8 |
1.20 |
0.0111 |
0.1400 |
0.4000 |
0.25 |
|
|
13 |
265.0 |
9.60 |
0.0203 |
0.1400 |
0.4000 |
12.25 |
|
TOTALS |
|
568.80 |
0.3715 |
3.6350 |
4.9000 |
15.25 |
|
TABLE 3-16 Atlantic bluefin tuna tagged in the western Atlantic Ocean with single, double, and multiple tags. Number of fish recaptured, which retained tags, by ocean area, western and eastern, and the percent of known recoveries made in the east.
|
Year Tagged |
Unknown Area |
West Area |
East Area |
Total Known |
Percent Known East |
|
1965 |
10 |
238 |
19 |
257 |
7.393 |
|
1966 |
47 |
1,107 |
18 |
1,125 |
1.600 |
|
1967 |
4 |
181 |
3 |
184 |
1.630 |
|
1968 |
3 |
113 |
0 |
113 |
0.000 |
|
1969 |
10 |
102 |
2 |
104 |
1.923 |
|
1970 |
19 |
162 |
9 |
171 |
5.263 |
|
1971 |
5 |
78 |
0 |
78 |
0.000 |
|
1972 |
1 |
72 |
1 |
73 |
1.370 |
|
1973 |
3 |
67 |
1 |
68 |
1.471 |
|
1974 |
16 |
262 |
0 |
262 |
0.000 |
|
1975 |
3 |
55 |
0 |
55 |
0.000 |
|
1976 |
85 |
247 |
1 |
248 |
0.403 |
|
1977 |
6 |
331 |
4 |
335 |
1.194 |
|
1978 |
2 |
185 |
5 |
190 |
2.632 |
|
1979 |
3 |
49 |
1 |
50 |
2.000 |
|
1980 |
0 |
266 |
2 |
268 |
0.746 |
|
1981 |
0 |
67 |
1 |
68 |
1.471 |
|
TOTALS |
217 |
3,582 |
67 |
3,649 |
1.836 |
TABLE 3-17 Atlantic bluefin tuna tagged in the western Atlantic Ocean with a single tag. Ratio of eastern Atlantic recoveries to western recoveries as a function of time before recapture.
|
West |
East |
Ratio |
Time Out (days) |
Interval Length (years) |
|
1,356 |
7 |
0.0052 |
0 TO 180 |
0.5 |
|
1,286 |
36 |
0.0280 |
181 TO 545 |
1.0 |
|
277 |
15 |
0.0542 |
546 TO 910 |
1.0 |
|
54 |
1 |
0.0185 |
911 TO 1,275 |
1.0 |
|
64 |
6 |
0.0938 |
1,276 OR MORE |
15.0 |
TABLE 3-18 Atlantic bluefin tuna tagged with a single tag in the western Atlantic Ocean and recovered from the western Atlantic Ocean by year and by number of quarters out.
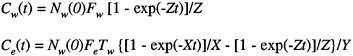
logarithm of the recovery frequency by year against the time until recovery shows a steep decline rate (Fe+M+Te) of 1.03 (Table 3-20). If M = 0.40 (0.14 [natural] + 0.26 [shedding]) and Te is between 0.01 and 0.05, the Fe would be about 0.60. A similar plot of the data in Table 3-5, summed over 1960 to 1981 and leaving out year 0, gives a decline rate of 1.31 (Table 3-21) for the western Atlantic Ocean. That would give a value of Fw of about 0.90. Application of the Chapman-Robson method (Chapman and Robson, 1960) gives slightly lower values for the east (with Fe varying between 0.36 and 0.63, depending on which year of recover set is used) and somewhat higher values for the west (Fw varying between 0.58 and 1.14). Estimates of F from the methods discussed in this paragraph are likely to be erroneously high owing, to a large extent, to effects on the results from the failure of the assumption of a constant F over time, which is implicit in such methods.
Data on the frequency by year against time (280 total recoveries) in Table 3-3 (eastern Atlantic Ocean) were expanded by the ratio 356 to 280 to obtain an age-frequency data set for VPA analysis. Backward calculation was used for six different values of Fe(5): 0.5, 0.3, 0.1, 0.05, 0.016, and 0.01. Results for the eastern data are shown in Table 3-22. Similarly, data on frequency by year against time (western Atlantic Ocean) in Table 3-5 were used to do backward VPA analysis for five different values of Fw(6). The five values of Fw(6) were
TABLE 3-19 Atlantic bluefin tuna tagged with a single tag in the western Atlantic Ocean and recovered from the eastern Atlantic Ocean by year and by number of quarters out.
estimated by assuming five different values (1,600, 1,000, 500, 250, and 100) for the population size at the end of year 6. The value of Fw(7) was estimated from the equation C = NF/Z, where C is the catch for age 7+ year-old fish, and N is the guess of the population size. Results for the western data are given in Table 3-23. In Tables 3-22 and 3-23 the natural mortality rate includes the shedding rate of 0.26 and the actual mortality of 0.14. Some slight errors in the Fw estimates occur because eastern Atlantic recoveries, although few, are part of the total recoveries used in the analysis.
Estimates of Pe and Pw were obtained from the ratio of Ne(1)/5,663 in Table 3-22 and Nw(1)/20,951 in Table 3-23. Estimates of Fe, Ze, Fw and Zw were obtained by dividing totals of the appropriate rates by the total number of time units to obtain average values. The estimates are as follows:
|
|
Eastern Atlantic Ocean |
||
|
(1) |
Pe = 0.0978 |
Fe = 0.5995 |
Ze = 0.9995 |
|
(2) |
Pe = 0.1037 |
Fe = 0.4739 |
Ze = 0.8739 |
|
(3) |
Pe = 0.1330 |
Fe = 0.2606 |
Ze = 0.6606 |
|
(4) |
Pe = 0.1766 |
Fe = 0.1636 |
Ze = 0.5636 |
|
(5) |
Pe = 0.3616 |
Fe = 0.0656 |
Ze = 0.4656 |
|
(6) |
Pe = 0.5244 |
Fe = 0.0430 |
Ze = 0.4043 |
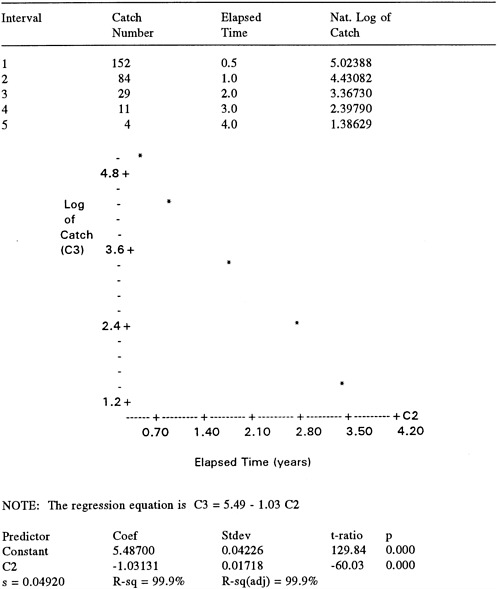
TABLE 3-21 Atlantic bluefin tuna tagged in the western Atlantic Ocean from 1960 to 1981 with a single tag and recovered in the western Atlantic Ocean vs. years before recapture and a regression analysis of the natural logarithm of catch number against years out (data in file MRFISH provided by NMFS).
|
|
TABLE 3-22 Atlantic bluefin tuna. VPA analysis on fish tagged in the eastern Atlantic Ocean (near Spain) from 1976 to 1991. Six different solutions.
|
Time |
Initial pop |
Catch |
Fish. Mort. |
Nat. Mort. |
Shed Rate |
Time Units |
|
1 |
553.8 |
193.00 |
0.9608 |
0.1400 |
0.2600 |
0.50 |
|
2 |
280.5 |
107.00 |
0.6047 |
0.1400 |
0.2600 |
1.00 |
|
3 |
102.7 |
37.00 |
0.5605 |
0.1400 |
0.2600 |
1.00 |
|
4 |
39.3 |
14.00 |
0.5522 |
0.1400 |
0.2600 |
1.00 |
|
5 |
15.2 |
5.00 |
0.5000 |
0.1400 |
0.2600 |
1.00 |
|
TOTALS |
|
356.00 |
2.6978 |
0.6300 |
1.1700 |
4.50 |
|
Time |
Initial pop |
Catch |
Fish. Mort. |
Nat. Mort. |
Shed Rate |
Time Units |
|
1 |
587.3 |
193.00 |
0.8922 |
0.1400 |
0.2600 |
0.50 |
|
2 |
307.8 |
107.00 |
0.5351 |
0.1400 |
0.2600 |
1.00 |
|
3 |
120.8 |
37.00 |
0.4558 |
0.1400 |
0.2600 |
1.00 |
|
4 |
51.3 |
14.00 |
0.3954 |
0.1400 |
0.2600 |
1.00 |
|
5 |
23.2 |
5.00 |
0.3001 |
0.1400 |
0.2600 |
1.00 |
|
TOTALS |
|
356.00 |
2.1325 |
0.6300 |
1.1700 |
4.50 |
|
Time |
Initial Pop |
Catch |
Fish. Mort. |
Nat. Mort. |
Shed Rate |
Time Units |
|
1 |
753.3 |
193.00 |
0.6599 |
0.1400 |
0.2600 |
0.50 |
|
2 |
443.4 |
107.00 |
0.3419 |
0.1400 |
0.2600 |
1.00 |
|
3 |
211.2 |
37.00 |
0.2370 |
0.1400 |
0.2600 |
1.00 |
|
4 |
111.7 |
14.00 |
0.1640 |
0.1400 |
0.2600 |
1.00 |
|
5 |
63.5 |
5.00 |
0.0999 |
0.1400 |
0.2600 |
1.00 |
|
TOTALS |
|
356.00 |
1.1729 |
0.6300 |
1.1700 |
4.50 |
|
Time |
Initial Pop |
Catch |
Fish. Mort. |
Nat. Mort. |
Shed Rate |
Time Units |
|
1 |
1,000.3 |
193.00 |
0.4765 |
0.1400 |
0.2600 |
0.50 |
|
2 |
645.4 |
107.00 |
0.2226 |
0.1400 |
0.2600 |
1.00 |
|
3 |
346.3 |
37.00 |
0.1381 |
0.1400 |
0.2600 |
1.00 |
|
4 |
202.2 |
14.00 |
0.0874 |
0.1400 |
0.2600 |
1.00 |
|
5 |
124.2 |
5.00 |
0.0499 |
0.1400 |
0.2600 |
1.00 |
|
TOTALS |
|
356.00 |
0.7363 |
0.6300 |
1.1700 |
4.50 |
|
Time |
Initial Pop |
Catch |
Fish. Mort. |
Nat. Mort. |
Shed Rate |
Time Units |
|
1 |
2,047.9 |
193.00 |
0.2193 |
0.1400 |
0.2600 |
0.50 |
|
2 |
1,502.6 |
107.00 |
0.0902 |
0.1400 |
0.2600 |
1.00 |
|
3 |
920.4 |
37.00 |
0.0499 |
0.1400 |
0.2600 |
1.00 |
|
4 |
586.9 |
14.00 |
0.0294 |
0.1400 |
0.2600 |
1.00 |
|
5 |
382.0 |
5.00 |
0.0160 |
0.1400 |
0.2600 |
1.00 |
|
TOTALS |
|
356.00 |
0.2952 |
0.6300 |
1.1700 |
4.50 |
|
Time |
Initial Pop |
Catch |
Fish. Mort. |
Nat. Mort. |
Shed Rate |
Time Units |
|
1 |
2,969.6 |
193.00 |
0.1485 |
0.1400 |
0.2600 |
0.50 |
|
2 |
2,257.3 |
107.00 |
0.0591 |
0.1400 |
0.2600 |
1.00 |
|
3 |
1,426.4 |
37.00 |
0.0319 |
0.1400 |
0.2600 |
1.00 |
|
4 |
926.1 |
14.00 |
0.0185 |
0.1400 |
0.2600 |
1.00 |
|
5 |
609.4 |
5.00 |
0.0099 |
0.1400 |
0.2600 |
1.00 |
|
TOTALS |
|
356.00 |
0.1936 |
0.6300 |
1.1700 |
4.50 |
TABLE 3-23 Atlantic bluefin tuna. VPA analysis on fish tagged in the western Atlantic Ocean (near USA) from 1960 to 1981. Five different solutions.
|
Time |
Initial Pop |
Catch |
Fish. Mort. |
Nat. Mort. |
Shed Rate |
Time Units |
|
1 |
19,162.9 |
1,471.00 |
0.1768 |
0.1400 |
0.2600 |
0.50 |
|
2 |
14,361.5 |
1,386.00 |
0.1241 |
0.1400 |
0.2600 |
1.00 |
|
3 |
8,503.7 |
309.00 |
0.0450 |
0.1400 |
0.2600 |
1.00 |
|
4 |
5,449.3 |
59.00 |
0.0133 |
0.1400 |
0.2600 |
1.00 |
|
5 |
3,604.6 |
26.00 |
0.0087 |
0.1400 |
0.2600 |
1.00 |
|
6 |
2,395.3 |
7.00 |
0.0035 |
0.1400 |
0.2600 |
1.00 |
|
7 |
1,600.0 |
44.00 |
0.0113 |
0.1400 |
0.2600 |
10.00 |
|
TOTALS |
|
3,302.00 |
0.3961 |
2.1700 |
4.0300 |
15.50 |
|
Time |
Initial Pop |
Catch |
Fish. Mort. |
Nat. Mort. |
Shed Rate |
Time Units |
|
1 |
13,739.9 |
1,471.00 |
0.2507 |
0.1400 |
0.2600 |
0.50 |
|
2 |
9,924.0 |
1,386.00 |
0.1845 |
0.1400 |
0.2600 |
1.00 |
|
3 |
5,531.6 |
309.00 |
0.0700 |
0.1400 |
0.2600 |
1.00 |
|
4 |
3,457.1 |
59.00 |
0.0209 |
0.1400 |
0.2600 |
1.00 |
|
5 |
2,269.4 |
26.00 |
0.0139 |
0.1400 |
0.2600 |
1.00 |
|
6 |
1,500.3 |
7.00 |
0.0056 |
0.1400 |
0.2600 |
1.00 |
|
7 |
1,000.0 |
44.00 |
0.0184 |
0.1400 |
0.2600 |
10.00 |
|
TOTALS |
|
3,302.00 |
0.6044 |
2.1700 |
4.0300 |
15.50 |
|
Time |
Initial Pop |
Catch |
Fish. Mort. |
Nat. Mort. |
Shed Rate |
Time Units |
|
1 |
9,218.3 |
1,471.00 |
0.3859 |
0.1400 |
0.2600 |
0.50 |
|
2 |
6,223.0 |
1,386.00 |
0.3114 |
0.1400 |
0.2600 |
1.00 |
|
3 |
3,055.1 |
309.00 |
0.1305 |
0.1400 |
0.2600 |
1.00 |
|
4 |
1,797.4 |
59.00 |
0.0404 |
0.1400 |
0.2600 |
1.00 |
|
5 |
1,157.1 |
26.00 |
0.0276 |
0.1400 |
0.2600 |
1.00 |
|
6 |
754.5 |
7.00 |
0.0114 |
0.1400 |
0.2600 |
1.00 |
|
7 |
500.0 |
44.00 |
0.0386 |
0.1400 |
0.2600 |
10.00 |
|
TOTALS |
|
3,302.00 |
1.1003 |
2.1700 |
4.0300 |
15.50 |
|
Time |
Initial Pop |
Catch |
Fish. Mort. |
Nat. Mort. |
Shed Rate |
Time Units |
|
1 |
6,945.2 |
1,471.00 |
0.5296 |
0.1400 |
0.2600 |
0.50 |
|
2 |
4,363.3 |
1,386.00 |
0.4771 |
0.1400 |
0.2600 |
1.00 |
|
3 |
1,815.0 |
309.00 |
0.2293 |
0.1400 |
0.2600 |
1.00 |
|
4 |
967.3 |
59.00 |
0.0768 |
0.1400 |
0.2600 |
1.00 |
|
5 |
600.5 |
26.00 |
0.0539 |
0.1400 |
0.2600 |
1.00 |
|
6 |
381.4 |
7.00 |
0.0224 |
0.1400 |
0.2600 |
1.00 |
|
7 |
250.0 |
44.00 |
0.0854 |
0.1400 |
0.2600 |
10.00 |
|
TOTALS |
|
3,302.00 |
1.9787 |
2.1700 |
4.0300 |
15.50 |
|
Time |
Initial Pop |
Catch |
Fish. Mort. |
Nat. Mort. |
Shed Rate |
Time Units |
|
1 |
5,570.1 |
1,471.00 |
0.6844 |
0.1400 |
0.2600 |
0.50 |
|
2 |
3,238.9 |
1,386.00 |
0.7082 |
0.1400 |
0.2600 |
1.00 |
|
3 |
1,069.4 |
309.00 |
0.4243 |
0.1400 |
0.2600 |
1.00 |
|
4 |
468.9 |
59.00 |
0.1646 |
0.1400 |
0.2600 |
1.00 |
|
5 |
266.6 |
26.00 |
0.1253 |
0.1400 |
0.2600 |
1.00 |
|
6 |
157.7 |
7.00 |
0.0554 |
0.1400 |
0.2600 |
1.00 |
|
7 |
100.0 |
44.00 |
0.3143 |
0.1400 |
0.2600 |
10.00 |
|
TOTALS |
|
3,302.00 |
4.9628 |
2.1700 |
4.0300 |
15.50 |
TABLE 3-24 Estimates of transfer rates from east to west in the Atlantic Ocean, using tagging data and assuming a natural mortality rate of 0.14, a tag shedding rate of 0.26, and an eastern catch of 339 and a western catch of 17, with a ratio of 0.0501.
|
|
Pe = 0.5244 Fe = 0.0430 |
Pe = 0.3616 Fe = 0.0656 |
Pe = 0.1330 Fe = 0.2606 |
|
Pw = 0.9147 Fw = 0.0256 |
Te = 0.0206 |
Te = 0.0216 |
Te = 0.0316 |
|
Pw = 0.6558 Fw = 0.0390 |
Te = 0.0194 |
Te = 0.0204 |
Te = 0.0298 |
|
Pw = 0.4400 Fw = 0.0710 |
Te = 0.0171 |
Te = 0.0179 |
Te = 0.0262 |
|
Pw = 0.3315 Fw = 0.1277 |
Te = 0.0141 |
Te = 0.0148 |
Te = 0.0217 |
|
Pw = 0.2659 Fw = 0.3202 |
Te = 0.0096 |
Te = 0.0101 |
Te = 0.0147 |
|
Pw = Fraction of captured tags which are reported in the west. Pe = Fraction of captured tags which are reported in the east Fw = Annual instantaneous fishing mortality rate in the west. Fe = Annual instantaneous fishing mortality rate in the east. Te = Annual instantaneous rate of transfer from the east to the west. |
|||
TABLE 3-25 Estimates of transfer rates from west to east in the Atlantic Ocean, using tagging data and assuming a natural mortality rate of 0.14, a tag shedding rate of 0.26, and a western catch of 3037 and an eastern catch of 65, with a ratio of 0.0214.
|
|
Pw = 0.9147 Fw = 0.0256 |
Pw = 0.4400 Fw = 0.0710 |
Pw = 0.2659 Fw = 0.3202 |
|
Pe = 0.5244 Fe = 0.0430 |
Tw = 0.0099 |
Tw = 0.0131 |
Tw = 0.0358 |
|
Pe = 0.3616 Fe = 0.0656 |
Tw = 0.0098 |
Tw = 0.0130 |
Tw = 0.0356 |
|
Pe = 0.1330 Fe = 0.2606 |
Tw = 0.0096 |
Tw = 0.0127 |
Tw = 0.0347 |
|
Pe = 0.1037 Fe = 0.4739 |
Tw = 0.0089 |
Tw = 0.0119 |
Tw = 0.0324 |
|
Pe = 0.0978 Fe = 0.5995 |
Tw = 0.0085 |
Tw = 0.0114 |
Tw = 0.0311 |
|
Pw = Fraction of captured tags which are reported in the west. Pe = Fraction of captured tags which are reported in the east. Fw = Annual instantaneous fishing mortality rate in the west. Fe = Annual instantaneous fishing mortality rate in the east. Tw = Annual instantaneous rate of transfer from the west to the east. |
|||
|
|
Western Atlantic Ocean |
||
|
(1) |
Pw = 0.9147 |
Fw = 0.0256 |
Zw = 0.4256 |
|
(2) |
Pw = 0.6558 |
Fw = 0.0390 |
Zw = 0.4390 |
|
(3) |
Pw = 0.4400 |
Fw = 0.0710 |
Zw = 0.4710 |
|
(4) |
Pw = 0.3315 |
Fw = 0.1277 |
Zw = 0.5277 |
|
(5) |
Pw = 0.2659 |
Fw = 0.3202 |
Zw = 0.7202 |
These estimates were used to compute a variety of transfer rates from east to west (Table 3-24) and from west to east (Table 3-25). Not all combinations of P values are used in Tables 3-24 and 3-25 because other results were inconsistent with VPA estimates of Chapter 4.
DISCUSSION
Shedding rates appear to be 0.20 or higher (Table 3-11). Rates estimated by comparing double-double returns to double-single returns should be the most robust estimates, because the two groups originated from the same group of tags and should have been exposed to similar histories. Rates appear to be higher in the first several quarters. Two different sets of shedding rates were used in the VPA analysis (Tables 3-12 to 3-15).
The results of this reanalysis of tagging data provide quantitative confirmation of the empirical results on transfer rates presented earlier in Chapter 3. Although the committee was unable to obtain variance estimates for these transfer rates due to time constraints, results are robust with respect to reporting rate, the parameter most likely to affect the results. Thus, the results are expected to be statistically significant. However, movement of fish from west to east seems to have varied from year to year (Table 3-16). Movement from west to east also seems to have a cumulative effect, with the percent caught in the east increasing as a function of the amount of time the tags were attached to the fish (Table 3-17).
Annual transfer rates estimated with the model (equations 1 and 2) are about 0.01 for west to east, about 0.02 for east to west, and 0.03 overall. These rates depend to a great extent on the nonreporting rate for captured tagged fish. The VPA analysis on the Spanish data is especially indicative of a high nonreporting rate. The nonreporting rate for the west could also be high. Little can be said about the estimate of natural mortality from these data. However, even though there is good reason to be skeptical about the nonreporting rate and natural mortality rate, the transfer rates are almost certainly low, because the number of tags recovered in the other area is small compared to the total tags recovered.
Information is not available to determine whether a transfer from one side
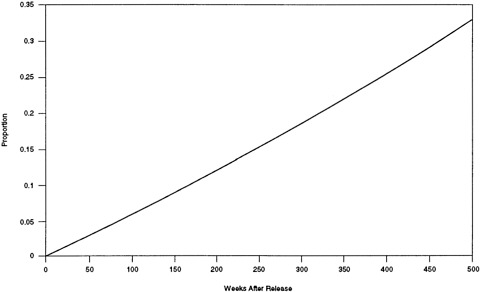
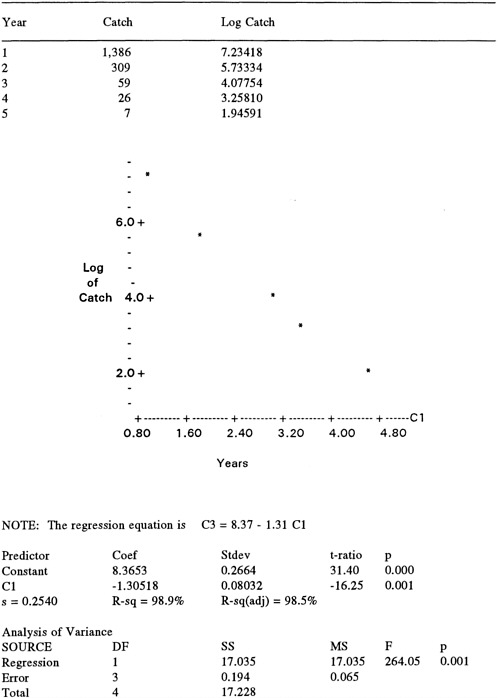
FIGURE 3-1 Proportion of tagged bluefin tuna in area 2 (eastern Atlantic Ocean) that were originally released in area 1 (western Atlantic Ocean) for a hypothetical population with Tw = 0.03, F = 0.1, and M = 0.14.
to the other is permanent. The consequences of returning would give a different meaning to the data. If fish that transfer each year do not return, even a low transfer rate will cause a significant portion of the spawning-age fish produced as recruits on one side to be on the other side when they are sexually mature. Figure 3-1 shows the increasing proportion of tagged fish in area 2 that were originally released in area 1 for a hypothetical population with T = 0.03, F = 0.1, and M = 0.14. After 300 weeks (about 6 years), the proportion is up to 0.20 even though the annual transfer rate is only 0.03; that is, 20% of the fish on one side of the Atlantic Ocean will have originated from the other side. This example shows that small annual transfer rates can have a large effect on population dynamics over a relatively short time period.
Because none of the fish tagged in the eastern Atlantic Ocean were from the Mediterranean Sea, caution should be exercised in interpreting the east to west movement rate.
Estimates of Pe and Pw obtained from Tables 3-22 and 3-23 were calculated with the assumption of no type I (initial) tagging mortality. If some, or most, of the differences between the VPA estimates of age 1 fish in the east and west result from type I mortality, the estimates of Pe and Pw would be incorrect. However, it is the ratio Pe/Pw that appears in equation 3, and if the type I mortality was the same for east and west, the ratio would still be the same as the estimates used to estimate Tw.


