
8
American Indian Poverty on Reservations, 1969-1989
Ronald L. Trosper
Introduction
This chapter uses census data to describe changes in poverty and income on 23 Indian reservations over a 20-year period, 1969-1989. The principal conclusion is that the percentage of American Indian families living in poverty fell significantly in the 10-year period 1969-1979, but that these gains were eroded over the subsequent decade. In 1969, approximately one in three American Indian families was living in poverty throughout the nation. By 1979, this fraction had fallen to just less than one in four. Beginning around 1980, however, the position of many American Indian families deteriorated, so that by 1989, the number of American Indian families in poverty had risen to 27 percent.
On the 23 reservations for which we have 20 years of data, the pattern was similar. In 1969, 57 percent of the families on these reservations were below the poverty threshold. By 1979, this number had fallen to 43 percent. In the next decade, poverty increased, and in 1989 over half of the American Indian families on these reservations were in poverty. Although the reservations began the period with large differences in poverty
I would like to thank the staff of the Institute for Native Americans at Northern Arizona University, Bill Hildred for discussions on gaming, Michael Yellow Bird and other participants in the workshop for helpful comments, the anonymous reviewers, and the National Indian Policy Center for 1980 and 1990 census data extracts in its Indian Country Data System.
rates and levels of income, the broad trend described above affected nearly all of them. Family poverty rates decreased on all but 2 of the 23 reservations in the first decade, and increased on all but 3 in the second decade. Other measures of well-being, such as per capita income, median family income, the unemployment rate, and the labor force participation rate, followed similar patterns. Casual observation suggests that these trends parallel trends in real federal expenditures on Indian reservations.
Data
The national censuses of 1970, 1980, and 1990 allow comparisons over time using data that were collected in a relatively consistent manner for 23 reservations. The 1970 census subject report on American Indians (U.S. Bureau of the Census, 1973) determined the selection of reservations for comparison in the present analysis. Although later census data provide extensive coverage of reservations, the data in the 1970 census are essential if one wishes to examine changes over time. Comparisons are made for two measures of income, two measures of poverty, and two measures of labor market conditions. Median family income and per capita income, converted to 1989 dollars using the consumer price index, allow for a comparison of changes in income levels. The U.S. Bureau of the Census held the definition of poverty constant in real terms over the 20-year period, and the percentages of families and individuals in poverty provide evidence of changes in the living standards of the poorest Indians. While incomplete as measures of economic activity, the unemployment rate and the labor force participation rate both provide a glimpse of the condition of labor markets.1
Descriptive Results
Table 8-1 provides national data on the key measures for all Americans, whites, blacks, and American Indians. For median family income, changes for the total U.S. population, for whites, and for blacks are similar. Median family income increased about 5-6 percent for each of the
TABLE 8-1 National Data on American Indians Compared with Whites and Blacks
|
|
Median Family Income in 1989 dollars |
Percentage Change |
|||
|
Population |
1969 |
1979 |
1989 |
1969-1979 |
1979-1989 |
|
Total U.S. |
31,863 |
33,404 |
35,225 |
0.05 |
0.05 |
|
Whites |
33,095 |
34,944 |
37,152 |
0.06 |
0.06 |
|
Blacks |
20,158 |
21,129 |
22,429 |
0.05 |
0.06 |
|
American Indians |
19,377 |
23,017 |
21,750 |
0.19 |
-0.06 |
|
|
Per Capita Income in 1989 dollars |
Percentage Change |
|||
|
Population |
1969 |
1979 |
1989 |
1969-1979 |
1979-1989 |
|
Total U.S. |
10,429 |
12,240 |
14,420 |
0.17 |
0.18 |
|
Whites |
11,011 |
13,095 |
15,687 |
0.19 |
0.20 |
|
Blacks |
6,040 |
7,623 |
8,859 |
0.26 |
0.16 |
|
American Indians |
5,226 |
7,844 |
8,328 |
0.50 |
0.06 |
|
|
Percent of Families in Poverty |
|
|
||
|
Population |
1969 |
1979 |
1989 |
|
|
|
Total U.S. |
10.7 |
9.6 |
10.0 |
|
|
|
Whites |
8.6 |
7.0 |
7.0 |
|
|
|
Blacks |
29.8 |
26.5 |
26.3 |
|
|
|
American Indians |
33.3 |
23.7 |
27.0 |
|
|
|
SOURCES: U.S. Bureau of the Census (1972, 1983, 1993b). All dollar values are adjusted by use of CPI-U (Consumer Price Index, All Urban Consumers) from the Bureau of Labor Statistics, reported in Table 8-4. |
|||||
decades. Indians show a dramatic difference: an increase of 19 percent for the first decade and a decline of 6 percent for the second. These trends are even more dramatic for per capita income, also shown in Table 8-1. The total U.S. population had an increase of 17 percent for the 10 years between 1969 and 1979 and of 18 percent in 1979–1989. Indians had a 50 percent increase in the first decade and only a 6 percent increase in the second.
A similar pattern exists for the percentage of families in poverty. Changes are relatively small for the total U.S. population, for whites, and
TABLE 8-2 Summary of Results for 23 Reservations
|
|
Number of Reservations |
|||
|
|
1970-1980 |
1980-1990 |
||
|
|
Improved |
Deteriorated |
Improved |
Deteriorated |
|
Median family income (+) |
21 |
2 |
1 |
22 |
|
Per capita income (+) |
23 |
0 |
5 |
18 |
|
% of families in poverty (-) |
21 |
2 |
3 |
20 |
|
% of persons in poverty (-) |
21 |
2 |
2 |
21 |
|
Unemployment |
||||
|
Male |
9 |
14 |
1 |
22 |
|
Female |
9 |
14 |
6 |
17 |
|
Labor force participation (+) |
||||
|
Male |
21 |
2 |
10 |
13 |
|
Female |
22 |
1 |
11 |
12 |
|
SOURCE: U.S. Bureau of the Census: (1973, 1983, 1993a, 1993b, 1993c); Stinson and Plantz (1986). |
||||
for blacks. All groups show a decrease in poverty from 1969 to 1979, most dramatically American Indians. But only Indians had a major increase in poverty rates in the second decade.
Table 8-2 presents summary results for the 23 reservations for which data are available for 1970, 1980, and 1990. For each of the measures of Indian income and poverty, it gives the number of reservations for which the measure improved or deteriorated from 1970 to 1980 and 1980 to 1990. Nearly every reservation had an increase in income and a decrease in poverty during 1970-1980 and a decrease in income and an increase in poverty in 1980-1990. As shown in Table 8-3, although 5 reservations had an increase in per capita income in the second decade, 2 of these 5 had an increase in poverty rates among families during that same time.
The patterns for unemployment and for labor force participation are not as dramatic as for income and poverty, but are similar: more improvements in the first decade of comparison than in the second. Unemployment among men and women increased on 14 reservations during the period 1970–1980. Unemployment among men increased on 22 reservations in the decade 1980–1990 and among women increased on 17 of the
TABLE 8-3 Poverty and Income on Selected Reservations, 1969-1989
|
|
Percent of Families Below Poverty Threshold |
Percent Change |
Per Capita Income in 1989 Dollars |
Percent Change |
||||||
|
Name of Reservation |
1969 |
1979 |
1989 |
1969-1979 |
1979-1989 |
1969 |
1979 |
1989 |
1969-1979 |
1979-1989 |
|
Blackfeet Reservation |
47.8 |
29.2 |
45.7 |
-0.39 |
0.57 |
3612 |
5523 |
4718 |
0.53 |
-0.15 |
|
Cheyenne River Reservation |
54.8 |
47.5 |
57.2 |
-0.13 |
0.20 |
3050 |
4299 |
4077 |
0.41 |
-0.05 |
|
Crow Reservation |
40.0 |
29.6 |
45.5 |
-0.26 |
0.54 |
3223 |
5050 |
4243 |
0.57 |
-0.16 |
|
Eastern Cherokee Reservation |
52.2 |
31.6 |
30.0 |
-0.39 |
-0.05 |
3435 |
5142 |
6382 |
0.50 |
0.24 |
|
Flathead Reservation |
32.4 |
34.4 |
31.8 |
0.06 |
-0.08 |
5027 |
5248 |
6428 |
0.04 |
0.22 |
|
Fort Apache Reservation |
53.3 |
39.7 |
49.9 |
-0.25 |
0.26 |
2911 |
3873 |
3805 |
0.33 |
-0.02 |
|
Fort Peck Reservation |
46.7 |
26.8 |
41.8 |
-0.43 |
0.56 |
3857 |
5481 |
4778 |
0.42 |
-0.13 |
|
Gila River Reservation |
58.6 |
44.4 |
62.8 |
-0.24 |
0.41 |
2701 |
4037 |
3176 |
0.49 |
-0.21 |
|
Hopi Reservation |
61.8 |
51.0 |
47.7 |
-0.17 |
-0.06 |
2768 |
4210 |
4566 |
0.52 |
0.08 |
|
Laguna Pueblo |
24.4 |
11.6 |
27.7 |
-0.52 |
1.38 |
4469 |
7416 |
6085 |
0.66 |
-0.18 |
|
Menominee Reservation |
38.0 |
14.9 |
48.8 |
-0.61 |
2.27 |
3585 |
5333 |
4738 |
0.49 |
-0.11 |
|
Navajo Reservation |
62.1 |
47.3 |
54.2 |
-0.24 |
0.15 |
2578 |
4049 |
3817 |
0.57 |
-0.06 |
|
Northern Cheyenne Reservation |
39.8 |
41.7 |
46.4 |
0.05 |
0.11 |
3834 |
4213 |
4479 |
0.10 |
0.06 |
|
Papago Reservation |
78.1 |
49.5 |
62.8 |
-0.37 |
0.27 |
1954 |
3639 |
3113 |
0.86 |
-0.14 |
|
Pine Ridge Reservation |
54.3 |
48.4 |
59.5 |
-0.11 |
0.23 |
3462 |
3705 |
3121 |
0.07 |
-0.16 |
|
Red Lake Reservation |
43.0 |
26.3 |
50.3 |
-0.39 |
0.91 |
3379 |
6886 |
4287 |
1.04 |
-0.38 |
|
Rosebud Reservation |
62.9 |
48.3 |
54.4 |
-0.23 |
0.13 |
2811 |
4166 |
4005 |
0.48 |
-0.04 |
|
San Carlos Reservation |
62.3 |
45.9 |
59.8 |
0.26 |
0.30 |
2283 |
3794 |
3173 |
0.66 |
-0.16 |
|
Standing Rock Reservation |
58.3 |
44.2 |
54.9 |
-0.24 |
0.24 |
3329 |
4364 |
3421 |
0.31 |
-0.22 |
|
Turtle Mountain Reservation |
50.2 |
37.7 |
53.7 |
-0.25 |
0.43 |
3263 |
5600 |
5138 |
0.72 |
-0.08 |
|
Wind River Reservation |
42.0 |
35.2 |
47.8 |
-0.16 |
0.36 |
4040 |
4891 |
4340 |
0.21 |
-0.11 |
|
Yakima Reservation |
45.5 |
25.4 |
42.7 |
-0.44 |
0.68 |
3542 |
6366 |
4904 |
0.80 |
-0.23 |
|
Zuni Pueblo |
56.7 |
41.8 |
47.4 |
-0.26 |
0.13 |
3253 |
3542 |
3904 |
0.09 |
0.10 |
|
Joint Use Area |
|
|
|
|
|
1568 |
|
|
|
|
|
Maximum in Column |
|
|
|
0.06 |
2.27 |
|
|
|
1.04 |
0.24 |
|
Minimum in Column |
|
|
|
-0.61 |
-0.08 |
|
|
|
0.04 |
-0.38 |
|
Number Increasing |
|
|
|
2 |
20 |
|
|
|
23 |
5 |
|
Number Decreasing |
|
|
|
21 |
3 |
|
|
|
0 |
18 |
|
Weighted averages for all reservations |
57.3 |
42.7 |
51.0 |
|
|
2904 |
4341 |
4018 |
|
|
reservations. Labor force participation improved on most reservations in the first decade (which may have contributed to the increase in unemployment rates during the period), but declined on a majority of reservations in the second decade.
Comparisons of Poverty Rates
The first five columns of Table 8-3 report changes in the percentage of families in poverty on each of the reservations during the two decades 1969-1979 and 1979-1989. Relative to the national poverty rates of 10 percent in each of the three observation years, Indians were extremely poor. The proportion of all families on these reservations that were in poverty in 1969 was 57 percent; this figure fell to 43 percent in 1979 and rose to 51 percent in 1989.
The range of poverty rates across reservations was great in each of the observation years. In all three years, the Laguna Pueblo had the lowest poverty rate: 24 percent in 1969, 12 percent in 1979, and 28 percent in 1989. In accordance with the general pattern, the poverty rate on the Laguna Pueblo fell in 1979 and rose in 1989, in this case to higher than it was in 1969. On some reservations, such as the Eastern Cherokee, the poverty rate in 1989 did not exceed that in 1969.
Although the reservation with the highest poverty rate among families was different in each of the three years, the Papago Reservation appears to have been the poorest reservation overall. In 1969, it had a poverty rate of 78.1 percent, which was exceeded only by that of the Navajo-Hopi Joint Use Area, 79.3 percent. In 1979, the Papago Reservation's poverty rate of 49.5 percent was exceeded by that of the Hopi Reservation, which was 51 percent; the Papago Reservation, however, was second in that year. The Hopi Reservation's increased poverty rate from 1969 to 1979 may have been influenced by the division of the Navajo-Hopi Joint Use Area, which occurred in 1977. In 1989, the Gila River Reservation and the Papago Reservation tied for the highest poverty rate at 62.8 percent.
The pattern of changes among reservations is complicated. The size of some of the changes is most impressive. The Blackfeet had a decrease of 39 percent in their poverty rate from 1969 to 1979, followed by an increase of 57 percent to return the rate nearly to where it started. The Flathead Reservation had a modest increase in its poverty rate from 1969 to 1979, followed by a modest decrease. This rather different pattern may have resulted from a large increase in the rental received by the Salish and Kootenai Tribes from Kerr Dam.
Although 20 reservations experienced an increase in the rate of family poverty from 1979 to 1989, only 10 had an increase over the entire 20 years
from 1969 to 1989: Cheyenne River, Crow, Gila River, Laguna Pueblo, Menominee, Northern Cheyenne, Pine Ridge, Red Lake, Turtle Mountain, and Wind River. Although the poorest area in 1969—the Joint Use Area—was incorporated into both the Navajo and Hopi reservations, neither of these reservations had an overall increase in poverty rates for the 20-year period.
Although individual reservation data are not provided here, the pattern of change for persons in poverty is similar to that for families in poverty. The Flathead and Northern Cheyenne reservations were the only ones to have an increase in poverty rates in the first decade. In the second decade, the Flathead and Hopi had a decrease in the percentage of persons in poverty, as well as of families in poverty. The Eastern Cherokee Reservation, which had a decrease in the percentage of families in poverty, had a 3 percent increase in the percentage of persons in poverty.
The above discussion compares rates of poverty, not absolute numbers of families or people in poverty. It is important to note that although rates fell overall, the numbers of families and persons in poverty increased during the period. The number of families in poverty increased from just under 15,000 to just under 28,000, while the number of persons in poverty increased from 88,000 to 139,000.
Comparisons of Income
The last five columns of Table 8-3 report the changes in per capita income on the 23 reservations for the period under consideration. All 23 had an increase in per capita income between 1969 and 1979. There were 5 reservations—Eastern Cherokee, Flathead, Hopi, Northern Cheyenne, and Zuni—that had an increase between 1979 and 1989. Of these, only Eastern Cherokee, Flathead, and Hopi had a decrease in the percentage of families in poverty, and only Eastern Cherokee and Flathead had an increase in per capita income greater than the national average of 18 percent. Thus the general pattern of improvement in the 1970s followed by a decline in the 1980s is shown in the per capita income data as well.
Discussion
What factors were responsible for the above complex patterns of changing poverty rates? To answer this question, one needs to identify factors that moved in opposite directions in the 1980s compared with the 1990s. Such factors would then have a positive or negative correlation with the turn-around in reservation poverty observed in the census data. If we look for a single cause, any variable that was constant or moved in the same direction in both periods should be viewed skeptically. If we
look for a combination of causes, some explicit modeling of possible interactions among variables will be necessary. The following discussion begins with attention to single-variable effects; the discussion ends with two linear regressions that provide a start on multivariate analysis.
Spatial Variations in Income and Poverty
The data in Table 8-3 show that reservations varied tremendously in their poverty rates and levels of per capita income in each of the years under consideration. The scope of this discussion does not include consideration of the causes of different levels of income across reservations at any one time. The amount and quality of land per person on each reservation are the result of its particular history, especially in relation to implementation of the allotment acts as reported by McDonnell (1991). Sutton (1985) and Geisler (1995) provide further discussion of the effects of land taking. Cornell and Kalt review the literature on the causes of economic development on reservations (see Cornell and Kalt, 1992: Kalt and Cornell, 1994); they find that simple explanations based on external opportunity and internal assets are not easy to identify. In their explanations for different levels of income, they include variables such as the characteristics of the tribal government in relationship to the culture of reservations (Cornell and Gil-Swedberg, 1995). Some Indian cultural values do not support maintenance of high levels of income as conventionally defined, since many traditional Indians believe in having a minimal impact on ecosystems. Others give away much of their wealth to other community members (Michael J. Yellow Bird, personal communication, 1995). Consequently, spatial analysis would need to include variations in cultural characteristics as well.
With a sample of only 23 reservations and a list of more than 23 possible determinants of spatial variation in income levels, a cross-sectional analysis would be very difficult, if not impossible. Remarkably, although these 23 reservations started the two decades with great disparities in income and poverty, they followed similar paths of change during 1969-1979. This overall similarity deserves investigation.
Business Cycle Factors
Because of cycles in the levels of economic activity, any comparison of particular years may be distorted by the national business cycle. One could show high growth rates by comparing the trough of one business cycle with the peak of the next. One could show low growth rates with the opposite maneuver: comparing a peak of one cycle with the trough of another. Fortunately, each of the three census years used here for income
TABLE 8-4 General Economic Indicators
|
Indicator |
1969 |
1979 |
1989 |
|
Bureau of Labor Statistics, unemployment |
|||
|
Total |
3.5 |
5.8 |
5.3 |
|
Men > 20 yrs |
2.1 |
4.2 |
4.5 |
|
Women > 20 yrs |
3.7 |
5.7 |
4.7 |
|
White |
3.1 |
5.1 |
4.5 |
|
Black |
NA |
12.3 |
11.4 |
|
Business cycle, reference dates |
|||
|
Trough |
Feb. 1961 |
Mar. 1975 |
Nov. 1982 |
|
Peak |
Dec. 1969 |
Jan. 1980 |
July 1990 |
|
Consumer Price Index—all urban consumers |
36.9 |
73.1 |
122.6 |
|
Gini coefficients of inequality |
|||
|
All workers |
0.466 |
0.464 |
0.467 |
|
All families |
0.349 |
0.365 |
0.401 |
|
SOURCES: Bureau of Economic Analysis, U.S. Department of Commerce (1992); Sacks and Larrain (1993); Levy and Murnane (1992); Nelson (1994). |
|||
data occurred just before the peak of the respective business cycle. The dates of the cycles are given in Table 8-4. In each case, the economy was on the verge of a downturn. The peaks occurred in December 1969, January 1980, and July 1990. This similarity suggests that comparisons of the census income data will not be biased by differences in timing in relation to business cycle activity.
There are differences, however, in the character of the business cycles in question. The 1969 peak was extreme, caused by the expansion of the Vietnam War. That expansion created inflationary pressure that was exacerbated by the subsequent OPEC oil price shock. By 1980, national policy-makers were very concerned about high inflation and had started holding unemployment rates up in order to hold inflation in check. Thus, even in the peak employment years of 1979 and 1989, unemployment rates were high by post-World War II standards. The inflation pattern is evident in the consumer price index: it increased by 3-1/3 times from 1969 to 1979, but only by 1-2/3 times in the next 10 years.
The increase in national unemployment rates in 1979 compared with 1969 is reflected on the reservations: as noted above, 14 of the 23 reservations
had an increase in unemployment rates during this period. In contrast, while the national unemployment rate in 1989 was slightly lower than in 1979 (5.3 versus 5.8 percent), there was an increase in unemployment among men on 22 of the reservations and an increase among women on 17. Thus the pattern of unemployment on reservations in the second decade is not consistent with the national business cycle.
Migration and Changes in Self-identification
Two of the most important candidate trends for explaining the changes in poverty rates are migration and changes in self-identification, which cannot be distinguished in census data. To examine these changes, disaggregation of population data by age cohorts is helpful. With regard to population totals, births of young people and deaths of older people can be distinguished from within-cohort changes due to migration and changes in self-identification. Table 8-5 provides cohort populations for all 23 reservations combined. Births during the 20 years are shown for the four youngest cohorts. Deaths show clearly in the cohort for individuals aged 70 and older.
Cohort sizes fell in 1990 for persons aged 20 to 24 and 25 to 29. A similar pattern occurred in 1980, in which the number of persons in their 20s declined (these people were in their 30s in 1990). Having passed high school age, many persons leave their reservations to attend college and for other reasons, and the data for the cohorts aged 30–39 in 1989 show they did not return in the numbers in which they left. Although the directions of change are similar in the two decades, during 1980 to 1990 there was a greater decline among those aged 20 to 29 as compared with the similar age group during 1970–1980. All cohorts other than those post-high school showed increases in population, which suggests either positive migration to reservations, an increase in self-identification, or better census procedures in locating American Indians.
What would be the effects on income and poverty of the differences in migration rates and self-identification? If we assume that persons in their 20s are typically lower-income earners than older persons, then the greater decline in their numbers in the second decade should tend to increase per capita income, other things being held constant. On the other hand, examination of the cohorts that were in their 30s in 1980 shows that there was a greater increase in people of this age in the first decade than in the 1980s. Assuming people in their 30s are higher-than-average income earners, this would drive income up in 1979 more than in 1989. This is consistent with what was observed.
Comparison of the last two columns of Table 8-5 shows that percentage increases in cohorts tended to be higher in the 1970s than the 1980s.
How could in-migration or increases in self-identification during these periods have affected the patterns of income change discussed above?2 The people who moved into the Indian category in the first 10 years had to have substantially higher income than those already in the category in 1969. (The total increase in per capita incomes was 49 percent.) During the next 10 years, the additional people moving into the category had to have substantially lower incomes than those already in the category (low enough to cause a 7 percent decline in per capita income). In order for migration and self-identification to have affected observed income and poverty enough to explain the change between the decades, there would have to have been a sharp break in the pattern of migration or changes in self-identification across income classes between the two decades. Whatever influence might have caused this shift in pattern would have to have been one that affected the 23 reservations similarly over time.3
Causality could run in the opposite direction: during the 1970s, when reservation economies were becoming prosperous, members of the tribes may have been willing to return to them, whereas during the 1980s, as prosperity declined, fewer people may have been willing to return. More information is needed to determine the contribution of changes in the mix of Indians being counted on the 23 reservations to changes in income data. One cannot dismiss the possibility that there were effects, but to explain the pattern, there would have to be a similar change in the distribution of migration and in self-identification across reservations.
Possible Demographic Explanations
Two other trends that might be associated with changes in poverty and in per capita income are age and persons per family. Median ages increased on 21 reservations from 1970 to 1980 and on 22 reservations from 1980 to 1990. An increase in median age presumably means fewer
|
2 |
Because per capita income is average income, one can use population data to calculate aggregate reservation income, add income over all reservations, and divide by total population to determine per capita income on all 23 reservations combined. This figure is $2,904 for 1969. It increased by 49 percent to $4,341 in 1979. Recall that the increase for the entire United States was 17 percent in that decade. Per capita income declined by 7 percent from 1979 to 1989 on these reservations combined, to a level of $4,020. (Because the Navajo-Hopi Joint Use Area is included in the 1969 data, the comparison is correct geographically for the full 20-year period.) |
|
3 |
Note that the five reservations that had an increase in per capita income in the second decade had patterns of change in the migration of people in their 20s and 30s that are very similar to the patterns of other reservations. See the last four columns of Table 8-6, for Flathead, Hopi, Northern Cheyenne, and Zuni. The Eastern Cherokee Reservation, however, looks very different in its percentage changes. |
TABLE 8-5 Comparison of Cohort Sizes, 1970-1990
|
|
Cohort Population Totals |
Cohort Changes |
Percentage Changes |
||||
|
Cohort Age in 1990 |
1970 |
1980 |
1990 |
1980-1970 |
1990-1980 |
1980-1970 |
1990-1980 |
|
Male all ages |
73,556 |
105,168 |
138,482 |
31,612 |
33,314 |
43 |
32 |
|
Under 5 years |
|
|
19,015 |
|
19,015 |
|
|
|
5 to 9 years |
|
|
18,275 |
|
18,275 |
|
|
|
10 to 14 years |
|
14,291 |
16,381 |
14,291 |
2,090 |
|
15 |
|
15 to 19 years |
|
13,684 |
13,937 |
13,684 |
253 |
|
2 |
|
20 to 24 years |
10,627 |
13,739 |
10,512 |
3,112 |
(3,227) |
29 |
-23 |
|
25 to 29 years |
12,293 |
13,976 |
11,208 |
1,683 |
(2,768) |
14 |
-20 |
|
30 to 34 years |
11,011 |
9,475 |
10,040 |
(1,536) |
565 |
-14 |
6 |
|
35 to 39 years |
8,380 |
7,409 |
8,147 |
(971) |
738 |
-12 |
10 |
|
40 to 44 years |
4,717 |
6,603 |
6,941 |
1,886 |
338 |
40 |
5 |
|
45 to 49 years |
3,763 |
4,978 |
5,252 |
1,215 |
274 |
32 |
6 |
|
50 to 54 years |
3,908 |
4,177 |
4,777 |
269 |
600 |
7 |
14 |
|
55 to 59 years |
3,367 |
3,486 |
3,560 |
119 |
74 |
4 |
2 |
|
60 to 64 years |
2,872 |
3,213 |
3,392 |
341 |
179 |
12 |
6 |
|
65 to 69 years |
2,528 |
2,662 |
2,567 |
134 |
(95) |
5 |
-4 |
|
70 and above |
10,090 |
7,475 |
4,478 |
(2,615) |
(2,997) |
-26 |
-40 |
|
Female all ages |
76,756 |
110,295 |
143,250 |
33,539 |
32,955 |
44 |
30 |
|
Under 5 years |
|
|
18,599 |
|
18,599 |
|
|
|
5 to 9 years |
|
|
17,266 |
|
17,266 |
|
|
|
10 to 14 years |
|
14,545 |
15,742 |
14,545 |
1,197 |
|
8 |
|
15 to 19 years |
|
14,098 |
13,216 |
14,098 |
(882) |
|
-6 |
|
20 to 24 years |
11,011 |
13,041 |
10,674 |
2,030 |
(2,367) |
18 |
-18 |
|
25 to 29 years |
12,334 |
13,854 |
11,743 |
1,520 |
(2,111) |
12 |
-15 |
|
30 to 34 years |
11,186 |
10,348 |
11,374 |
(838) |
1,026 |
-7 |
10 |
|
35 to 39 years |
8,909 |
8,424 |
9,047 |
(485) |
623 |
-5 |
7 |
|
40 to 44 years |
5,281 |
6,574 |
7,476 |
1,293 |
902 |
24 |
14 |
|
45 to 49 years |
4,268 |
5,499 |
5,734 |
1,231 |
235 |
29 |
4 |
|
50 to 54 years |
4,282 |
4,884 |
5,147 |
602 |
263 |
14 |
5 |
|
55 to 59 years |
3,844 |
4,130 |
4,513 |
286 |
383 |
7 |
9 |
|
60 to 64 years |
3,119 |
3,841 |
3,878 |
722 |
37 |
23 |
1 |
|
65 to 69 years |
2,783 |
2,884 |
3,089 |
101 |
205 |
4 |
7 |
|
70 and above |
9,739 |
8,173 |
5,752 |
(1,566) |
(2,421) |
-16 |
-30 |
|
Total population |
150,312 |
215,463 |
281,732 |
65,151 |
66,269 |
43 |
31 |
|
SOURCES: U.S. Bureau of the Census (1973, 1983, 1993c), Stinson and Plantz (1986). |
|||||||
TABLE 8-6 Independent Variables for Selected Reservations, 1969-1989
|
|
Median Age |
Persons per Family |
20s Age Ratio |
30s Age Ratio |
||||||
|
Name of Reservation |
1970 |
1980 |
1990 |
1970 |
1980 |
1990 |
1980 |
1990 |
1980 |
1990 |
|
Blackfeet Reservation |
16.2 |
21.1 |
22.8 |
5.19 |
4.67 |
3.95 |
0.63 |
0.86 |
1.33 |
1.25 |
|
Cheyenne River Reservation |
16.2 |
17.2 |
19.2 |
5.83 |
5.49 |
4.27 |
0.98 |
0.68 |
1.12 |
1.00 |
|
Crow Reservation |
17.0 |
20.1 |
21.9 |
6.63 |
5.67 |
4.74 |
0.97 |
0.77 |
1.48 |
0.91 |
|
Eastern Cherokee Reservation |
19.8 |
22.6 |
26.1 |
4.83 |
3.97 |
3.42 |
0.31 |
1.85 |
0.21 |
2.53 |
|
Flathead Reservation |
20.0 |
20.6 |
24.2 |
4.76 |
4.75 |
3.44 |
0.82 |
0.80 |
1.41 |
1.57 |
|
Fort Apache Reservation |
16.2 |
18.2 |
21.3 |
6.49 |
5.60 |
4.44 |
0.82 |
0.98 |
1.33 |
1.11 |
|
Fort Peck Reservation |
17.4 |
19.9 |
22.3 |
5.98 |
4.61 |
3.82 |
1.00 |
0.91 |
1.22 |
1.11 |
|
Gila River Reservation |
17.9 |
19.9 |
22.7 |
5.93 |
5.22 |
4.17 |
0.99 |
0.92 |
1.88 |
1.00 |
|
Hopi Reservation |
18.3 |
23.1 |
25.9 |
6.39 |
4.87 |
4.46 |
0.89 |
0.61 |
1.18 |
1.12 |
|
Laguna Pueblo |
22.5 |
22.9 |
29.5 |
4.96 |
4.56 |
4.08 |
1.36 |
0.69 |
1.08 |
0.88 |
|
Menominee Reservation |
15.2 |
19.7 |
21.7 |
5.85 |
5.42 |
4.02 |
0.54 |
0.79 |
1.54 |
1.06 |
|
Navajo Reservation |
16.4 |
18.8 |
22.0 |
5.82 |
5.30 |
4.52 |
1.14 |
0.83 |
1.62 |
1.11 |
|
Northern Cheyenne Reservation |
17.6 |
17.8 |
19.9 |
5.13 |
4.87 |
4.10 |
0.78 |
0.67 |
1.00 |
0.97 |
|
Papago Reservation |
21.9 |
21.6 |
24.2 |
5.98 |
5.13 |
3.99 |
1.11 |
0.71 |
1.26 |
1.07 |
|
Pine Ridge Reservation |
16.7 |
17.9 |
18.9 |
5.62 |
5.92 |
4.89 |
0.91 |
0.55 |
1.25 |
0.67 |
|
Red Lake Reservation |
14.8 |
17.9 |
21.3 |
6.24 |
5.08 |
4.06 |
0.50 |
0.68 |
1.04 |
1.22 |
|
Rosebud Reservation |
16.5 |
17.9 |
18.4 |
5.53 |
5.07 |
4.27 |
0.64 |
0.82 |
1.13 |
1.03 |
|
San Carlos Reservation |
16.3 |
19.6 |
21.4 |
6.46 |
5.33 |
4.49 |
0.88 |
0.74 |
1.41 |
0.94 |
|
Standing Rock Reservation |
19.2 |
18.4 |
18.6 |
5.43 |
5.29 |
4.59 |
1.07 |
0.54 |
1.31 |
0.86 |
|
Turtle Mountain Reservation |
16.4 |
19.5 |
18.4 |
5.55 |
4.66 |
3.95 |
0.56 |
1.01 |
1.20 |
1.68 |
|
Wind River Reservation |
18.7 |
19.7 |
21.3 |
5.77 |
5.08 |
4.23 |
0.87 |
0.89 |
0.79 |
1.11 |
|
Yakima Reservation |
16.7 |
20.1 |
21.9 |
5.43 |
4.78 |
4.01 |
1.08 |
0.72 |
2.10 |
1.18 |
|
Zuni Pueblo |
15.4 |
18.8 |
24.1 |
7.95 |
5.93 |
4.91 |
0.85 |
0.85 |
1.24 |
1.00 |
|
Joint Use Area |
16.2 |
|
|
6.24 |
|
|
|
|
|
|
children per adult, and a movement into older age classes means a movement into relatively higher-wage-earning years. Thus, an increase in median age should accompany an increase in income. This occurred in 1969 to 1979, but from 1979 to 1989, incomes decreased.
Persons per family also showed a steady trend, toward lower numbers. There were 22 reservations that had a decrease in persons per family from 1970 to 1980, and all reservations had a decrease from 1980 to 1990. A decrease in persons per family should accompany an increase in per capita income and a decrease in poverty, given steady incomes for the adults in a family. Thus, the increase in per capita income and the decrease in persons per family from 1969 to 1979 are understandable. But from 1979 to 1989, there was a decrease in per capita income at the same time that there was a further decrease in persons per family.
Possible Political Explanations
President Nixon initiated tribal self-determination in 1970, although the law was not changed until Public Law 92-638 was adopted in 1975. Cornell and Kalt (1992) propose that tribal self-determination causes economic development. Although we do not have quantitative measures of tribal self-determination, it apparently increased during both decades.
Changes in Federal Expenditures
Federal spending priorities changed from preservation of the social safety net during the 1970s to military spending and tax cuts during the Reagan years after 1980. Figure 8-1 shows the trends in real budget amounts for the total Indian budget and for components of the budget from the mid-1970s to 1991. Expenditures of the Labor Department are omitted from these trends. In real terms, expressed in 1990 dollars, federal expenditures for Indian programs peaked in 1979 at a total of $4,446,000,000. By 1989, federal expenditures had fallen to $2,500,000,000. A large component of the decline was expenditures for Indian housing. Within the Bureau of Indian Affairs (BIA) budget, expenditures for economic development programs were $143.3 million in 1979 and $47.2 million in 1989 (U.S. Senate, 1992). 4
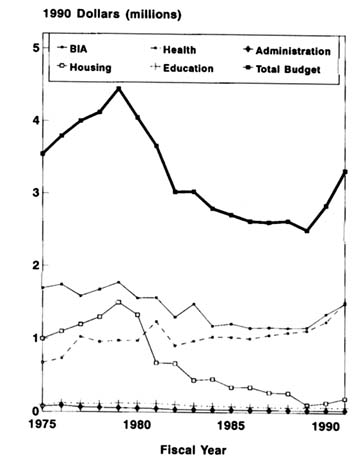
FIGURE 8-1 Budget data for elements of the Indian budget in 1990 dollars. NOTES: BIA, Bureau of Indian Affairs; Health, Indian Health Service; Administration, Administration for Native Americans; Housing, Indian Housing Program for U.S. Department of Housing and Urban Affairs; Education, Indian Education Office in U.S. Department of Education; Total Budget, overall Indian Budget.
SOURCE: U.S. Senate (1992).
The public sector plays an important role on most reservations. Employment in federal agencies and in programs funded by federal agencies and administered by tribes are significant sources of money for reservation economies. Thus reductions in the public-sector role should have large effects on economic activity as measured by census income data.
In 1990, the population of the 23 reservations was 282,000; the enumerated population on all reservations was 730,000. Thus the 23 reservations
accounted for 39 percent of the reservation population. The following comparison of magnitudes assumes that federal expenditures were proportional among reservation residents. In 1979, total federal expenditures on reservations expressed in 1990 dollars were $4.4 billion; of this sum, $1.7 billion would have been spent for the 23 reservations. In the next decade, the population on reservations increased by 31 percent, while the federal expenditures decreased by 57 percent. Measured in 1990 dollars, identified federal expenditures on reservations in 1989 were $2.5 billion; about $1.0 billion of this would have been spent on these 23 reservations. Federal expenditures per person on these 23 reservations would have been approximately $7,900 in 1979 and $3,500 in 1989.5
Increases in Wage Inequality
One other factor that might contribute to the turn-around in poverty levels on reservations is the general increase in inequality of the American economy. Table 8-4 provides information on the trends in wage inequality and total inequality over the 20 years under consideration. Harrison and Bluestone (1988) note that there has been a ''great U-turn" in the patterns of inequality in the United States. Until the 1970s, inequality decreased. Subsequently, however, it increased. Nelson (1994) provides Gini coefficients based on median family income for 1969, 1979, and 1989, showing that inequality as measured by family income increased in both the 1970s and 1980s, with a greater increase in the 1980s. Trends in inequality in wage income are less easily observed at the overall level; however, Levy and Murnane (1992) review data showing that within groups of wage earners (men, women, men and women classed by educational attainment), inequality was fairly level in the 1970s, but grew rapidly in the 1980s. Thus while it would appear that increases in inequality occurred in both decades, a pattern that is not consistent with the large income increases on reservations in the 1970s, the fact that inequality growth accelerated in the 1980s may have contributed to the income declines observed on reservations.
Changes in Gambling and Casinos as a Possible Explanation
Because gaming has become important on reservations, two questions arise. First, was gaming important in 1989? Second, since federal
budget expenditures are probably continuing to fall and will not increase, will increases in gaming income reverse the pattern of the 1980s? The answer to the first question is no; widespread gaming is a phenomenon of the 1990s. According to International Gaming and Wagering Business, the total amount wagered on Indian reservations was $0.3 billion in 1987, $0.4 billion in 1989, and $29.0 billion in 1993 (Christiansen, 1990, 1994). Bingo, however, was important on some reservations in the 1970s. Of the 23 reservations, three had significant bingo revenue in 1987: Eastern Cherokee, Menominee, and Red Lake (Cordiero, 1992). Of these three, only Eastern Cherokee departed from the overall pattern and had improvements in income and decreases in poverty.
Since 1990, gaming has become important on selected reservations; among the 23 examined here, 8 did not have gaming or a gaming compact as of 1995: Blackfeet, Cheyenne River, Flathead, Hopi, Navajo, Wind River, Yakima, and Zuni. All the others are probably developing gaming to some degree. By 1999, one would expect to see dispersion in income and poverty on Indian reservations: those with large successful gaming operations will do well, and those without will not. If the federal government uses gaming as an excuse for further across-the-board reductions in its reservation expenditures, tribes without gaming will be hard hit. Whether gaming will survive as an income source is also an open question since many state governments oppose Indian gaming, and the Supreme Court recently decided that a tribe could not sue a state in federal court to force the state to negotiate a gaming compact.
Multivariate Analysis
Multivariate analysis can help sort out the influences of the various factors just discussed. Unfortunately, no data are available for federal expenditures by reservation for each of the years observed. Such data would directly test the influence of changes in the federal budget on income and poverty rates. While a more complete analysis could use such additional data, the results presented here are based on dummy variables for 1979 and 1989, median age, average family size, and two ratios that reflect migration and changes in self-identification.
The dummy variables for 1979 and 1989 should catch the effects of all omitted variables that correlate with national trends or are not adequately correlated with included variables. The dummy for 1979 should show an increase in income and a decrease in poverty. The dummy for 1989 should show a decrease in income and an increase in poverty. These patterns are consistent with the changes in the federal budget and in inequality. Increases in median age should increase per capita income and decrease
poverty rates. Larger family sizes should result in lower per capita income and greater percentages of families in poverty.
Migration and changes in self-identification are measured by two age ratios that showed significant average changes across the reservations in the results reported in Table 8-4. The "20s age ratio" is the numbers of persons aged 20 to 29 divided by the number of persons aged 10 to 19 in the previous census. Because of the low earning ability of this age group, an increase in this ratio should be associated with a decrease in per capita income and an increase in poverty. The "30s age ratio" is the number of persons aged 30 to 39 divided by the number of persons aged 20 to 29 in the previous census. Because persons in this age group have higher wages, an increase in this ratio should lead to an increase in per capita income and a decrease in poverty. Because we do not have data by age for these reservations in 1960, we cannot construct these variables for the 1970 census. To test for the effects of migration and changes in self-identification, the database must be reduced to 1980 and 1990.
Table 8-7 presents three ordinary least-squares regressions with per capita income as the dependent variable. The independent variables are provided in Table 8-6. The first regression uses the 70 observations available for the three census years.6 All variables have the expected signs. The dummy for 1989 does not have a large t-value. The regression explains 55 percent of the variation in per capita income. The second regression is just like the first, but for the smaller sample of 46 observations available for 1980 and 1990. The reference year for the constant term switches to 1979, and the coefficients change in size but not signs. The third regression adds the two age ratios to the second regression. The age ratios have the expected signs, but only the 30s age ratio has a large t-value. The effect of adding the variables is to reduce the size of the constant term and the dummy for 1989; the coefficients for median age and persons per family do not change much. After controlling for the demographic changes measured by these variables, there still is a significant negative impact on income in moving from 1979 to 1989.
Table 8-8 has the same structure as Table 8-7, with a change in dependent variable to the percentage of families in poverty. The signs of all variables are as expected. Neither the 20s nor 30s age ratios have high t-values. The increase in poverty from 1979 to 1989 remains significant after controlling for changes in age, persons per family, and age ratios.
TABLE 8-7 Multivariate Analysis of Per Capita Income
|
|
1969-1989 |
1979-1989 |
|||||||
|
|
Coeff. |
Stand. Error |
t-value |
Coeff. |
Stand. Error |
t-value |
Coeff. |
Stand. Error |
t-value |
|
Constant term |
6482 |
1702 |
3.81 |
9592 |
2250 |
4.26 |
8700 |
2257 |
3.86 |
|
Dummy for 1979 |
812 |
269 |
3.02 |
|
|
|
|
|
|
|
Dummy for 1989 |
-520 |
381 |
-1.36 |
-1781 |
339 |
-5.26 |
-1654 |
339 |
-4.88 |
|
Median age |
79 |
49 |
1.63 |
88 |
57 |
1.53 |
86 |
57 |
1.50 |
|
Persons per family |
-792 |
198 |
-4.01 |
-1275 |
301 |
-4.23 |
-1224 |
297 |
-4.13 |
|
Twenties age ratio |
|
|
|
|
|
|
-303 |
641 |
-0.47 |
|
Thirties age ratio |
|
|
|
|
|
|
730 |
431 |
1.69 |
|
Standard error of est. |
787 |
|
|
789 |
|
|
774 |
|
|
|
R squared |
0.55 |
|
|
0.45 |
|
|
0.49 |
|
|
|
No. of observations |
70 |
|
|
46 |
|
|
46 |
|
|
|
Degrees of freedom |
65 |
|
|
42 |
|
|
40 |
|
|
TABLE 8-8 Multivariate Analysis of Percent of Families in Poverty
|
|
1969-1989 |
1979-1989 |
|||||||
|
|
Coeff. |
Stand. Error |
t-value |
Coeff. |
Stand. Error |
t-value |
Coeff. |
Stand. Error |
t-value |
|
Constant term |
0.329 |
0.223 |
1.47 |
0.345 |
0.250 |
1.36 |
0.415 |
0.260 |
1.60 |
|
Dummy for 1979 |
-0.075 |
0.035 |
-2.12 |
|
|
|
|
|
|
|
Dummy for 1989 |
0.127 |
0.050 |
2.55 |
0.217 |
0.038 |
5.69 |
0.208 |
0.039 |
5.33 |
|
Median Age |
-0.011 |
0.006 |
-1.74 |
-0.016 |
0.006 |
-2.54 |
-0.017 |
0.007 |
-2.54 |
|
Persons per family |
0.066 |
0.026 |
2.54 |
0.069 |
0.034 |
2.02 |
0.064 |
0.034 |
1.88 |
|
Twenties age ratio |
|
|
|
|
|
|
0.052 |
0.074 |
0.71 |
|
Thirties age ratio |
|
|
|
|
|
|
-0.068 |
0.050 |
-1.37 |
|
Standard error of est. |
0.103 |
|
|
0.089 |
|
|
0.089 |
|
|
|
R Squared |
0.40 |
|
|
0.47 |
|
|
0.50 |
|
|
|
No. of Observations |
70 |
|
|
46 |
|
|
46 |
|
|
|
Degrees of Freedom |
65 |
|
|
42 |
|
|
40 |
|
|
Conclusion
Because of the important role played by federal expenditures on Indian reservations, it is plausible that reductions in real federal budget expenditures on Indian programs and components of the social safety net contributed to the sharp increase in Indian poverty in the 1980s. Other trends may have contributed, particularly the general increase in inequality in the United States. Also, there may have been changes in the characteristics of the people migrating to reservations or deciding to self-identify as Indian. The multivariate analysis in the preceding section controls for two demographic variables and two variables related to migration and changes in self-identification. Increases in age and decreases in family size, both of which worked to reduce poverty, did not have a large enough impact to counteract negative effects on American Indian income. A more complete analysis would draw on disaggregated data on federal expenditures—which would be difficult to assemble—and would control for variables such as education and occupation. These results suggest but do not unequivocally establish the role of federal expenditures in explaining changes in American Indian poverty.
References
Bureau of Economic Analysis, U.S. Department of Commerce 1992 Business Statistics: 1963-91. 27th Edition. Washington, D.C.: U.S. Government Printing Office.
Christiansen, E.M. 1990 1989 gross annual wage. International Gaming and Wagering Business 11(7):29.
1994 1993 gross annual wage. International Gaming and Wagering Business 15(7):16.
Cordiero, E. 1992 The economics of bingo: Factors influencing the success of bingo operations on American Indian reservations. Pp. 205-238 in S. Cornell and J.P. Kalt, eds., What Can Tribes Do? Strategies and Institutions in American Indian Economic Development. Los Angeles, CA: American Indian Studies Center, UCLA.
Cornell, S., and M.C. Gil-Swedberg 1995 Sociohistorical factors in institutional efficacy: Economic development in three American Indian cases. Economic Development and Cultural Change 43(2):239-268.
Cornell, S., and J.P. Kalt 1992 Reloading the dice: Improving the chances for economic development on American Indian reservations. Pp. 1-59 in S. Cornell and J.P. Kalt, eds., What Can Tribes Do? Strategies and Institutions in American Indian Economic Development. Los Angeles, CA: American Indian Studies Center, UCLA.
Geisler, C. 1995 Land and poverty in the United States. Land Economics 71(1):16-34.
Harrison, B., and B. Bluestone 1988 The Great U-Turn: Corporate Restructuring and the Polarizing of America. New York: Basic Books.
Kalt, J.P., and S. Cornell 1994 The redefinition of property rights in American Indian reservations: A comparative analysis of Native American economic development. Pp. 121-150 in L.H. Legters and F.J. Lyden, eds., American Indian Policy: Self-Governance and Economic Development. Westport, CT: Greenwood Press.
Levy, F., and R.J. Murnane 1992 U.S. earnings levels and earnings inequality: A review of recent trends and proposed explanations. Journal of Economic Literature 30(3):1331-81.
McDonnell, J.A. 1991 The Dispossession of The American Indians:1887-1934. Bloomington, IN: Indiana University Press.
Nelson, C.T. 1994 Levels of and changes in the distribution of U.S. income. Pp. 29-63 in J.H. Bergstand, ed., The Changing Distribution of Income in an Open U.S. Economy. Amsterdam: North-Holland.
Otis, D.S. 1973 The Dawes Act and the Allotment of Indian Land. Norman, OK: University of Oklahoma Press.
Sacks, J.D., and F.B. Larrain 1993 Macroeconomics in the Global Economy. Englewood Cliffs, NJ: Prentice Hall.
Snipp, C.M. 1989 American Indians: The First of This Land. New York: Russell Sage Foundation.
Stinson, F.S., and M.C. Plantz. 1986 The American Indian/Alaska Native Data Base. Available from National Technical Information Service, Tape PB87-152732, Documentation PB87-152724. Washington, D.C.: CSR, Inc.
Sutton, I., ed. 1985 Irredeemable America. Albuquerque, NM: University of New Mexico Press.
U.S. Bureau of the Census 1972 General Social and Economic Characteristics: United States Summary . Subject Reports PC(1)-C1. Washington, D.C.: U.S. Government Printing Office.
1973 American Indians. 1970 Census of Housing and Population, Subject Report PC(2)-1F. Washington, D.C.: U.S. Government Printing Office.
1983 General Social and Economic Characteristics. 1980 Census of Housing and Population. Washington, D.C.: U.S. Government Printing Office.
1993a American Indian and Alaska Native Areas. 1990 Census of Housing and Population. Washington, D.C.: U.S. Government Printing Office.
1993b Social and Economic Characteristics. 1990 Census of Housing and Population. Washington, D.C.: U.S. Government Printing Office.
1993c Summary Tape File 3 on CD ROM. 1990 Census of Housing and Population. Suitland, MD: Data User Services.
U.S. Senate 1992 Budget Views and Estimates for Fiscal Year 1993. Select Committee on Indian Affairs 102d Congress, 2d Session (S. Prt. 102-91). Washington, D.C.: U.S. Government Printing Office.


