
ADDITIONAL COMMENTS
The radon released to the environment from the K-65 storage silos was found to be the principal pathway for radiation exposure of the surrounding population. The amount of radon released must therefore be estimated with particular care. However, the sections dealing with this in the RAC's task 6 report are not self-contained but rely heavily on information presented in the task 2 and 3 reports and are not reproduced here. Two methods of estimating radon releases are presented, termed the “conventional method” and the “preferred method.” These methods are not defined specifically; the closest to a description is shown in a flow diagram (figure 15 in volume I of the RAC report), which does not clearly address the fundamental differences involved.
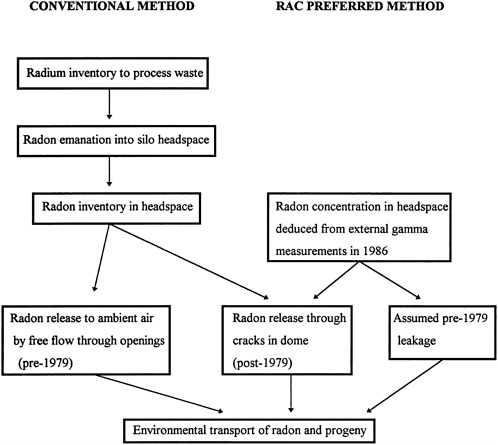
A better flowsheet for the 2 methods might look like the illustration in figure 1 on the next page. The 2 methods differ essentially in how the original radon source term is obtained. They use the same assumptions regarding escape to the outside air before and after the 1979 sealing of major openings in the silos, and both assume that diurnal warming of the headspace is the principal driving force to radon release.
The Conventional Model
Table Q-1 provides the starting point for this approach. The 2 silos contained roughly 20 million pounds of uranium tailings and process waste with an estimated radium content of 389 mg/ton (with an unspecified assay uncertainty). That translates to a radium inventory of about 389 mg/ton × 10,000 tons = 3,890,000 mg (3,890 Ci of radium), contained in a cylindrical mass about 18 ft high. The waste material consisted mainly of dewatered but moist granular material, so any radon emanation into the headspace would have to come primarily from the top 2 ft of this mass (Zettwoog and others, 1982, Sogaard-Hansen and Damkjaer, 1987). Assuming some homogeneity in the source volume, this layer would contain about 3,890/9 or 432 Ci of radium in equilibrium with 432 Ci of radon.
Table Q-3 lists measured emanation fractions ranging from 0.10 to 0.66; taking a high value of 0.5 results in a headspace inventory —under stable, no-loss conditions—of about 200
Ci of radon for the 2 silos combined. If the combined headspace volume for the 2 silos is about 57,000 ft3 (Task Report 2/3, page J-29), this leads to a radon concentration of 3.4 mCi/ft3, or about 120 µCi/L, assuming minimal outflow. This is a condition that might be encountered after the 1979 “sealing” of the dome.
If one assumes substantial “unconstrained” leakage to the outside under pre-1979 conditions, the concentration would decrease greatly, and the transient concentration in the headspace would be determined by the radon influx from emanation from the waste mass, governed by the 3.68-day half-life of radon-222, and the outflow “leakage” rate via major cracks in the dome. Because there was no obvious entry path to replenish air losses vented to the outside other than inflow through the same cracks during the nightly air-volume contraction, the amount of air and hence the radon lost by diurnal warming are necessarily small; however, actual radon concentrations would be substantially lower than the “steady-state” inventory estimated above. Page Q-12 quotes an earlier Department of Energy estimate of 3,000 pCi/L, equivalent to an effective inventory of about 5 mCi for the 2 silos, perhaps not an unreasonable source term.
The Preferred Method
In his method, the radon inventory was derived from 1986 measurements of the gamma-ray field sensed by a detector held against the outside of the sealed dome. No value is presented for this source term in the task 6 report; reference to page J-41 of the RAC task 2/3 report indicates a 1988 estimate of 26.2 µCi/L ± 100% for the sealed dome, that is, a headspace inventory of 52.8 Ci radon, not an unreasonable fraction of the “steady-state” value of 194 Ci postulated above. Because of the method of determination and the lack of specificity about the timing of the measurement in relation to the dirunal cycle, this value is necessarily subject to a substantial uncertainty. It does, however, agree well with a 1987 measurement of radon concentration (RAC task 2/3 report, page J-28): 22 µCi/L. However, as pointed out above, those values are of little help in estimating releases during the pre-1979 period, when concentrations in the cracked dome were substantially lower, as indicated above, and barely sustained by radon emanation from the waste volume.
Table N-1 lists some measured radon-flux measurements made in 1984 over various locations on the sealed, but cracked silo dome. Flow rates vary substantially with even nominally intact locations competing in some cases with flow at visible cracks. Flow measurements range from 36 to 2.2 × 10 7 pCi m-2s -1. A few serious leaks clearly would dominate the outflow. Page N-4 quotes a lower-bound estimate of total radon releases from the 2 silos as 7 × 10 6 pCi/s, corresponding to 2 × 10 11 pCi for an 8-h daytime release in a volume of 2-6.3 × 10 7 L. This would represent 2-3 headspace volume changes per day—an unlikely scenario, in that it would lead to immediate depletion of the radon in the headspace. The situation would be even more implausible at the pre-1979 leakage rate.
An additional modifying factor might arise from the fact that the silos were downwind of the processing building and therefore subject to a dust plume during the early operating years. That provided a relatively large population of coarser attachment particles which, through close-in gravitational settling, contributed additional radon-progeny depletion of the plume.


