
E
Model for Estimating Calcium Intake for Desirable Calcium Retention
The model used for fitting the relationship between calcium intake and calcium retention is described by the equation: Y = aeL/(1 + eL) + d, where Y is retention and L is a linear function of intake (L = b + c [intake]; where b is the intercept and c is the slope of function) (Jackman et al., 1997). The model was used to determine an estimate of calcium intake required to achieve the selected value for desirable calcium retention.1
As described in the initial version of this report, when the application of this model to the data was proposed it was thought that it could predict the lowest value of the plateau intake of calcium at which mean percent maximal calcium retention would occur in a group of individuals. This was considered advantageous in that it estimated a relative measure (percent of an individual's maximum) rather than an absolute measure (a quantified pre-set level of retention) as errors often associated with balance studies would have negligible impact.
Subsequent to the release of the initial version of this report, statistical issues were raised related to the use of percent maximal retention in the way initially described in the prepublication report. The non-linear regression curves derived by applying the Jackson et
|
1 |
It should be recognized that the model is most appropriate only over the ranges of intake from which it was derived, and the model as described does not estimate the range of intakes that would result in the desired level of retention. |
al. model (Y = aeL/(1 + eL)) (1997) were asymptotic, thus never reaching 100 percent, but approaching that goal at higher levels of intake. In a strict statistical sense, 100 percent of an individual's maximal retention due to calcium intake could never be achieved, regardless of intake, if it was an asymptotic relationship. Biologically, this was not a logical conclusion, in that maximal retention, at least to the extent that it can be measured, is a finite number for each individual at a given point in time. The second statistical issue raised was the appropriateness of selecting the level of calcium intake at which the upper limit of the confidence interval for the nonlinear asymptotic regression curve first coincided with 100 percent maximal retention; although this could be defended statistically, it was of concern biologically. For some of the curves to which it was applied, this level of intake was associated with a mean percent maximal retention of 26 percent, which made it difficult to justify as a goal for the average intake of individuals.
Given these concerns, the DRI Committee, supporting the concept that maximizing calcium retention and decreasing calcium loss to the extent possible via calcium intake is of benefit to maintaining bone mineral content and subsequent risk of fracture, had the data recalculated using the Jackman et al. non-linear regression model (1997). In this revised approach, absolute retention (corrected for predicted sweat loss) was employed in place of the percent maximal retention as the value of Y, which was then solved for x, the intake of calcium. Thus, for each age group, a specified desirable level of retention was estimated for the purposes of quantifying an intake associated with the designated calcium retention. Where necessary, the desirable level was based on the same estimates for growth and absorption used in the factorial approach.
To derive the estimates of calcium intake using the Jackman et al. model to achieve this absolute measure of desirable calcium retention (or minimize calcium loss), a value for sweat loss was added to the estimate of retention needed since the balance studies used had not accounted for calcium loss in sweat. The derived estimates of calcium intake which would provide for desirable calcium retention were used as part of the basis for establishing an AI for each age group. Table 4-5 provides the specific values used for desirable calcium retention and sweat loss for each age group for which the model was utilized. The non-linear regression curves derived from this method follow (Figure E-1, Figure E-2 through Figure E-3). The 95 percent confidence intervals shown on the curves represent the goodness-of-fit of the regression lines.
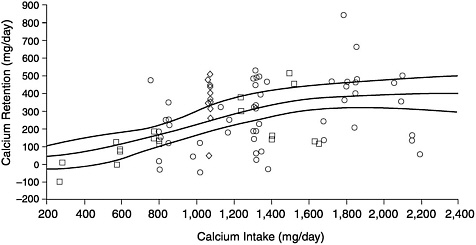
FIGURE E-1 Calcium retention as a function of intake in adolescents. The equation which describes the nonlinear regression model of Jackman et al. (1997) and applied as depicted in this figure to the balance study data of Jackman et al. (1997) as circles, Matkovic et al. (1990) as squares, and Greger et al. (1978) as diamonds is Y= 436.90 eL/(1 + eL), where L = −2.96 + 0.0032 (intake).
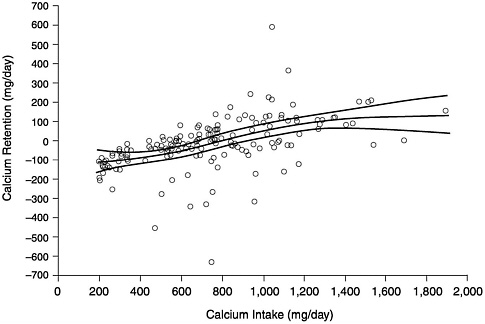
FIGURE E-2 Calcium retention as a function of intake in young adults aged 18 –30 years as compiled by Matkovic and Heaney (1992). The equation which describes the nonlinear regression model of Jackman et al. (1997) and applied as depicted in this figure to the balance study data of Matkovic and Heaney (1992) is Y = −133.79 + 290.16 eL/(1 + eL), where L = −3.15 + 0.0040 (intake).
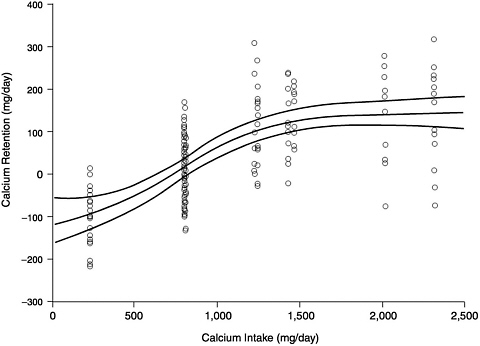
FIGURE E-3 Calcium retention as a function of intake in adult men from Spencer et al. (1984). The equation which describes the nonlinear regression model of Jackman et al. (1997) and applied as depicted in this figure to the balance study data of Spencer et al. (1984) is Y = −130.73 + 274.93 eL/(1 + eL), where L = −2.75 + 0.0036 (intake).


