
3
Microbial Contaminants in Reuse Systems
Traditionally, bacterial and other indicators have been used to evaluate the effectiveness of water and wastewater treatment systems in inactivating microorganisms. Except for special studies, relatively little occurrence information is available for the pathogens that actually pose health risks. Over the past few years, however, renewed attention has been given the health risks from microbial contamination of drinking water, and nationwide monitoring programs are being instituted. In the meantime, much of the information available on specific pathogens comes from microbial monitoring and studies of nonpotable and some potable reuse projects. Knowing the occurrence and concentration of specific pathogens in reclaimed water is critical to determining exposure and thus assessing the potential health risks of potable water reuse.
Waterborne Diseases
Microorganisms associated with waterborne disease are primarily enteric pathogens, which have a fecal-oral route of infection (either human-to-human or animal-to-human) and survive in water. These bacteria, viruses, and protozoa can be transmitted by consumption of fecal-contaminated water, but they can also be spread through person-to-person contact, contaminated surfaces, and food. Any potable water supply receiving human or animal wastes can be contaminated with microbial agents. Even pristine water supplies have been associated with disease
TABLE 3-1 Common Infectious Agents Potentially Present in Untreated Municipal Wastewater
|
Agent |
Disease |
|
Protozoa |
|
|
Entamoeba histolytica |
Amebiasis (amebic dysentery) |
|
Giardia lamblia |
Giardiasis |
|
Balantidium coli |
Balantidiasis (dysentery) |
|
Cryptosporidium |
Cryptosporidiosis, diarrhea, fever |
|
Helminths |
|
|
Ascaris (roundworm) |
Ascariasis |
|
Trichuris (whipworm) |
Trichuriasis |
|
Taenia (tapeworm) |
Taeniasis |
|
Bacteria |
|
|
Shigella (4 spp.) |
Shigellosis (dysentery) |
|
Salmonella typhi |
Typhoid fever |
|
Salmonella (1700 serotypes) |
Salmonellosis |
|
Vibrio cholerae |
Cholera |
|
Escherichia coli (enteropathogenic) |
Gastroenteritis |
|
E. coli 0157:H7 (enterohemorrhagic) |
Bloody diarrhea |
|
Yersinia enterocolitica |
Yersiniosis |
|
Leptospira (spp.) |
Leptospirosis |
|
Legionella pneumophila |
Legionnaire's disease, Pontiac fever |
|
Campylobacter jejuni |
Gastroenteritis |
|
Viruses |
|
|
Enteroviruses (72 types) |
|
|
Poliovirus |
Paralysis, aseptic meningitis |
|
Echovirus |
Fever, rash, respiratory illness, aseptic meningitus, gastroenteritis, heart disease |
|
Coxsackie A |
Herpangina, aseptic meningitus, respiratory illness |
|
Coxsackie B |
Fever; paralysis; respiratory, heart, and kidney disease |
|
Norwalk |
Gastroenteritis |
|
Hepatitis A virus |
Infectious hepatitis |
|
Adenovirus (47 types) |
Respiratory disease, eye infections |
|
Rotavirus (4 types) |
Gastroenteritis |
|
Parvovirus (3 types) |
Gastroenteritis |
|
Reovirus (3 types) |
Not clearly established |
|
Astrovirus (7 types) |
Gastroenteritis |
|
Calicivirus (2-3 types) |
Gastroenteritis |
|
Coronavirus |
Gastroenteritis |
|
SOURCE: Adapted from Hurst et al., 1989; Sagik et al., 1978. |
|
outbreaks, presumably due to Giardia contamination from wildlife in the watershed.
Table 3-1 shows the bacteria, viruses, and protozoan parasites potentially present in untreated municipal wastewater. Wastewater may also contain helminths (intestinal worms), but these waterborne parasites will not be discussed in this report because conventional wastewater treatment removes helminths and their relatively large ova and cysts. Other microorganisms, such as Legionella, are sometimes classified as waterborne disease agents but will not be addressed because their airborne routes of transmission are distinctly different from the transmission routes of enteric microbial agents.
Concerns over particular waterborne microorganisms have changed over the years due to improved sanitary conditions, the use of preventive medicine, and improved microbiological and epidemiological methods for identifying the microorganisms responsible for outbreaks. Microorganisms were first identified as agents of waterborne disease during the cholera outbreak in England in the 1860s. In the 1920s, typhoid fever was linked to the waterborne bacterium Salmonella typhi. Giardia, a water-
FIGURE 3-1 Changing trends in waterborne diseases in the United States in the twentieth century. NOTE: AGI = acute gastrointestinal illness of unknown etiology; HAV = hepatitis A virus.
borne protozoan, rose as a major concern in the 1960s; rotavirus and Norwalk virus were associated with a large number of outbreaks beginning in the 1970s; and Cryptosporidium, also a protozoan, was first associated with waterborne outbreaks in the 1980s (Figure 3-1).
Much of the information on the etiology of waterborne disease comes from investigations of outbreaks by state and local health departments and from voluntary reporting by physicians to the surveillance program maintained by the Centers for Disease Control and Prevention (CDC) and the Environmental Protection Agency (EPA). When an outbreak occurs and waterborne pathogens are suspected, epidemiological studies are conducted to identify whether water is the vehicle of transmission. If possible, the etiologic agent is determined by detection in clinical specimens collected from outbreak victims. For gastrointestinal illness, routine stool examinations by hospital laboratories typically include culturing for Salmonella, Shigella, and Campylobacter bacteria. At the specific request of a physician, many laboratories can also test for rotavirus, Giardia, and Cryptosporidium. Nevertheless, no specific agent is identified in many outbreaks, leaving the cause classified only as acute gastrointestinal illness of unknown etiology (AGI). Before 1982, in fact, most waterborne outbreaks reported were listed as AGI. Poor collection of clinical and/or water samples and limitations of diagnostic techniques for many enteric pathogens can prevent accurate determination of the pathogen. Clinical symptoms suggest that many of the AGI outbreaks may be due to viral agents, such as Norwalk virus and related human caliciviruses.
Diseases From Enteric Bacteria
Enteric bacteria are associated with human and animal feces and may be transmitted to humans through fecal-oral transmission routes. Most illnesses due to enteric bacteria cause acute diarrhea, and certain bacteria tend to produce particularly severe symptoms. As measured by hospitalization rates during waterborne disease outbreaks (that is, the percentage of illnesses requiring hospitalization), the most severe cases are due to Shigella (5.4 percent), Salmonella (4.1 percent), and pathogenic Escherichia coli (14 percent) (Gerba et al., 1994). There is now evidence suggesting that Campylobacter, Shigella, Salmonella, and Yersinia may also be associated with illness that causes arthritis in about 2.3 percent of cases (Smith et al., 1993).
Most E. coli are common, harmless bacteria found in the intestinal tracts of humans and animals, but some forms of E. coli are pathogenic and cause gastroenteritis. A particular strain, E. coli 0157:H7, is enterohemorrhagic (causes bloody diarrhea), and 2 to 7 percent of infections have resulted in hemolytic uremic syndrome (HUS), in which red blood
TABLE 3-2 Waterborne Bacterial Agents of Concern
|
Bacteria |
Average Reported Cases in the United States |
Annual Case-Fatality Rate (%)a |
Percent Waterborneb |
|
Campylobacter |
8,400,000 |
0.1 |
15 |
|
Pathogenic Escherichia coli |
2,000,000 |
0.2 |
75 |
|
Salmonella nontyphoid |
10,000,000 |
0.1 |
3 |
|
Shigella |
666,667 |
0.2 |
10 |
|
Yersinia |
5,025 |
0.05 |
35 |
|
a The number of deaths per case expressed as a percentage and based on total cases and deaths reported annually to the CDC. b Percentage of cases attributed to water contact or water consumption. SOURCE: Reprinted by permission of Elsevier Science from Bennett et al., 1987. © 1987 by American College of Preventive Medicine. |
|||
cells are destroyed and the kidneys fail. HUS has one of the highest mortality rates of all waterborne diseases. The microbial reservoir for E. coli 0157:H7 appears to be healthy cattle, and transmission can occur by ingestion of undercooked beef or raw milk as well as by contaminated water. Two waterborne outbreaks of E. coli 0157:H7 have been reported in the United States (CDC, 1993). Drinking water was associated with an outbreak of E. coli 0157:H7 involving 243 cases, 32 hospitalizations, and 4 deaths in a Missouri community in 1989. Unchlorinated well water and breaks in the water distribution system were considered to be contributing factors. The other waterborne outbreak of E. coli 0157:H7 involved 80 cases in Oregon in 1991 and was attributed to recreational water contact in a lake (Oregon Health Division, 1992). Prolonged survival of E. coli 0157:H7 in water has been reported by Geldreich et al. (1992), who observed only a 2 log (99 percent) reduction after 5 weeks at 5°C.
Classical waterborne bacterial diseases such as dysentery, typhoid, and cholera, while still very important worldwide, have dramatically decreased in the United States since the 1920s (Craun, 1991). However, Campylobacter, nontyphoid Salmonella, and pathogenic Escherichia coli have been estimated to cause 3 million illnesses per year in the United States (Bennett et al., 1987). Hence, enteric bacterial pathogens remain an important cause of waterborne disease in the United States. Table 3-2 shows
the number of enteric bacterial illnesses, the case-fatality rate reported annually from all cases, and the percentage of illnesses attributed to contaminated water supplies, which ranges from 3 to 75 percent. Enteric bacteria caused 14 percent of all waterborne disease outbreaks in the United States from 1970 to 1990 (Craun, 1991).
Diseases From Enteric Protozoa
The enteric protozoan parasites produce cysts or oocysts that aid in their survival in wastewater. Important pathogenic protozoa include Giardia lamblia, Cryptosporidium parvum, and Entamoeba histolytica. (Helminth ova are present in untreated wastewater; however, they are relatively large and tend to drop out of effluent after primary and secondary treatment.) Waterborne outbreaks of amebic dysentery, caused by Entamoeba, have not been reported in the United States in over 15 years (Bennett et al., 1987). Giardia is recognized as the most common protozoan infection in the United States and remains a major public health concern (Craun, 1986; Kappus et al., 1992). The reported incidence of waterborne giardiasis has increased in the United States since 1971 (Craun, 1986). An average of 60,000 cases are reported annually, and 60 percent are estimated to be waterborne (Bennett et al., 1987). Because Giardia is endemic in wild and domestic animals, infection can result from water supplies that have no wastewater contribution. Densities of Giardia cysts in untreated wastewater have been reported as high as 3375 per liter (Sykora et al., 1991).
TABLE 3-3 Illness Rates From Enteric Viruses
|
Virus Group |
Annual Reported Cases in the United Statesa |
Case-Fatality Rate (%) |
Morbidity Rate (%) |
|
Enteroviruses |
6,000,000 |
0.001 |
Not known |
|
Poliovirus |
7 |
0.90 |
0.1-1 |
|
Coxsackievirus A |
Not known |
0.50 |
50 |
|
Coxsackievirus B |
Not known |
Not known |
0.59-0.94 |
|
Echovirus |
Not known |
Not known |
50 |
|
Hepatitis A virus |
48,000 |
0.6 |
75 |
|
Adenovirus |
10,000,000 |
0.01 |
Not known |
|
Rotavirus |
8,000,000 |
0.01 |
56-60 |
|
Norwalk agent |
6,000,000 |
0.0001 |
40-59 |
|
a Cases reported to the CDC in 1985. SOURCE: Bennett et al., 1987; Gerba and Rose, 1993. |
|||
TABLE 3-4 Emerging and Potential Waterborne Enteric Pathogens
|
Microorganism |
Description |
Clinical Syndrome |
|
Calicivirus |
Group of ''small round structured viruses" approx. 27-35 nm diameter, SSa RNA. Includes Norwalk virus, Snow Mountain virus, and Hawaii virus |
Acute gastroenteritis, major cause of outbreaks of nonbacterial, acute gastroenteritis |
|
Astrovirus |
Small, round structured virus approx. 28-30 nm diameter, SS RNA, 7 serotypes |
Acute gastroenteritis, mainly in children and the elderly |
|
Enteric adenovirus |
Approx. 70-80 nm diameter, DS DNAb virus, mainly serotypes 40 and 41 |
Gastroenteritis with duration of 7-14 days; associated with 5-12% of pediatric diarrhea |
|
Enteric coronavirus |
Between 100 and 150 nm diameter, enveloped SS RNA virus; major gastrointestinal pathogens of animals, putative enteric pathogens for humans |
Acute gastroenteritis |
|
Torovirus |
Enveloped. Approx. 100-150 nm diameter, SS RNA viruses; well-established enteric pathogens for animals, putative enteric pathogens for humans |
Acute gastroenteritis |
|
Picornavirus |
Approx. 25-30 nm diameter, double-stranded RNA viruses |
Diarrhea |
|
Pestivirus |
Single-stranded RNA viruses |
Pediatric diarrhea |
|
Helicobacter pylori |
Typically, curved, gram- negative rods 3 x 0.5µm, microaerophilic |
Colonization of stomach causes persistent low-grade gastric inflammation; chronic infections may result in peptic ulcers and gastric cancer |
|
Evidence of Waterborne Transmission |
Reports of Occurrence |
References |
|
Numerous reports of waterborne outbreaks |
Methods to detect in water are currently being developed |
Kapikian et al., 1996 |
|
Waterborne outbreaks have been reported |
No methods to detect in water |
Matsui and Greenberg, 1996 |
|
None, but known to have fecal-oral transmission |
Has been recovered from sewage |
Foy, 1991 |
|
Petric, 1995 |
|
|
|
None, but epidemiologic evidence of fecal-oral transmission |
No methods to detect in water |
McIntosh, 1996 |
|
None |
No methods to detect in water |
Koopmans et al, 1991,1993 |
|
None |
No methods to detect in water |
Pereira et al., 1988 |
|
None |
No methods to detect in water |
Yolken et al., 1989 |
|
Probable fecal-oral transmission; some epidemiologic studies have implicated type of water supply as an important risk factor |
Lab studies demonstrated H. pylori survival for 10 days in freshwater; also evidence of prolonged survival as viable, nonculturable coccoid bodies. Recent report of PCR method to detect H. pylori in waterc |
Enroth and Engstrand, 1995 Shahamat et al., 1989 West et al., 1990 |
Giardia has also been detected in treated effluent and is much more resistant to disinfection with chlorine than bacteria.
Cryptosporidium was first described as a human pathogen in 1976. Cryptosporidiosis causes severe diarrhea; no pharmaceutical cure exists. Average infection rates in the United States, as measured by oocyst excretion in a population, have ranged from 0.6 to 20 percent (Fayer and Ungar, 1986). The disease can be particularly hazardous for people with compromised immune systems (Current and Garcia, 1991). Since 1985, seven reported waterborne outbreaks of cryptosporidiosis have occurred in the United States (Lisle and Rose, 1995). In 1993, Cryptosporidium was responsible for the largest waterborne disease outbreak ever recorded in the United States, causing approximately 400,000 illnesses in Milwaukee, Wisconsin. This outbreak was attributed to contamination of the surface water supply by either animal or human wastes (MacKenzie et al., 1995). All research to date suggests that the current standards for water chlorination are inadequate for inactivation of Cryptosporidium oocysts (Korick et al., 1990; Peeters et al., 1989). Cryptosporidium oocysts have been detected in municipal wastewater, but their concentrations and removal by wastewater treatment processes have not been fully evaluated (Madore et al., 1987; Rose et al., 1996; Villacorta-Martinez et al., 1992).
Diseases From Enteric Viruses
The enteric viruses are obligate human pathogens, which means they replicate only in the human host. Viruses are the smallest pathogenic agents. Their simple structure of a protein coat surrounding a core of
|
Evidence of Waterborne Transmission |
Reports of Occurrence |
References |
|
Epidemiologic case- control study in Nepal implicated consumption of untreated water as a risk factor; 1990 outbreak in Chicago associated with rooftop water storage tanks |
Methods to detect in water are currently under development |
Ortega et al., 1993 Shlim et al., 1991 |
genetic material (DNA or RNA) allows prolonged survival in the environment. There are more than 120 identified human enteric viruses. Some of the better described viruses include the enteroviruses (polio-, echo-, and coxsackieviruses), hepatitis A virus, rotavirus, and Norwalk virus. Most enteric viruses cause gastroenteritis or respiratory infections, but some may produce a range of diseases in humans, including encephalitis, neonatal disease, myocarditis, aseptic meningitis, and jaundice (Gerba et al., 1995, 1996; Wagenkneckt et al., 1991; see Table 3-1). Cases of poliovirus are low in the United States due to almost universal immunization. Table 3-3 shows the average number of viral illnesses that occur annually in the United States for the different enteric viral groups. No general estimates exist regarding the percentage of viral illnesses attributable to contaminated water supplies.
Norwalk and Norwalk-like viruses cause most waterborne viral diseases. Norwalk virus usually causes mild diarrhea that lasts on average for two days. A significant portion of the waterborne outbreaks reported as AGI are probably caused by Norwalk-like viruses that are not identified because of diagnostic limitations; Kaplan et al. (1982) suggested that such viruses may cause 23 percent of all waterborne outbreaks reported as AGI. From 1989 to 1992, contaminated drinking water was implicated in four outbreaks associated specifically with Norwalk-like viruses and hepatitis A virus (Herwaldt et al., 1992; Moore et al., 1993). During the same period, 37 waterborne outbreaks of AGI affected 15,769 people. In 85 percent of the outbreaks, the water quality met national drinking water standards for coliform bacteria.
Emerging and Unknown Waterborne Pathogens
One concern about potable reuse of reclaimed water is the potential health risk from little-known or unknown pathogens. In more than half of all reported outbreaks of waterborne disease, no etiologic agent was ever determined. Some outbreaks that were thoroughly investigated suggest the existence of unrecognized pathogens. For example, "Brainerd diarrhea," first described in an outbreak in Brainerd, Minnesota, in 1983 (Osterholm et al., 1986), is characterized by chronic diarrhea lasting an average of 12 to 18 months. Similar symptoms were noted in several subsequent outbreaks in seven other states where the disease etiology was associated with poor-quality or untreated drinking water (Parsonnet et al., 1989). Intense microbiological analyses failed to identify any etiologic agent for this syndrome.
"Emerging" infectious diseases have been defined as those whose incidence in humans has increased within the past two decades or threatens to increase in the near future (Institute of Medicine, 1992). Some infectious agents, such as Cryptosporidium, were first described in the past 10 to 20 years but have more recently emerged as major causes of waterborne disease. Drinking water from potable reuse systems may pose a risk of exposure to emerging enteric pathogens because raw wastewater contains many enteric pathogens, the removal of which by treatment processes can only be inferred by other measures of microbial quality. The occurrence and health significance of many of these agents in finished drinking water are currently unknown.
Table 3-4 summarizes information on a number of recently recognized enteric pathogens known to have waterborne transmission or to have the potential for waterborne transmission via fecal-contaminated water. The table includes the sizes of these organisms (when known), since this may be relevant to their removal by specific water and wastewater treatment processes. (Several emerging enteric waterborne pathogens that are important outside the United States e.g., hepatitis E virus, group B rotavirus, and Vibrio cholerae O139 are not discussed here because these infections have not been transmitted within the United States.)
Norwalk virus and related human caliciviruses are considered emerging pathogens because new diagnostic techniques have recently identified their roles as major waterborne and foodborne pathogens. A number of other viruses are known or putative enteric pathogens. However, little or no evidence exists regarding waterborne transmission of these organisms. Methods to detect them in water and wastewater have not been developed, and little or no information exists about their survival or transmission in water. For instance, astroviruses are recently recognized
enteric pathogens. Initially there were only a few anecdotal reports of transmission by contaminated water in the literature (Kurtz and Lee, 1987). More recently, large outbreaks and the importance of astroviruses have been recognized, and evidence for waterborne transmission is mounting (Abad et al., 1997). Enteric adenoviruses (serotypes 40 and 41, also known as subgenus F) are DNA viruses that are a common cause of pediatric diarrhea. Although adenoviruses have been recovered from sewage (Foy, 1991), there has been no evidence of drinking water waterborne transmission, though recreational outbreaks have been reported (Crabtree et al., 1997).
Coronaviruses were first observed in feces of persons with gastroenteritis by electron microscopy in 1975, but since then they have also been frequently detected in the feces of healthy people; their etiologic role in human diarrhea remains doubtful. Epidemiologic evidence suggests that fecal-oral transmission and personal hygiene may be key factors in transmission since several studies have noted that the highest prevalence rates were among populations with poor personal hygiene (Caul, 1994).
Toroviruses, which are well-established enteric pathogens of cattle and horses, have been found in stool samples from children and adults with diarrhea (Koopmans et al., 1991, 1993) but have remained unconfirmed as human pathogens. Similarly, picornavirus and pestivirus have been detected in fecal specimens from adults and children with diarrhea, but their clinical significance is not known.
The pathogenic bacterium Helicobacter pylori, formerly referred to as Campylobacter pylori, causes indigestion and abdominal pain, and chronic infection may result in peptic ulcers and gastric cancer. H. pylori infections occur throughout the world, and the prevalence of infection increases with age. Fecal-oral transmission of H. pylori infection has been suggested by several studies that implicated crowding, socioeconomic status, and consumption of raw, sewage-contaminated vegetables as risk factors for infection (Hopkins et al., 1993; Mendall et al., 1992; Mitchell et al., 1992). Studies in Peru have identified type of water supply (municipal vs. community wells) as a risk factor for infection with H. pylori and found that water source appeared to be a more important risk factor than socioeconomic status; children from high-income families who received their water from the Lima municipal water supply, which comes from a surface water source, were 12 times more likely to become ill than high income children who drank well water, with community wells posing a higher risk than treated municipal supplies (Klein et al., 1991). Yet a seroprevalence survey of 245 healthy children in Arkansas found no relation between H. pylori seropositivity and type of water supply (municipal or well) (Fiedorek et al., 1991). However, the levels of fecal contamina-
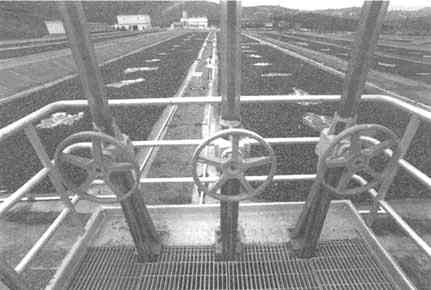
Channels containing water hyacinths, used to provide secondary treatment at San Diego's Aqua II pilot facility. Photo by Joe Klein.
tion in the Peruvian water sources were likely substantially higher than those in Arkansas.
Cyclospora cayetanensis, formerly called "cyanobacterium-like bodies" (CLB) or "big Cryptosporidium," was identified as a new protozoan pathogen of humans in 1993 (Ortega et al., 1993). The organism causes persistent diarrhea. Outbreaks and case reports of Cyclospora diarrhea have been associated with exposure to fecal-contaminated water and fruit that may have been irrigated with fecal-contaminated water (Hale et al., 1994; Shlim et al., 1991). Cyclospora has also been implicated in waterborne transmission, but not as often as Cryptosporidium and Giardia. In June 1994, several cases of diarrhea were detected among British soldiers and dependents stationed in a small military detachment in Pokhara, Nepal (Rabold et al., 1994). The drinking water for the camp was a mixture of river and municipal water that was treated by chlorination. A candle filtration system was also used to remove particles but was not guaranteed to filter Cyclospora-sized particles. Cyclospora was detected in 75 percent of the diarrhea samples examined, and a water sample taken from the camp contained Cyclospora oocysts. Twenty-one cases of prolonged diarrhea in employees and staff physicians were noted on July 9, 1990, in a Chicago hospital (Huang et al., 1995). Upon investigation,
Cyclospora oocysts were identified in the stools. Epidemiological investigations implicated the tap water in the physicians' dormitory and indicated that the storage tank may have been contaminated. Although this outbreak has been identified as a waterborne outbreak, a plausible scenario for the contamination of the water has not been developed.
Another set of emerging protozoan pathogens is microsporidia—a general term that describes a large group of primitive, obligate, intracellular protozoa. Most reported cases of microsporidial infections have occurred among persons infected with human immunodeficiency virus (HIV) (Bryan et al., 1991), and recent epidemiological studies suggest that one species, Enterocytozoon bieneusi, is an important cause of chronic diarrhea in patients with AIDS (Weber et al., 1992). The development of methods to detect H. pylori, Cyclospora cayetanensis oocysts, and microsporidia spores in water and wastewater and to evaluate the risks associated with waterborne exposure to these pathogens was recently identified as a priority research need by the EPA (U.S. EPA, 1996).
A final emerging waterborne pathogen is Isospora belli, a protozoan that has been associated with one documented waterborne disease outbreak in troops in Panama (Goodgame, 1996). The oocyst is large (20 to 30 µm) and, while it is endemic in Africa, Asia, and South America, it is extremely rare in the United States. For example, the organism infected 15 percent of AIDS patients in Haiti but only 0.2 percent of those in the United States.
Aquatic Bacterial Pathogens of Possible Concern for Potable Reuse Systems
Two types of aquatic microorganisms, aeromonads and cyanobacteria, may be of concern for potable reuse systems because their densities in water and/or their production of toxins could be influenced by wastewater nutrients. Indirect reuse systems that contain sufficient nutrients could create blooms of these organisms that may penetrate the treatment barriers and/or proliferate in the distribution system.
Aeromonads are commonly found in water and soil. Densities in water are related to fecal pollution and temperature, and aeromonads proliferate in domestic and industrial wastewater (Schubert, 1991). Some evidence suggests that Aeromonas may produce enterotoxins (Mascher et al., 1988), and several reports have suggested an association between gastroenteritis and Aeromonas in drinking water (Burke et al., 1984; Schubert, 1991). One study in Iowa concluded that three strains of Aeromonas were capable of causing diarrhea and that consumption of untreated water was a risk factor for Aeromonas infection (Moyer, 1987). A study in London found a correlation between Aeromonas isolates from water and iso-
lates from fecal specimens (Nazer et al., 1990). However, two other studies reported little similarity between aeromonads isolated from diarrheal feces and those found in drinking water (Havelaar et al., 1992; Millership et al., 1988). Concern in the Netherlands about the possible health significance of aeromonads has led to the development of drinking water guidelines of less than 20 colony forming units (CFU) per 100 ml for drinking water leaving the treatment plant and less than 200 CFU/100 ml for drinking water in the distribution system (van der Kooij, 1993). Cooper and Danielson (1996) describe several methods of detecting these organisms in water and wastewater.
Cyanobacteria (blue-green algae) occur naturally in fresh and brackish waters worldwide. Although these are not infectious agents, some species produce toxins during algal blooms that are triggered by nutrient enrichment from natural waters, agricultural fertilizer runoff, or domestic or industrial effluents (Codd et al., 1989). Acute effects of exposure to these toxins have been well documented (Codd et al., 1989; Turner et al., 1990). Potential chronic health effects of long-term exposure to cyanobacterial toxins in drinking water are unknown. One study suggested that high rates of liver cancer in parts of China may be linked to cyanobacterial hepatotoxins in drinking water (Carmichael, 1994).
Control of cyanobacteria is problematic. Several studies indicate that the toxins can remain potent for days after the organisms have been destroyed by copper sulfate or chlorination (El Saadi et al., 1995; Hawkins et al., 1985). Using toxicity data from mouse bioassays, the Engineering and Water Supply Department of South Australia developed interim guidelines for acceptable numbers of cyanobacteria in water supplies (El Saadi et al., 1995). However, further research is needed on the acute and chronic toxicity of cyanobacterial toxins, and suitable methods need to be developed for monitoring the types and concentrations of cyanobacterial toxins in natural and treated water supplies (Elder et al., 1993).
Occurrence of Microbial Contaminants in Municipal Wastewater and Ambient Water
Disease epidemics or outbreaks are dramatic events, and our capability to identify the causes of such outbreaks is improving (described in Chapter 4). More difficult is determining whether microbial contaminants might cause occasional illnesses or low levels of disease (Craun et al., 1996; Frost et al., 1996). To assess this danger, researchers must rely on information regarding the pathogens' occurrences and concentrations in drinking water and extrapolate using the best data available on the pathogens' health risks.
The occurrence and concentration of pathogenic microorganisms in raw municipal wastewater depend on a number of factors that are not entirely predictable. Important variables include the source and original use of the water, the general health of the population, the existence of "disease carriers" for particular infectious agents, excretion rates of infectious agents, duration of the infection, and the ability of infectious agents to survive outside their hosts under various environmental conditions.
Untreated Wastewater
Fecal coliform bacteria, which are used as an indicator of microbial pathogens in wastewater, are typically found at 105 to 107 CFU per 100 ml in untreated wastewater (see Table 3-5). Other indicator bacteria, such as Enterococci, can range as high as 5 x 10⁵ CFU per 100 ml (Rose et al., 1996). The bacterial pathogens of concern are usually found at much lower concentrations and, within the United States, typically range from 101 to 102 CFU per 100 ml in untreated wastewater. Levels of viruses in sewage vary greatly and reflect the variations in infection levels in the population, the season of the year (outbreaks of viral disease are often seasonal), and the methods used for their recovery and detection. Enteroviruses tend to be prevalent in the spring, and rotaviruses are more common in the winter (Gerba et al., 1985, 1996). In untreated domestic wastewater in the United States, virus counts typically range between 1000 and 71,000 plaque-forming units (PFU) per 100 liters (Danielson et al., 1996; Rose et
TABLE 3-5 Microorganism Concentrations in Untreated Municipal Wastewater
|
Microorganisms |
Concentration (number per 100 ml) |
|
Fecal coliforms |
105-107 |
|
Fecal streptococci |
104-106 |
|
Shigella |
1-103 |
|
Salmonella |
102-104 |
|
Pseudomonas aeruginosa |
103-104 |
|
Clostridium perfringens |
103-105 |
|
Helminth ova |
1-103 |
|
Giardia lamblia cysts |
10-104 |
|
Cryptosporidium oocysts |
102-105 |
|
Entamoeba histolytica cysts |
102-105 |
|
Enteric viruses |
103-104 |
|
SOURCE: Adapted from National Research Council, 1996. |
|
TABLE 3-6 Reported Levels of Pathogenic and Indicator Microorganisms in Untreated Wastewater
|
|
Average Levels Reported (CFU, PFU, or cysts/ oocysts per 100 liters) |
||
|
Reference |
Clostridium |
Total Coliforms |
Fecal Coliforms |
|
Occoquan, Virginia (Rose et al., 1997) |
36,667 |
2.4 x 10⁷ |
9 x 10⁵ |
|
St. Petersburg, Florida (Rose et al., 1996) |
NT |
8.2 x 10⁷ |
2.2 x 10⁷ |
|
South Africa (Grabow et al., 1978) |
NT |
2.46 x 10⁵ |
NT |
|
Tampa, Florida (City of Tampa, 1990) |
NT |
NT |
NT |
|
California (Yanko, 1993)a |
NT |
NT |
NT |
|
San Diego (Danielson et al., 1996) |
NT |
NT |
NT |
|
Denver (Lauer, 1991) |
NT |
8 x 10⁵ |
4 x 10⁴ |
|
NOTES: Only one study reported on levels of a bacterial pathogen: 2.2 CFU-MPN/ 100 ml of Salmonella (or 2200/100 liters) (Danielson et al., 1996). MPN = most probable number; NT = not tested. |
|||
al., 1996, 1997; Yanko, 1993). In South Africa they have been recorded as high as 4.0 x 10⁵ viral units per 100 liters (Grabow et al., 1978).
Very few studies have examined the occurrence of enteric protozoa in wastewater. Cryptosporidium levels in untreated wastewater vary throughout the year from 100 to 1500 oocysts per 100 liters and are usually lower than enterovirus levels. Giardia is present in sewage at levels comparable to enteroviruses, averaging between 3,900 and 49,000 cysts/ 100 liters (Danielson, 1996; Rose et al., 1996, 1997). Table 3-6 summarizes the information available from microbiological studies of untreated wastewater. The more recent studies also monitored alternative microbiological indicator species—coliphage and Clostridium. The use of these indicators for evaluating potable reuse systems is reviewed in Chapter 4.
Primary and Secondary Effluent
Primary treatment does little to remove biological contaminants from
|
Enterococci |
Coliphage |
Enterovirus |
Cryptosporidium Oocysts |
Giardia Cysts |
|
5 x 10⁵ |
3.8 x 10⁵ |
1,085 |
1,484 |
4.9 x 10⁴ |
|
NT |
2.8 x 10⁶ |
1,000 |
1,500 |
6.9 x 10³ |
|
6,400 |
3.8 x 10⁴ |
71,000 |
NT |
NT |
|
NT |
NT |
7,000 |
30 |
3,900 |
|
NT |
NT |
5 x 10³ 4 x 10⁴ |
NT |
NT |
|
NT |
NT |
2 x 10³ |
2 x 10² |
3.25 x 10⁴ |
|
Fecal streptococcib 7,000 |
5 x 10⁴ |
NT |
100 |
200 |
|
a Data reported from three reclamation plants. b All fecal streptococci measured. |
||||
wastewater. However, some protozoa and parasite ova and cysts will settle out during primary treatment, and some particulate-associated microorganisms may be removed with settleable matter.
Secondary treatment, however, is designed to remove soluble and colloidal biodegradable organic matter and suspended solids. In some cases it also removes nitrogen and phosphorus. Secondary treatment consists of an aerobic biological process whereby microorganisms oxidize organic matter in the wastewater. The aerobic biological processes include activated sludge, trickling filters, rotating biological contactors, and stabilization ponds. Generally, primary treatment precedes these biological processes; however, some secondary processes, such as stabilization ponds and aerated lagoons, are designed to operate without sedimentation. Table 3-7 lists typical microorganism removal efficiencies for activated sludge and trickling-filter secondary treatment processes.
Conventional secondary treatment reduces pathogens but does not eliminate them from the effluent, even with disinfection. A Florida sur-
TABLE 3-7 Typical Percentage Removal of Microorganisms by Conventional Treatment Processes
|
|
|
Secondary Treatment |
|
|
Microorganism |
Primary Treatment |
Activated Sludge |
Trickling Filter |
|
Fecal coliforms |
<10 |
0-99 |
85-99 |
|
Salmonella |
0-15 |
70-99 |
85-99+ |
|
Mycobacterium tuberculosis |
40-60 |
5-90 |
65-99 |
|
Shigella |
15 |
80-90 |
85-99 |
|
Entamoeba histolytica |
0-50 |
Limited |
Limited |
|
Helminth ova |
50-98 |
Limited |
60-75 |
|
Enteric viruses |
Limited |
75-99 |
0-85 |
|
SOURCE: Reprinted, with permission, from Crook, 1992. © 1992 by Academic Press, Inc. |
|||
vey of wastewater treatment plants using activated-sludge secondary treatment after disinfection found viruses averaging 10 to 130 PFU/100 liters in 40 to 100 percent of the samples (Rose and Gerba, 1990). In a similar survey in California, 67 percent of the samples taken from secondary wastewater treatment facilities following disinfection contained viruses at levels ranging from 2 to 200 PFU/100 liters (Asano et al., 1992). Other studies of secondary effluent report similar findings, ranging from 3.5 to 650 PFU/100 liters (Rose et al., 1996, 1997; Yanko, 1993). However, Irving (1982) reported levels of enteroviruses as high as 715,000 viral PFU/100 liters. Likewise, protozoa can survive secondary treatment and disinfection. Cryptosporidium oocysts have been reported in secondary effluent at a level of 140 oocysts/100 liters (Rose et al., 1996), while Giardia cysts were found to range from 440 to 2297 cysts/100 liters (Rose et al., 1996, 1997). Table 3-8 summarizes the reported levels of pathogenic and indicator microorganisms in secondary effluent. These data suggest that wastewater discharges are contributing enteric pathogens to ambient waters, many of which may be used downstream for drinking purposes. All planned potable reuse projects and demonstration studies in the United States have used treatment in addition to secondary treatment, and such additional treatment is essential for protecting against risks of microbiological contamination.
Ambient Waters
In indirect reuse (either planned or unplanned), reclaimed water is discharged to a natural system (surface water or ground water), where it typically spends a period of time before being further treated for use as
drinking water. During this time, natural processes tend to reduce the concentrations of enteric microorganisms beyond what occurs due to dilution alone. This ''natural inactivation" or die-off rate is usually reported in terms of the time required for a 90 percent reduction in the viability of the microbial population. Many factors influence the inactivation rate, including the amount of solids, oxygen, salinity, and ultraviolet light the water is exposed to. However, temperature appears to play the most significant role. Enteric pathogens generally survive longer at lower temperatures. Table 3-9 summarizes the survival rates of some pathogens at selected temperatures.
The survival of the pathogenic bacteria corresponds closely to survival of the coliform indicator bacteria (Feachem et al., 1983; Korhonen and Martikainen, 1991; Olson, 1993; Singh and McFeters, 1990; Terzieve and McFeters, 1991). As shown in Table 3-9, the time required to achieve 90 percent reductions of Salmonella may range from 1 to 8 days at 10 to 20°C. At lower temperatures, between 5 and 10°C, a 99.9 percent reduction in the bacterial levels might require up to 24 days.
Virus survival is also related to water temperature. At ambient temperatures between 15 and 25°C, an inactivation rate of 99.9 percent can occur within 6 to 10 days. However, at 4°C, only 90 percent inactivation may occur after 30 days (Kutz and Gerba, 1988). The presence of undissolved solids may also aid virus survival. Kutz and Gerba (1988) showed that viruses survived longer in both sewage-polluted waters and ambient surface waters at any given temperature compared to tap water.
Very few data exist on survival of protozoan pathogens in ambient waters. DeRegnier et al. (1989) found that mice could no longer be infected with Giardia cysts collected after 56 days in river and lake water at 5°C. Using a more sensitive test (vital dyes) that can determine the potential viability of a single cyst, Robert et al. (1992) demonstrated that in river water between temperatures of 5 and 10°C, only 55 percent of the Cryptosporidium oocysts were dead after 47 days, 75 percent were dead after 60 days, and a 99 percent reduction in viability required 176 days. One can estimate a -0.01 to 0.05 log10 per day inactivation rate at low temperatures from their data.
Microbial Data from Water Reuse Applications
The public health hazards posed by microbial pathogens have been recognized since the practice of water reclamation and reuse began. Besides bacterial pathogens, viruses were a major concern, and almost all of the reuse projects and studies undertaken, whether pilot scale or full
TABLE 3-8 Reported Levels of Pathogenic and Indicator Microorganisms in Secondary Effluent From Wastewater Treatment Plants
|
|
Average Levels Reported (CFU, PFU, or cysts/oocysts per 100 liters) |
|||||||
|
Reference |
Clostridium |
Total Coliforms |
Fecal coliforms |
Enterococci |
Coliphage |
Enterovirus |
Cryptosporidium oocysts |
Giardia cysts |
|
Occoquan, Virginia (Rose et al. 1997) |
4,452 |
170,000 |
7,764 |
2,186 |
1,821 |
75.8 |
Not detected |
2,297 |
|
St. Petersburg, Florida (Rose et al., 1996) |
Not tested |
1.5 x 10⁶ |
190,000 |
Not tested |
5 x 10⁵ |
20 |
140 |
440 |
|
Tampa, Floridaa (City of Tampa, 1990) |
Not tested |
Not tested |
Not tested |
Not tested |
Not tested |
3.5 |
Not tested |
5 |
|
California (Yanko, 1993)b |
Not tested |
Not tested |
Not tested |
Not tested |
Not tested |
650 55 56 |
Not tested |
Not tested |
|
a Denitrified secondary effluent. b Data reported from three reclamation plants. |
||||||||
TABLE 3-9 Survival of Enteric Pathogens and Indicator Bacteria in Fresh Waters
|
Microorganism |
Time Reported (days) for 90 Percent Reduction in Viable Concentrations |
|
Coliforms |
0.83 to 4.8 days at 10 to 20°C, average 2.5 days |
|
E. coli |
3.7 days at 15°C |
|
Salmonella |
0.83 to 8.3 days at 10 to 20°C |
|
Yersinia |
7 days at 5-8.5°C |
|
Giardia |
14 to 143 days at 2 to 5°C |
|
3.4 to 7.7 days at 12 to 20°C |
|
|
Enteric viruses |
1.7 to 5.8 days at 4 to 30°C |
|
SOURCES: Feachem et al., 1983; Korhonen and Martikainen, 1991; Kutz and Gerba, 1988; McFeters and Terzieva, 1991. |
|
scale, began monitoring for enteric viruses in addition to the routine indicator bacteria.
Aside from water reuse projects, relatively few data exist regarding the levels of specific pathogenic microorganisms in wastewater or drinking water treatment processes, because monitoring is not routine or required in the United States. Neither federal nor state water quality standards specify concentrations of viruses or protozoa in drinking water, ambient waters, wastewaters, or reclaimed waters. Instead, microbial water quality standards have largely relied on bacterial indicators or treatment performance. Total coliform is used as a national standard for drinking water (the standard is less than 1/100 ml), while total or fecal coliforms are used in some states for reclaimed water. Indicators of treatment performance and water quality have been based on measurements of turbidity and suspended solids. More recently, enterococci, coliphage (a bacterial virus), and the Clostridium bacterium have been examined as biological indicators of treatment performance. (Chapter 4 further discusses microbial indicators.)
The increase in identified waterborne giardiasis and cryptosporidiosis outbreaks has made the drinking water industry more sensitive to protozoan contamination of water supplies. Through the Surface Water Treatment Rule (U.S. EPA, 1989), EPA developed performance standards for drinking water that require a 99.9 percent reduction of Giardia cysts and a 99.99 percent reduction of viruses by filtration and/or disinfection. EPA's goal is to achieve an annual risk no greater than a 1 in 10,000 chance of infection by a waterborne microbe from drinking water (Regli et al., 1991). While the rule does not specifically address wastewater contamination, it
TABLE 3-10 Concentrations of Parasites and Viruses in Disinfected Secondary Effluents Used for Crop Irrigation in Arizona
states that greater reductions may be required if a source water is of poor quality. Due to the lack of monitoring information, EPA has recently promulgated the Information Collection Rule, or ICR, to develop an occurrence database for Cryptosporidium, Giardia, and viruses in source waters, in some treated waters, and in various treatment processes. In light of a national move toward watershed-based requirements, the ICR will likely influence future microbial standards and monitoring requirements pertaining to both planned potable reuse projects and potable water supplies influenced by upstream wastewater discharges.
Microbial Data From Nonpotable Reuse Applications
Arizona is currently the only state with standards and required monitoring for concentrations of viruses and Giardia in reclaimed water. Arizona's current standard is less than or equal to 1 cyst or viral PFU per 40 liters (2.5 cysts or PFU/100 liters). The following sections summarize the monitoring data available from Arizona, as well as the results of specific microbial studies from California and Florida based largely on tertiary-treated wastewater (secondary treatment, filtration, and chlorination) used for nonpotable reuse applications.
|
Plant 3: Lagoon (5 days retention time, mechanical aeration, UV light disinfection) |
Plant 4: Biotowers (compressed air, chlorination) |
Plant 5: Activated Sludge (oxygen, chlorination) |
Plant 6: Lagoon (mechanical aeration, chlorination) |
|
18.3 (6/11) |
26 (35/38) |
43.5 (36/42) |
(0/7) |
|
11.4 (2/2) |
3.4 (16/30) |
3.7 (15/34) |
1.5 (2/5) |
|
7.75 (11/45) |
0.725 (6/16) |
0.75 (3/47) |
No data |
|
SOURCE: C. P. Gerba, personal communication, 1996. |
|||
Microbial Monitoring in Arizona
Data on concentrations of Giardia, Cryptosporidium, and enteroviruses are available from wastewater and reclamation facilities in Arizona where the effluent is used for irrigation. Arizona currently has no requirements for monitoring of Cryptosporidium in reclaimed waters; however, this protozoan was included in most monitoring programs. Monitoring frequency is established on a case-by-case basis and is determined partly by the flow, treatment design, and designated reuse application. Frequency ranges from once per month to twice per year. Table 3-10 summarizes the monitoring results for six reclamation facilities that use a variety of secondary treatment options followed by disinfection with chlorination or ultraviolet light. The effluents were used primarily for irrigating cotton crops.
Collectively, Giardia was found in 78.5 percent of the effluent samples from all plants at an average concentration of 31.3 cysts/100 liters. Cryptosporidium was found in 59 percent of the samples from all plants at an average concentration of 5 oocysts/100 liters. Viruses were found in 18 percent of the samples from all plants at an average concentration of 2.2 most probable number (MPN) PFU per 100 liters. No differences in protozoa levels were readily detected in the two plants using lagoon effluents.
Table 3-11 illustrates the efficacy of combining sand filtration and
TABLE 3-11 Concentrations of Parasites and Viruses in Filtered, Disinfected Secondary Effluents in Arizona
|
Microbial Agent |
Plant 7: Lagoon (aeration, filtration, chlorination) |
Plant 8: Activated Sludge (aeration, filtration, chlorination) |
Plant 9a: Filtration (deep bed dual media sand and coal pressure filters, chlorination) |
|
Giardia cysts/100 liters (positive samples) |
11.25 (10/16) |
7.4 (4/9) |
6.98 (25/50) |
|
Cryptosporidium oocysts/100 liters (positive samples) |
No data |
1.88 (1/2) |
3.02 (17/50) |
|
Enteroviruses PFU/100 liters (positive samples) |
No data |
No data |
0.15 (2/45) |
|
NOTE: Numbers in parentheses are number of positive samples per total samples taken. Arizona's standard for public access irrigation was less than 2.5 PFU or cysts per 100 liters. a Plant 9 operated with secondary treated sewage from Plant 4 in Table 3-10. SOURCE: C. P. Gerba, personal communication, 1996. |
|||
disinfection after secondary treatment. The effluents from these three plants are used to irrigate golf courses. Giardia was found in 55 percent of all the samples from the three plants at an average concentration of 10 cysts/100 liters. This represents a reduction of 70 percent compared to the nonfiltered effluents in Table 3-10. Cryptosporidium oocysts were detected in 56.2 percent of all samples at an average concentration of 2.5 oocysts/100 liters, representing a reduction of 51 percent compared to nonfiltered effluent.
The filter plants varied in design; however, none of the plants used coagulants during the filtration process, which would have further improved protozoa removal. Viruses were detected in only 4.4 percent of the samples in Plant 9 (the only plant that sampled for viruses) at a level of 0.15 MPN-PFU/100 liters. This represents a reduction of 93.5 percent compared to nonfiltered effluents. Dual-media filtration is particularly effective in removing suspended solids and turbidity, which enhances the efficacy of chlorination.
TABLE 3-12 Occurrence of Microorganisms Throughout Treatment Train at St. Petersburg, Florida, Reclamation Facility
|
Parameter |
Untreated Wastewater |
Post- clarification |
Post-filtration |
Post-chlorination |
Storage Tank |
|
Total Coliforms |
|
|
|
|
|
|
Percent positive |
100 |
100 |
100 |
18 |
18 |
|
Concentration (CFU/100 ml) |
8.2 ± 2.3 x 10⁷ |
1.5 ± 1.6 x 10⁶ |
4.6 ± 4.8 x 10⁵ |
2.7 ± 4.8 x 101 |
6.6 ± 1.1 |
|
Fecal Coliforms |
|
|
|
|
|
|
Percent positive |
100 |
100 |
100 |
9 |
|
|
Concentration (CFU/100 ml) |
2.2 ± 0.6 x 10⁷ |
1.9 ± 0.2 x 10⁵ |
1.7 ± 1.5 x 10⁵ |
1.9 ± 2.3 |
0.82 ± 1.2 |
|
Phage |
|
|
|
|
|
|
Percent positive |
100 |
90 |
92 |
50 |
25 |
|
Concentration (PFU/100 ml) |
2.8 ± 9.8 x 10⁶ |
5.0 ± 9.0 x 10⁵ |
7.6 ± 7.6 x 101 |
7.2 ± 6.0 |
0.70 ± 1.1 |
|
Enteroviruses |
|
|
|
|
|
|
Percent positive |
100 |
58 |
50 |
25 |
8 |
|
Concentration (PFU/100 liters) |
1.0 ± 1.4 x 10³ |
2.0 ± 2.1 x 101 |
3.1 ± 3.2 |
0.33 ± 0.13 |
0.01 ± 0.01 |
|
Giardia |
|
|
|
|
|
|
Percent positive |
100 |
83 |
75 |
42 |
25 |
|
Concentration (cysts/100 liters) |
6.9 ± 3.7 x 10³ |
4.4 ± 4.7 x 10² |
4.4 ± 3.7 |
0.97 ± 1.5 |
0.49 ± 1.5 |
|
Cryptosporidium |
|
|
|
|
|
|
Percent positive |
67 |
42 |
42 |
25 |
17 |
|
Concentration (oocysts/100 liters) |
1.5 ± 1.8 x 10³ |
1.4 ± 1.7 x 10² |
4.0 ± 2.2 |
1.8 ± 1.5 |
0.75 ± 1.1 |
|
SOURCE: Reprinted, with permission, from Rose et al, 1996. © 1996 by Elsevier Science. |
|||||
TABLE 3-13 Reduction of Microorganisms by Process for the St. Petersburg, Florida, Reclamation Facility
|
|
Unit Process Reduction (log10) |
|||||
|
Parameter |
Biological Treatment and Clarification |
Filtration |
Chlorination |
Storage |
Complete Treatment |
|
|
Total coliforms |
1.75 |
0.51 |
4.23 |
0.61 |
7.10 |
|
|
Fecal coliforms |
2.06 |
0.05 |
4.95 |
0.36 |
7.42 |
|
|
Phage |
0.75 |
3.81 |
1.03 |
1.03 |
6.62 |
|
|
Enterovirus |
1.71 |
0.81 |
1.45 |
1.04 |
5.01 |
|
|
Giardia |
1.19 |
2.00 |
0.65 |
0.30 |
4.14 |
|
|
Cryptosporidium |
1.14 |
1.68 |
0.41 |
0.04 |
3.27 |
|
|
SOURCE: Reprinted, with permission, from Rose et al., 1996. © 1996 by Elsevier Science. |
||||||
Virus Studies in California
In the 1970s, California adopted stringent treatment requirements for reclaimed waters destined for public access applications. The treatment was designed to reduce viruses by 5 log10 (99.999 percent) and included coagulation, flocculation, sedimentation, sand filtration, and disinfection with a 5 mg/liter total chlorine residual for 1.5 hours. Asano et al. (1992) summarized the virus monitoring data for Orange County Sanitation District, the Monterey Regional Water Pollution Control Agency, the County Sanitation Districts of Los Angeles, and the Las Virgines Municipal Water District-a 3- to 10-year data set. In the unchlorinated secondary effluents, 66.7 percent of 424 samples collected were positive for viruses. Geometric averages ranged from 2 to 200 MPN-PFU/100 liters. In the finished product water, Asano et al. (1992) found less than 1 percent of 814 samples positive for viruses. These few positives were attributed to operational difficulties during chlorination. Yanko (1993) found similar results in summarizing 10 years of analysis of six reclamation facilities in Los Angeles County. He reported that only 0.17 percent (1/590) of the samples from reclamation facilities were positive for viruses.
Microbial Studies in Florida
Florida requires less stringent treatment than California for reclaimed water that may be used in areas accessible to the public. Performance criteria specify secondary treatment plus sand filtration to meet a suspended solids standard and a minimum chlorination level of 1 mg/liter
for 15 minutes of peak flow to meet a fecal coliform standard of less than 1 / 100 ml. St. Petersburg has been operating a full-scale wastewater treatment and reclamation facility for more than 20 years. This plant produces 16 million gallons of reclaimed water per day. Advanced treatment includes dual-media rapid sand filtration with in-line addition of alum and polymer coagulants. The final effluent is chlorinated and stored in an 8 million gallon tank for an average of 16 to 24 hours prior to release into a distribution system used for golf course and residential landscape irrigation. Rose et al. (1996) evaluated the St. Petersburg treatment processes and documented partial removal of bacteriophages and enteroviruses at each stage of treatment (see Tables 3-12 and 3-13). Bacteriophages were reduced by the total treatment process by 6 log10, and enteroviruses were reduced by 5 log10. An average of 0.7 PFU/100 liters of bacteriophages was found in 25 percent of the samples from the storage tank containing the final reclaimed water. This facility maintains a much more stringent disinfection standard (4 mg/liter chlorine and 45 minutes contact time) than Florida requires, and the virus reductions are similar to those seen in California facilities.
St. Petersburg's advanced treatment process reduced the numbers of Giardia cysts and Cryptosporidium oocysts by 4.14 and 3.27 log10, respectively, and removal was observed at each stage of treatment (Rose et al., 1996). In the final effluent from the storage tank, 25 percent of the samples were still positive for Giardia cysts and 17 percent were positive for Cryptosporidium oocysts. Methodological limitations prevented a determination of the viability of the cysts and oocysts detected.
In a study of drinking water treatment, researchers reported a 99 percent inactivation rate for Giardia cysts after 50 to 180 minutes of contact time with 5 to 16 mg/liter of monochloramine (Hoff, 1986). Studies of Cryptosporidium in drinking water suggest that levels of 15 mg/liter of chloramines for 240 minutes are needed to reduce viable oocysts by 99 percent (Finch, 1994). In the St. Petersburg reclamation facility, the storage tank contains an average of 2.5 mg/liter of total chlorine and involves approximately 16 to 24 hours more contact time. No studies have examined the inactivation of protozoan cysts and oocysts in wastewater or reclaimed water, leaving the mechanisms for inactivation and the efficacy of chlorine disinfection against Giardia cysts or Cryptosporidium oocysts poorly understood.
Advanced Treatment for Potable Reuse
Table 3-14 summarizes microbial monitoring data available from seven potable reuse facilities using advanced treatment. Orange County Water District conducted two significant microbial studies at the Water
TABLE 3-14 Monitoring Data at Potable Reuse Projects for Microbial Pathogens of Concern
|
Facility (barriers to pathogens)a |
Testing Performed |
Cultivable Enteric Viruses |
|
Denver (lime, sand filtration, carbon, RO, or UF) |
Concentration |
<1/1000 liters |
|
|
Positive samples |
0/37 |
|
|
Percent reduction |
n.a. |
|
Water Factory 21 1979 study (lime, ammonia stripping, carbon, RO, chlorination) |
After Lime |
|
|
|
Positive samples |
28/28 |
|
|
Percent reduction |
99.87% |
|
|
After Chlorination |
|
|
|
Positive samples |
1/142 |
|
Water Factory 21 1980-1981 study (lime, ammonia stripping, carbon, RO, chlorination) |
Concentration |
<0.1/100 liters |
|
|
Positive samples |
0/21 |
|
|
Percent reduction |
>99% |
|
|
Prechlorination |
|
|
|
Concentration |
0.2/100 liters |
|
|
Positive samples |
1/19 |
|
|
Percent reduction |
99.4% |
|
Potomac study (lime, intermediate chlorination, dual-media filtration, carbon, chlorination or ozonation) |
Concentration |
<1/1700 liters |
|
|
Positive samples |
0/56 |
|
|
Percent reduction |
>87% |
|
Tampa (lime; sand filtration; RO, UF, or carbon; ozonation or chlorination) |
After Lime |
|
|
|
Concentration |
0.06/100 liters |
|
|
Positive samples |
4/25 |
|
|
Percent reduction |
98.3% |
|
|
After Chlorination |
|
|
|
Concentration |
0.02/100 liters |
|
|
Positive samples |
1/15 |
|
|
Percent reduction |
99.4% |
|
|
After Ozone |
|
|
|
Concentration |
<0.01/100 liters |
|
|
Positive samples |
0/4 |
|
|
Percent reduction |
>99% |
|
Cryptosporidium |
Giardia |
Other Microbial Pathogens Examined |
|
<1/100 liters 0/4 >97.5% |
<1/100 liters 0/15 >99.4% |
Shigella, Salmonella, Campylobacter, Entamoba tested, none detected |
|
Not tested |
Not tested |
Not tested |
|
Not tested |
Not reported 0/20 0% (+); after chlorination and RO |
Helminths: none found |
|
|
<0.05/100 liters — >86.9% removals |
|
|
Not tested |
None detected using light microscopy |
Not tested |
|
0.13 /100 liters 1/16 99.6% |
<1/200 liters in final effluent >99.97% |
|
|
<1/200 litersb 0/6 >99.8% |
|
|
|
Facility (barriers to pathogens)a |
Testing Performed |
Cultivable Enteric Viruses |
|
San Diego (Aqua III, water hyacinth, ponds, dual-media filtration, UV, RO, carbon) |
Concentration Positive samples Percent reduction |
<1/1000 liters 0/32 >99.995% |
|
Windhoek, South Africa (ponding, lime, sand filtration, chlorination, carbon) |
Concentration Positive samples Percent reduction |
1/10 liters 0/31 n.a. |
|
Upper Occoquan Sewage Authority (lime, filtration, carbon, chlorination) |
Concentration Positive samples Percent reduction |
<1/500 liters 0/11 >99.995%c |
|
a All testing is on final effluent unless otherwise noted. Carbon = carbon adsorption; lime = chemical lime treatment, pH 11.2, recarbonation; RO = reverse osmosis; UF = ultrafiltration; UV= ultraviolet disinfection. b After filtration. c Based on raw sewage counts; all other removals based on counts entering reclamation facility. |
||
Factory 21 reclamation plant, in 1979 and 1981. In the 1979 study(James M. Montgomery, Inc., 1979), one of the 142 final, disinfected effluent samples was positive for viruses, and the study recommended that the disinfection procedure be optimized to increase the contact time and to increase chlorine residual to 5 mg/liter. In the second study (James M. Montgomery, Inc., 1981), no samples were positive for viruses in the final effluent, an improvement due to improved disinfection and the reduction of influent virus levels by upgrading the secondary treatment from a trickling filter effluent to an activated sludge system. This study also demonstrated that reverse osmosis was not a good substitute for disinfection. Without disinfection, 5.3 percent of the samples from reverse osmosis effluent still contained viruses. Studies conducted by San Diego during the Aqua II project also noted relatively high virus breakthrough in reverse osmosis systems (Western Consortium for Public Health, 1992). During the Tampa project, viruses were detected in 6.7 percent of the samples after chlorination, but this occurred during an operational period when pH levels were suboptimal during lime treatment and there was a loss in normal chlorine residuals (Western Consortium for Public Health, 1992).
|
Cryptosporidium |
Giardia |
Other Microbial Pathogens Examined |
|
1/1000 liters 2/29d 99.995% |
<1/1000 liters 0/29 >99.9997% |
1/500 ml (Salmonella) 0/29 >99% |
|
Not tested |
Not tested |
Not tested |
|
0.44 /100 liters 1/11 99.97% |
6.6 /100 liters 2/11 99.986% |
|
|
d Positives seen during spiking trials. SOURCES: CH2M Hill, 1993; Grabow, 1990; James M. Montgomery, 1979, 1981, 1983; Lauer et al., 1990; Western Consortium for Public Health, 1992. |
||
At two reclamation facilities in San Diego and Denver, seeding studies were conducted in which viruses were artificially inoculated in the secondary influent feedwater to advanced wastewater treatment. The results suggest that as much as a 10 log10 reduction of viruses can be achieved by multiple barriers within a reclamation facility (Lauer et al., 1991; Western Consortium for Public Health, 1992). Therefore, the main issues for virus control are the known levels entering the plant, the numbers of barriers required, and the reliability of those barriers.
The San Diego Aqua II project evaluated protozoa and detected no Giardia cysts in 29 samples from the final effluent; however, Cryptosporidium oocysts were detected after a spiking trial (Western Consortium for Public Health, 1992). This suggests that if high concentrations of oocysts were to enter the facility, a few might penetrate the barriers. The San Diego study also demonstrated that protozoa can be detected at a limit of 1 cyst/oocyst in 1000-liter samples of highly treated reclaimed water. The Tampa study (CH2M Hill, 1993) examined individual unit processes and demonstrated that chemical lime treatment removed 99 percent of the cysts and oocysts. However, Rose et al. (1997) found no decrease in viability of the oocysts after exposure to high pH or to a
TABLE 3-15 Reductions of Pathogenic and Indicator Microorganisms in the UOSA Reclamation Facility Compared to Influent Concentrations
|
|
Percentage and Log10 Wastewater |
Reductions of Microorganisms |
Compared to Untreated |
|
After Treatment in Reclamation Facility |
Clostridium |
Total Coliform |
Fecal Coliform |
|
Secondary treatment |
-0.92 |
-2.15 |
-2.06 |
|
|
87.8 |
99.29 |
99.14 |
|
Chemical lime treatment |
-3.86 |
-5.3 |
-4.59 |
|
|
99.986 |
99.9995 |
99.997 |
|
Poststabilization basina |
-3.35 |
-4.12 |
-3.2 |
|
|
99.955 |
99.992 |
99.94 |
|
Multimedia filtration |
-4.31 |
-5.13 |
-4.39 |
|
99.995 |
99.9992 |
99.996 |
|
|
GAC upflow adsorption |
-4.22 |
-5.16 |
-4.63 |
|
99.994 |
99.9993 |
99.998 |
|
|
Chlorination |
-4.02 |
-7.18 |
>-5.95 |
|
99.9905 |
99.999993 |
>99.9999 |
|
|
NOTE: GAC = granular activated carbon. a Influent to multimedia filtration through an open basin. |
|||
combination of high pH and disinfection in studies at the Upper Occoquan Sewage Authority (UOSA). Therefore the removal mechanism for protozoa after chemical lime treatment appears to be physical removal of the oocysts. Rose et al. (1997) also found that multimedia filtration further reduced enteric protozoa by 85 to 95.7 percent. However, protozoan cysts and oocysts were still detected in the final effluent of the UOSA facility, which incorporates lime, multimedia filtration, carbon absorption, and chlorination.
Approximately 4 to 6 log10 removals of Giardia and Cryptosporidium cysts and oocysts have been documented in both San Diego and UOSA by a combination of processes. Table 3-15 shows the percentage and log
|
Enterococci |
Coliphage |
Enterovirus |
Cryptosporidium |
Giardia |
|
-2.36 |
-2.62 |
-1.16 |
|
-1.3 |
|
99.56 |
99.76 |
93 |
|
95.3 |
|
-4.33 |
-4.88 |
-3.69 |
-2.63 |
-2.46 |
|
99.995 |
99.998 |
99.98 |
99.8 |
99.65 |
|
-3.67 |
-4.82 |
-3.56 |
-1.67 |
-2.34 |
|
99.98 |
99.998 |
99.97 |
97.9 |
99.55 |
|
-3.61 |
-4.57 |
-3.48 |
-3.22 |
-2.90 |
|
99.97 |
99.997 |
99.97 |
99.94 |
99.87 |
|
-4.67 |
-4.62 |
-3.52 |
-2.74 |
|
|
99.998 |
99.998 |
99.97 |
99.82 |
|
|
-5.27 |
-5.86 |
>-4.34 |
-3.53 |
-3.87 |
|
99.9995 |
99.99986 |
>99.995 |
99.97 |
99.986 |
reduction of pathogens and microbial indicators by unit process in the UOSA facility (Rose et al., 1997). The bacterial indicator Clostridium best reflects the removal of enteroviruses for secondary treatment and chemical lime treatment. Coliphage appears to better reflect the removal of viruses during the disinfection process.
Reverse osmosis was found to be the single most effective barrier to cysts and oocysts. Chemical treatment was the next most effective and sand filtration the least. No studies to date have examined the disinfection of cysts and oocysts or the optimization of sand filtration in wastewater or reclaimed water.
TABLE 3-16 Relative Removal of Pathogens and Coliform Indicators by Various Treatment Processes
|
Unit Process |
Enterovirus |
Giardia |
Cryptosporidium |
Coliform |
|
Biological secondary treatment |
+ |
+ |
ND |
+ |
|
Coagulation-flocculation-sedimentation-filtration |
++ |
++ |
+ |
++ |
|
Chlorination (free) |
+++ |
+ |
- |
++++ |
|
Combined chlorine |
+ |
- |
- |
++ |
|
Ozone disinfection |
++++ |
++ |
+ |
++++ |
|
UV disinfection |
++ |
+ |
ND |
++++ |
|
Reverse osmosis |
+++ |
+++ |
+++ |
+++ |
|
Lime treatmenta |
++ |
++ |
++ |
+++ |
|
Microfiltration |
+ |
+++ |
++++ |
++++ |
|
Ultrafiltration |
++++ |
++++ |
++++ |
++++ |
|
NOTE: + signs indicate removal from low (+) to very high (++++); minus sign indicates no significant removal; ND indicates absence of data to make a judgment. For disinfectants, assessment is based on the rate of inactivation of organisms rather than log removals. a Chemical lime treatment adds a disinfection barrier to bacteria and viruses due to its high pH and a removal barrier to protozoa via the precipitate formed and the sedimentation process. |
||||
Chemical treatment, disinfection (chlorine or ultraviolet), and reverse osmosis are effective barriers for the removal of viruses. Effective barriers for removing protozoa include chemical treatment, reverse osmosis, and, to lesser degree, sand filtration. The efficacy of disinfection, in particular ozone, awaits further evaluation for protozoa removal. Table 3-16 summarizes the relative efficiency of various unit processes in water reclamation systems as barriers to microbial pathogens.
Conclusions
Microbial contaminants in reclaimed water include the enteric bacteria, enteric viruses, and enteric protozoan parasites. Classic waterborne bacterial diseases, such as dysentery, typhoid, and cholera, while still important worldwide, have dramatically decreased in the United States. However, Campylobacter, nontyphoid Salmonella, and pathogenic Escherichia coli still cause a significant number of illnesses, and new emerging diseases also pose potentially significant health risks.
Historically, coliforms have served as an effective indicator for many bacterial pathogens of concern. However, most recognized outbreaks of waterborne disease in the United States are caused by protozoan and
viral pathogens in waters that have met current coliform standards. Table 3-17 summarizes how the three main microorganisms of concern, Giardia, Cryptosporidium, and the enteric viruses, rank with regard to their occurrence in wastewater, resistance to water treatment, adequacy of monitoring, and severity of health risk. Giardia is one of the most frequently identified microbial pathogens, occurring consistently in high numbers in untreated wastewater, secondary effluent, and secondary effluent receiving sand filtration and disinfection. However, the health threat it poses is relatively low because the resulting gastroenteritis is less severe and more amenable to treatment than infections caused by the viruses or Cryptosporidium. Cryptosporidium, which may cause severe diarrhea in immunocompromised individuals, is found in highly variable levels in wastewater. It is highly resistant to disinfection and difficult to detect in untreated wastewater with current methods. Studies in California show that disinfection standards using a concentration/contact time approach can reliably reduce enteroviruses in reclaimed waters. However, monitoring has not been conducted for other viruses of concern, such as adenoviruses, rotaviruses, and Norwalk and related human caliciviruses.
Wastewater may also contain a number of newly recognized or ''emerging" waterborne enteric pathogens or potential pathogens. For some of these organisms there is no evidence of waterborne transmission, and their occurrence in wastewater is suspected but not documented.
Recommendations
To ensure the safety of drinking water produced from reclaimed water, planners, regulators, and operators of potable reuse systems must account for the various existing and potential health risks posed by microbial contaminants.
- Potable reuse systems should continue to employ a combination of advanced physical treatment processes and strong chemical disinfectants as the principal line of defense against most microbial contaminants. Some new membrane water filtration systems can almost completely remove microbial pathogens of all kinds, but experience with them is not yet adequate to depend on them alone for protection against the serious risks posed by these pathogens. Therefore, strong chemical disinfectants, such as ozone or free chlorine, should also be used, even in systems that include membrane filters.
- Current and future facilities should assess and report the effectiveness of their treatment processes in removing microbial pathogens so that the industry and regulators can develop guidelines and stan-
TABLE 3-17 Ranking of Microbial Contaminants of Most Concern in Reclaimed Water
|
Relative Rank |
Concentration in Wastewater |
Variation in Concentration |
|
Most concern |
Giardia at highest levels, always present |
Giardia appears to be constant |
|
Moderate concern |
Enteroviruses, always present |
Enteroviruses moderately variable |
|
Least concern |
Cryptosporidium sometimes present |
Cryptosporidium highly variable, but often undetectable |
- dards for operations. Facilities should report number of barriers, microbial reduction performance, and the reliability or variation. They should conduct seeded tracer and pilot studies to provide data on performance in addition to information on the occurrence, concentrations, and variations in loadings of indigenous microorganisms. Appropriate disinfection studies should also be undertaken for the enteric protozoa and for some viruses.
-
•
To provide protection against emerging pathogens, the EPA should support research to develop methods for detecting emerging pathogens in environmental samples. Research is also needed on the effectiveness of various water or wastewater treatment processes and disinfectants in removing or inactivating these pathogens.
-
•
Both the industry and the research community need to establish the performance and reliability of individual barriers to microorgan-
|
Resistance to Treatment |
Barriers Available to Control Microorganism |
Ability to Monitor Microorganisms or Adequate Surrogate |
Health Outcome |
|
Cryptosporidium most resistant |
Giardia by filtration and possibly disinfection (no data on wastewater or reclaimed water disinfection of cysts) |
Giardia cysts directly |
Some enteroviruses cause serious illness (e.g., heart disease, chronic sequelae) |
|
Giardia more resistant to disinfection than bacteria or viruses |
Enteroviruses by disinfection |
Enteroviruses directly; coliphage is a possible surrogate |
Cryptosporidium diarrhea; 1.0% hospitalization; 50% mortality in immuno-compromized population |
|
Enteroviruses more resistant than bacteria |
Cryptosporidium by filtration |
Cryptosporidium oocysts directly; Clostridium is a possible surrogate |
Giardia causes diarrhea, sometimes chronic; 0.45% hospitalization; 0.0001% mortality |
- isms within treatment trains and to develop performance goals appropriate to planned potable reuse. Most present regulations and guidelines for microbial water quality and treatment performance are based on nonpotable reuse studies focusing on incidental or recreational contact with reclaimed water. Since potable reuse poses greater risks, existing state reuse regulations may not be sufficiently stringent. And while national standards for water treatment are based on scientific risk assessment procedures, they generally assume that the source water is natural surface water or ground water. Potable reuse projects, as well as water sources that are heavily impacted by upstream wastewater discharges, may need to achieve greater levels of pathogen reduction. Only California has established treatment barriers for viruses that are more protective than those used in ordinary drinking water treatment facilities. Treatment standards and goals more appropriate to potable reuse projects need
- to be developed so they will be in place as the number of potable reuse projects increases.
References
Abad, F. X., R. M. Pinto, C. Villena, R. Gajardo, and A. Bosch. 1997. Astrovirus survival in drinking water. Applied and Environmental Microbiology 63:3119-3122.
Asano, T., L. Y. C. Leong, M. G. Rigby, and R. H. Sakaji. 1992. Evaluation on the California wastewater reclamation criteria using enteric virus monitoring data. Water Science and Technology.
Bennett, J. V., S. D. Homberg, M. F. Rogers, and S. L. Solomon. 1987. Infectious and Parasitic diseases. American Preventive Medicine 3:102-114.
Bryan, R. T., A. Cali, R. L. Owen, and H. C. Spencer. 1991. Microsporidia: Opportunistic pathogens in patients with AIDS. Pp. 1-26 in T. Sun (ed) Progress in Clinical Parasitology. Philadelphia: Field and Wood.
Burke, V., J. Robinson, M. Gracey, D. Peterson, and K. Partridge. 1984. Isolation of Aeromonas hydrophila from a metropolitan water supply: seasonal correlation with clinical isolates. Applied and Environmental Microbiology 48:361-366.
Carmichael, W. W. 1994. The toxins of cyanobacteria. Scientific American :78-86.
Caul, E. O. 1994. Human coronaviruses. Pp. 603-625 in Kapikian, A. Z. (ed.) Viral Infections of the Gastrointestinal Tract. New York: Marcel Dekker.
Centers for Disease Control and Prevention (CDC). 1993. Surveillance for waterborne disease outbreaks—United States, 1991-1992. MMWR 42:1-22.
Centers for Disease Control and Prevention (CDC). 1990. Waterborne disease outbreaks. U.S. Department of Health and Human Services, Atlanta, Ga. Morbidity and Mortality Weekly Report 39(SS-1):1-57
CH2M Hill. 1993. Tampa Water Resources Recovery Project Pilot Studies, Volume 1 Final Report. Tampa, Fla.: CH2M Hill.
Codd, G. A., S. G. Bell, and W. P. Brooks. 1989. Cyanobacterial toxins in water. Water Science and Technology 21:1-13.
Cooper, R. C., and R. E. Danielson. 1996. Detection of bacterial pathogens in wastewater and sludge. Pp. 222-230 in C. J. Hurst et al. (eds.) Manual of Environmental Microbiology. Washington, D.C.: ASM Press.
Crabtree, K. D., C. P. Gerba, J. B. Rose, and C. N. Haas. 1997. Waterborne adenovirus: A risk assessment. Water Science and Technology 11-12: 1-6.
Craun, G. F. 1986. Waterborne Diseases in the United States. Boca Raton, Fla.: CRC Press.
Craun, G. F. 1991. Statistics of waterborne disease in the United States. Water Science and Technology 24(2):10-15.
Craun, G. F., R. L. Calderon, F. J. Frost. 1996. An introduction to epidemiology. Journal of the American Water Works Association 88(9):54-65.
Crook, J. 1992. Water Reclamation. Pp. 559-589 In Encyclopedia Physical Science and Technology, Vol. 17. San Diego, Calif.: Academic Press.
Current, W. L., and L. S. Garcia. 1991. Cryptosporidiosis. Clinical Microbiology Review 4(3):325-358.
Danielson, R. E., L. A. Pettegrew, J. A. Soller, A. W. Olivieri, D. M. Eisenberg, and R. C. Cooper. 1996. A microbiological comparison of a drinking water supply and reclaimed wastewater for direct potable reuse. Paper presented at the Joint AWWA and WEF Water Reuse 96 Conference held in San Diego, Calif., January 1996.
DeRegnier, D., L. Cole, D. G. Schupp, and S. L. Erlandson. 1989. Viability of Giardia cysts suspended in lake, river and tap water. Applied and Environmental Microbiology 55(5):1223-1229.
Enroth, H., and L. Engstrand. 1995. Immunomagnetic separation and PCR for detection of Helicobacter pylori in water and stool samples. Journal of Clinical Microbiology 33:2162-2165.
El Saadi, O., A. J. Esterman, S. Cameron, and D. M. Roder. 1995. Murray River water, raised cyanobacterial cell counts, and gastrointestinal and dermatological symptoms. Medical Journal of Australia 162:122-125.
Elder, G. H., P. R. Hunter, and G. A. Codd. 1993. Hazardous freshwater cyanobacteria (blue-green algae). Lancet 341:1519-1520.
Fayer, R. G., and B. L. P. Ungar. 1986. Cryptosporidium spp. and cryptosporidiosis. Microbiology Review 50(4): 458-483.
Feachem, R. G., D. J. Bradley, H. Garelick, and D. D. Mara (eds.). 1983. Entamoeba histolytica and amebiasis. Pp. 337-347 in Sanitation and Disease: Health Aspects of Excreta and Wastewater Management. New York: John Wiley and Sons.
Fiedorek, S. C., H. M. Malaty, D. L. Evans, C. L. Pumphrey, H. B. Casteel, D. J. Evans, and D. Y. Graham. 1991. Factors influencing the epidemiology of Helicobacter pylori infection in children. Pediatrics 88:578-582.
Finch, G. R., B. Kathleen, and L L. Gyurek. 1994. Ozone and chlorine inactivation of Cryptosporidium. Pp. 1303-1320 in Proceedings of the American Water Works Association's Water Quality Technology Conference, San Francisco, Calif., November 6-10. Denver, Colo.: American Water Works Association.
Foy, H. M. 1991. Adenoviruses. Pp. 77-94 in Evans, A. S. (ed.) Viral Infections of Humans: Epidemiology and Control. New York: PlenumMedical Book Company .
Frost, F. J., G. F. Craun, and R. L. Calderon. 1996. Waterborne disease surveillance. Journal of the American Water Works Association 88(9): 66-75.
Geldreich, E. E., K. R. Fox, J. A. Goodrich, E. W. Rice, R. M. Clark, and D. L. Swerdlow. 1992. Searching for a water supply connection in the Cabool, Missouri, disease outbreak of Escherichia coli 0157:H7. Water Research 26:1127-1137.
Gerba, C. P., S. N. Singh, and J. B. Rose. 1985. Waterborne viral gastroenteritis and hepatitis. CRC Crit. Rev. in Environmental Control 15:213-236.
Gerba, C. P., and J. B. Rose. 1993. Comparative environmental risk. Pp. 117-135 in Cothern, C. R. (ed.) Estimating Viral Disease Risk From Drinking Water. Boca Raton, Fla.: Lewis Publishers.
Gerba, C. P., J. B. Rose, and C. N. Haas. 1994. Waterborne disease: Who is at risk? in Proceedings of the American Water Works Association's Water Quality Technology Conference, San Francisco. Denver, Colo.: American Water Works Association.
Gerba. C. P., J. B. Rose, and C. N. Haas. 1996. Sensitive population: Who is the greatest risk? International Journal of Food Microbiology 30:113-123.
Goodgame, R. W. 1996. Understanding the intestinal spore-forming protozoa: Cryptosporidium, microsporidia, Isospora and Cyclospora. Annals of Internal Medicine 124:429-441.
Grabow, W. O. K., B. W. Bateman, and J. S. Burger. 1978. Microbiological quality indicators for routine monitoring of wastewater reclamation systems. Prog. Wat. Tech 10:317-327.
Grabow, W. O. K. 1990. Microbiology of drinking water treatment: Reclaimed wastewater. Pp. 185-203 in McFeters, G. A. (ed.) Drinking Water Microbiology: Progress and Recent Developments. New York: Springer-Verlag.
Hale, D., W. Aldeen, and K. Carroll. 1994. Diarrhea associated with cyanobacterialike bodies in an immunocompetent host. JAMA 271:144-145.
Havelaar, A. H., F. M. Schets, A. van Silfhout, W. H. Jansen, G. Wieten, and D. van der Kooij. 1992. Typing of Aeromonas strains from patients with diarrhea and from drinking water. Journal of Applied Bacteriology 72:435-444.
Hawkins, P. R., M. T. C. Runnegar, A. R. B. Jackson, and I.Falconer. 1985. Severe hepatotoxicity caused by the tropical cyanobacterium (blue-green alga) Cylindrospermopsis raciborskii (Woloszynska) Seenaya and Subba Raju isolated from a domestic water supply reservoir. Applied and Environmental Microbiology 50:1292-1295.
Herwaldt, B. L., G. F. Craun, S. L. Stokes, and D. D. Juranek. 1992. Outbreaks of waterborne disease in the United States: 1989-90. Journal of the American Water Works Association 84:129-135.
Hoff, J. C. 1986. Inactivation of Microbial Agents by Chemical Disinfectants. EPA/600/2861067. Washington, D.C.: EPA, Drinking Water Research Division.
Hopkins, R. J., P. A. Vial, C. Ferreccio, J. Ovalle, P. Prado, V. Sotomayor, R. G. Russell, S. S. Wasserman, and J. G. Morris. 1993. Seroprevalence of Helicobacter pylori in Chile: Vegetables may serve as one route of transmission. Journal of Infectious Diseases 168:222-226.
Huang P., J. T. Weber, D. M. Sosin, P. M. Griffin, E. G. Long, J. J. Murphy, F. Kocka, C. Peters, and C. Kallick. 1995. The first reported outbreak of diarrheal illness associated with Cyclospora in the United States. Annals of of Internal Medicine 123:409-414.
Hurst, C. J., W. H. Benton, and R. E. Stetler. 1989. Detecting viruses in water. Journal of the American Water Works Association 8(9):71-80.
Institute of Medicine. 1992. Emerging Infections: Microbial Threats to Health in the United States. Washington, D.C.: National Academy Press.
Irving, L. G. 1982. Viruses in wastewater effluents. P. 7 in Butler, M., A. R. Medlen, and R. Morris (eds.) in Viruses and Disinfection of Water and Wastewater. United Kingdom: University of Surry.
James M. Montgomery, Inc. 1979. Water Factory 21 Virus Study. Conducted under contract to Orange County Water District, Fountain Valley, Calif. Pasadena, Calif.: James M. Montgomery, Consulting Engineers, Inc.
James M. Montgomery, Inc., 1981. Water Factory 21 Environmental Virus and Parasite Monitoring. Conducted under contract to Orange County Water District, Fountain Valley, Calif. James M. Pasadena, Calif.: Montgomery, Consulting Engineers, Inc.
James M. Montgomery, Inc. 1983. Operation, Maintenance, and PerformanceEvaluation of the Potomac Estuary Experimental Water Treatment Plant, Executive Summary, September 1980-September 1983 . Conducted under contract to the U.S. Army Corps of Engineers, Baltimore District. Alexandria, Va.: James M. Montgomery, Consulting Engineers, Inc.
Kapikian, A. Z., M. K. Estes, and R. M. Chanock. 1996. Norwalk Group of Viruses. Pp. 783-810 in Fields, B. N., D. M. Knipe, and P. M. Howley (eds.) Fields Virology, Third Edition. Philadelphia: Lippincott-Raven Publishers.
Kaplan, J. E., R. Feldman, D. S. Campbell, C. Lookabaugh, and G. W. Gary. 1982. The frequency of a Norwalk-like pattern of illness in outbreaks of acute gastroenteritis. Am. J. Public Health 72:1329-1332.
Kappus. K. K., D. D. Juranek, and J. M. Roberts. 1992. Results of testing for intestional parasites by state: Diagnostic laboratories, United States, 1987. Morbidity and Mortality Weekly Report 40(SS-4): 25.
Klein, P. D., Gastrointestinal Physiology Working Group, D. Y. Graham, A. Gaillour, A. R. Opekun, and E. O. Smith. 1991. Water source as risk factor for Helicobacter pylori infection in Peruvian children. Lancet 337:1503-1506.
Koopmans, M., A. Herrewegh, and M. C. Horzinek. 1991. Diagnosis of torovirus infection. Lancet 337(8745):859.
Koopmans, M., M. Petric, R. I. Glass, and S. S. Monroe. 1993. Enzyme-linked immunosorbent assay reactivity of torovirus-like particles in fecal specimens from humans with diarrhea. Journal of Clinical Microbiology 31:2738-2744.
Korhonen, L. K., and P. J. Martikainen. 1991. Survival of Escherichia coli and Campylobacter jejuni in untreated and filtered lake water. Journal of Applied Bacteriology 71:379-382.
Korick, D. G., J. R. Mead, M. S. Madore, N. A. Sinclair, and C. R. Sterling. 1990. Effects of ozone, chlorine dioxide, chlorine and monochloramine on Cryptosporidium parvum oocysts viability. Applied and Environmental Microbiology 56(5):1423-1428
Kurtz, J. B., and T. W. Lee. 1987. Astroviruses: human and animal. Pp. 92-107 in Bock G., and J. Whelan (eds.) Novel diarrhea viruses. Ciba Foundation Symposium 128. Chichester: Wiley.
Kutz, S. M., and C. P. Gerba. 1988. Comparison of virus survival in freshwater sources. Water Science and Technology 20(11/12):467-471.
Lauer, W. C. 1990. Denver's Direct Potable Water Reuse Demonstration Project. Final Report to EPA. Denver, Colo.: Denver Water Department.
Lauer, W. C. 1991. Water quality for potable reuse. Water Science and Technology 23:2171-2180.
Lauer, W. C., S. E. Rogers, A. M. La Chance, and M. K. Nealy. 1991. Process selection for potable reuse health effects studies. Journal of the American Water Works Association 83:52-63.
Lisle, J. T., and J. B. Rose. 1995. Cryptosporidium contamination of water in the USA and UK: A mini-review. Journal of Water SRT-Aqua 42(4):1-15.
MacKenzie, W. R., N. J. Hoxie, M. E. Proctor, M. S. Gradus, K. A. Blair, D. E. Peterson, J. J. Kazmierczak, D. G. Addiss, K. R. Fox, J. B. Rose, and J. P. Davis. 1995. A massive outbreak in Milwaukeeof Cryptosporidium infection transmitted through the public water supply . New England Journal of Medicine 331(3):161-167.
Madore, M. S., J. B. Rose, C. P. Gerba, M. J. Arrowood, and C. R. Sterling. 1987. Occurrence of Cryptosporidium oocysts in sewage effluents and selected surface waters. Journal of Parasitology 73(4):702-705.
Mascher, F., F. F. Reinthaler, D. Stunzner, and B. Lamberger. 1988. Aeromonas species in a municipal water supply of a central European city: Biotyping of strains and detection of toxins. Zentralblatt Bakteriologie, Mikrobiologie, und Hygiene 186:333-337.
Matsui, S. M., and H. B. Greenberg. 1996. Astroviruses. Pp. 811-824 in Fields, B. N. et al. (eds.) Fields Virology, Third Edition. Philadelphia: Lippincott-Raven Publishers.
McFeters, G. A., and S. I. Terzieva. 1991. Survival of Escherichia coli and Yersinia enterocolitica in stream water: Comparison of field and laboratory exposure. Microb. Ecol. 22:65-74.
McIntosh, K. 1996. Coronaviruses. Pp. 1095-1103 in Fields, B. N. et al. (eds.) Fields Virology. Third Edition. Philadelphia: Lippincott-Raven Publishers.
Mendall, M. A., P. M. Goggin, N. Molineaux, J. Levy, T. Toosy, D. Strachan, and T. C. Northfield. 1992. Childhood living conditions and Helicobacter pylori seropositivity in adult life. Lancet 339:896-897.
Millership, S. E., J. R. Stephenson, and S. Tabaqchali. 1988. Epidemiology of Aeromonas species in a hospital. Journal of Hospital Infection 11:169-175.
Mitchell, H. M., Y. Y. Li, P. J. Hu, Q. Liu, M. Chen, G. G. Du, Z. J. Wang, A. Lee, and S. L. Hazell. 1992. Epidemiology of Helicobacter pylori in Southern China: Identification of early childhood as the critical period for acquisition. Journal of Infectious Diseases 166:149-153.
Moore, A. C., Herwaldt, B. L., Craun, G. F., Calderon, R. L., Highsmith, A. K., Juranek, D. D. 1993. Surveillance for waterborne disease outbreaks-United States, 1991-1992. Morbidity and Mortality Weekly Report 42(SS-5):1-22.
Moyer, N. P. 1987. Clinical significance of Aeromonas species isolated from patients with diarrhea. Journal of Clinical Microbiology 25:2044-2048.
National Research Council. 1996. Use of Reclaimed Water and Sludge in Food Crop Production. Washington, D.C.: National Academy Press.
Nazer, H., E. Price, G. Hunt, U. Patel, and J. Walker-Smith. 1990. Isolation of Aeromonas spp. from canal water. Indian J. Pediatr. 57:115-118.
Oregon Health Division. 1992. A Large Outbreak of Cryptosporidiosis in Jackson County. Communicable Disease Summary, Oregon Health Division, Portland, Oregon 41(14).
Ortega, Y. R., C. R. Sterling, R. H. Gilman, V. A. Cama, and F. Diaz. 1993. Cyclospora species-A new protozoan pathogen of humans. New England Journal of Medicine 328:1308-1312.
Osterholm, M. T., K. L. MacDonald, K. E. White, J. G. Wells, J. S. Spika, M. E. Potter, J. C. Forfang, R. M. Sorenson, P. T. Milloy, and P. A. Blake. 1986. An outbreak of a newly recognized chronic diarrhea syndrome associated with raw milk consumption. JAMA 256:484-490.
Parsonnet, J., S. C. Trock, C. A. Bopp, C. J. Wood, D. G. Addiss, F. Alai, L. Gorelkin, N. Hargrett-Bean, R. A. Gunn, and R. V. Tauxe. 1989. Chronic diarrhea associated with drinking untreated water. Annals of Internal Medicine 110:985-991.
Peeters, J. E., E. A. Mazas, W. J. Masschelein, I. Villacorta Martinez de Maturana, and E. DeBacker. 1989. Effect of drinking water with ozone or chlorine dioxide on survival of Cryptosporidium parvum oocysts. Applied and Environmental Microbiology 55(6):1519-1522.
Pereira, H. G., A. M. Fialho, T. H. Flewett, J. M. S. Teixeira, and Z. P. Andrade. 1988. Novel viruses in human faeces. Lancet ii:103-104.
Petric, M. 1995. Caliciviruses, astroviruses, and other diarrheic viruses. Pp. 1017-1024 in Murray, P. R., and E. J. Baron (eds.) Manual of Clinical Microbiology, Sixth Edition. Washington, D.C.: ASM Press.
Rabold, J. G., C. W. Hoge, D. R. Shlim, C. Kefford, R. Rajah, and P. Echeverria. 1994. Cyclospora outbreak associated with chlorinated drinking water. Lancet 344:1360-1361.
Regli, S., J. B. Rose, C. W. Haas, and C. P. Gerba. 1991. Modeling risk for pathogens in drinking water. Journal of the American Water Works Association (November):76-84.
Robert, L. J., A. T. Campbell, and H. V. Smith. 1992. Survival of Cryptosporidium parvum oocysts under various environmental pressures. Applied and Environmental Microbiology 55(6):1519-1522.
Rogers, S. E., and W. C. Lauer. 1992. Denver's demonstration of potable reuse: Water quality and health effects testing. Water Science and Technology 26:1555-1564.
Rose, J. B., and C. P. Gerba. 1990. Assessing potential health risks from viruses and parasites in reclaimed water in Arizona and Florida. Water Science and Technology 23:2091-2098.
Rose, J. B., L. J. Dickson, S. R. Farrah, and R. P. Carnahan. 1996. Removal of pathogenic and indicator microorganisms by a full-scale water reclamation facility. Wat. Res. 30(11):2785-2797.
Rose J. B., M. Robbins, D. Friedman, K. Riley, S. R. Farrah, and C. L. Hamann. 1997. Evaluation of microbiological barriers at the Upper Occoquan Sewage Authority. Pp. 291-305 in 1996 Water Reuse Conference Proceedings, February 25-28, San Diego, Calif. Denver, Colo.: American Water Works Association.
Sagik, B. P., B. E. Moore, and C. A. Sorber. 1978. Infectious disease potential of land application of wastewater. Pp. 35-46 in State of Knowledge in Land Treatment of Wastewater, Vol. 1. Proceedings of an International Symposium, U.S. Army Corps of Engineers, Cold Regions Research and Engineering Laboratory, Hanover, New Hampshire.
Schubert, R. H. W. 1991. Aeromonads and their significance as potential pathogens in water. Journal of Applied Bacteriology 70:131S-135S.
Shahamat, M., C. Paszko-Kolva, H. Yamamoto, U. Mia, A. D. Pearson, and R. R. Colwell. 1989. Ecological studies of Campylobacter pylori. Klinische Wochenschrrift 67:62-63.
Shlim, D. R., M. T. Cohen, M. Eaton, R. Rajah, E. G. Long, and B. L. P. Ungar. 1991. An alga-like organism associated with an outbreak of prolonged diarrhea among foreigners in Nepal. Am. J. Trop. Med. Hyg. 45:383-389.
Singh, A., and G. A. McFeters. 1990. Injury of enteropathogenic bacteria. Pp. 368-379 in McFeters, G. A. (ed.) Drinking Water In Drinking Water Microbiology. New York: Springer-Verlag.
Smith, J. L., S. A. Palumbo, and I. Walls. 1993. Relationship between foodborne bacterial pathogens and the reactive arthritides. Journal of Food Safety 13:209-236.
Sykora, J. L., C. A. Sorber, W. Jakubowski, L. W. Casson, P. D. Gavaghan, M. A. Shapiro, and M. J. Schott. 1991. Distribution of Giardia cysts in wastewater. Water Science and Technology 24:187-192.
Terzieva, S. I., and G. A. McFeters. 1991. Survival and injury of Escherichia coli, Campylobacter jejuni, and Yersinia enterocolitica in stream water. Canadian Journal of Microbiology 37:785-790.
Turner, P. C., A. J. Gammie, K. Hollinrake, and G. A. Codd. 1990. Pneumonia associated with contact with cyanobacteria. British Medical Journal 300:1440-1441.
U.S. Environmental Protection Agency (EPA). 1989. Surface Water Treatment Rule, Guidance Manual for Compliance With the Filtration and Disinfection Requirements for Public Water Systems Using Surface Water Sources. Federal Register, Vol. 54, No. 124, June 29.
U.S. Environmental Protection Agency (EPA). 1996. 1977 EPA Research Grants Announcement. Report No. 600/R-96/125,, Office of Research and Development, USEPA, Washington, D.C.
van der Kooij, D. 1993. Importance and assessment of the biological stability of drinking water in the Netherlands. Pp. 165-179 in Craun, G. F. (ed.) Safety of Water Disinfection: Balancing the Chemical and Microbial Risks. Washington, D.C.: ILSI Press.
Villacorta-Martinez De Maturana, I., M. E. Ares-Mazas, D. Duran-Oreiro, and M. J. Lorenzo-Lorenzo. 1992. Efficacy of activate sludge in removing Cryptosporidium parvum oocysts from sewage. Applied and Environmental Microbiology 58(11):3514-3516.
Wagenknecht, L. E., J. M. Roseman, and W. H. Herman. 1991. Increased incidence of insulin-dependent diabetes mellitus following an epidemic of coxsackievirus B5. American Journal of Epidemiology 133: 1024-1031.
Weber, R., R. T. Bryan, R. L. Owen, C. M. Wilcox, L. Gorelkin, G. S. Visvesvara, and Enteric Opportunistic Infections Working Group. 1992. Improved light-microscopical detection of microsporidia spores in stool and duodenal aspirates. New England Journal of Medicine 326:161-166.
West, A. P., M. R. Millar, and D. S. Tompkins. 1990. Survival of Helicobacter pylori in water and saline. Journal of Clinical Pathology 43:609.
Western Consortium for Public Health. 1992. The City of San Diego Total Resource Recovery Project Health Effects Study, Final Summary Report. Oakland, Calif.: Western Consortium for Public Health.
Yanko, W. A. 1993. Analysis of 10 years of virus monitoring data from Los Angeles County treatment plants meeting California wastewater reclamation criteria. Wat. Environ. Res. 65(3): 221-226.
Yolken, R., F. Leister, J. Almeido-Hill, E. Dubovi, R. Reid, and M. Santosham. 1989. Infantile gastroenteritis associated with excretion of pestivirus antigens. Lancet 1:517-519.


