
2
Contributions Of The Research And Data Analysis Programs
The R&DA programs encompass a wide variety of activities conducted by thousands of researchers within NASA, other government laboratories, universities, and industry. Although the total budget allocated to R&DA exceeds $1.5 billion (FY 1997) in constant FY 1995 dollars, much of this consists of individual awards of $100,000 or less (see Chapter 4). Most R&DA projects originate in the creative imaginations of investigators who submit proposals within the context of a specific program in one of NASA's larger science areas—astronomy and astrophysics, solar-terrestrial interactions, planetary sciences, Earth sciences, and life and microgravity sciences. These proposals are ranked through peer review processes that assess their scientific merit, feasibility, and value to the specific program. The outcomes of R&DA activities are equally diverse, ranging from published papers to designs for new instrumentation, the award of a Ph.D. degree, and educational products for elementary schools.
This breadth and diversity, often considered one of the positive attributes of R&DA, have also made it difficult for third parties to understand the nature of these programs and to appreciate their effectiveness and value. In an attempt to describe R&DA—its array of roles, functions, and impacts on science and society—the task group collected samples of projects from each of the major science themes and organized them according to the following categories:
-
Discoveries that influence societal and economic issues and policies;
-
Breakthroughs that change scientific understanding;
-
Technologies that enable new observations;
-
Information that improves mission design;
-
Investments that increase the productivity of flight projects;
-
Research that complements the work of other federal agencies; and
-
Science-driven adventure that stimulates interest in math, science, or engineering education.
The examples cited in these seven categories are exemplary, not necessarily because of the process by which they achieved results, but because they illustrate the value that R&DA projects can have for
society, for science, and for NASA's missions. These examples are not meant to be typical of all R&DA grants, nor—for disciplines that span the interests of more than one federal agency—do they necessarily represent spheres of NASA leadership, but they do illustrate how modest R&DA investments make a significant difference.
2.1 DISCOVERIES THAT INFLUENCE SOCIETAL AND ECONOMIC ISSUES AND POLICIES
R&DA projects occasionally inform policy debates about issues of national importance or change the way we live or work. Two examples of the former and one of the latter are presented in this section. In the first, results from R&DA research have helped provoke political action; in the second, emerging technologies have stimulated R&DA research in anticipation of political interest; and in the third, products of R&DA-funded research have contributed to understanding the linkages between El Niño, the Southern Oscillation, and global weather, and consequently to developing regional crop strategies in agribusiness. Box 2.1 contains additional examples of this type.
1. Discovery And Diagnosis Of The Antarctic Ozone Hole, A Major, Unanticipated Surprise For Scientists, Caused Significant Changes In Public Policy.
The annual cycle of ozone in the stratosphere over the Antarctic has been tracked by scientists beginning with projects that were part of the International Geophysical Year in 1957. In the late 1970s, an unexplained deficit emerged in the total ozone amount in late-winter observations. In 1985, the British Antarctic Survey reported for the first time that dramatic decreases were occurring in the ozone concentration over Halley Bay and that the degree of ozone loss was worsening as the decade progressed. Theories of the cause of this unprecedented loss were put forward by serious scientific research groups in an international effort to diagnose the reason for this alarming development. In one example, investigators applied models that had been developed under a NASA R&DA project to study the upper-atmospheric photochemistry of Venus and Mars. There were several expeditions to gather more information and, in August and September 1987, NASA contributed an R&DA-funded airborne survey. An ER-2 aircraft flew from Punta Arenas, Chile, to penetrate the region of the stratosphere where ozone was disappearing. The key results are shown in Plate 2.1.
The mission demonstrated unequivocally that ozone was destroyed by chlorine and bromine radicals. The case linking chlorofluorocarbons (CFCs), the molecules that transport chlorine to the stratosphere, to the destruction of ozone over the Antarctic rests on three discoveries from this NASA mission. The first discovery was that the continental-scale region of severe ozone depletion was isolated from the rest of the stratosphere by the polar night jet, which creates a continental-scale ''containment vessel." The existence of this barrier preventing exchange is shown clearly by the high-resolution aircraft data in Figure 2.1. The second discovery was the anticorrelation between O3 and ClO that occurs within this stratospheric containment vessel. Plate 2.1 shows that on August 23, 1987, as sunlight returned to the region, O3 had emerged from the polar night largely unaffected. Three weeks later, on September 16, ozone had eroded sharply in the presence of high ClO concentrations within the sunlit containment vessel. The third discovery emerged from R&DA-funded laboratory studies that determined the rates of key reactions responsible for the destruction of ozone by chlorine and bromine radicals in sunlight.
When taken together, the three elements in this case—each of which has appeared in and been critiqued in the international scientific literature—provide irrefutable evidence that the dramatic reduction in stratospheric ozone over the antarctic continent would not have occurred had CFCs not been
|
Box 2.1 Other Examples of Discoveries That Influence Societal and Economic Issues and Policies
|
synthesized and then added to the atmosphere.1 These findings brought the industrial nations to the political consensus expressed in the Montreal Protocol of 1987. Essentially, the industrial nations agreed to stop producing chlorofluorocarbons.
2. The Possibility Of Designing High-Speed Civil Transport Aircraft To Have A Negligible Effect On Stratospheric Ozone Could Change Future Aeronautics Policy.
More than 20 years after the first supersonic transports began passenger service, manufacturers of large commercial aircraft are again exploring the economic viability of a Mach 2.4 high-speed civil transport (HSCT). Some of the risk associated with developing the HSCT lies in the potential destruction of stratospheric ozone by fleets of these
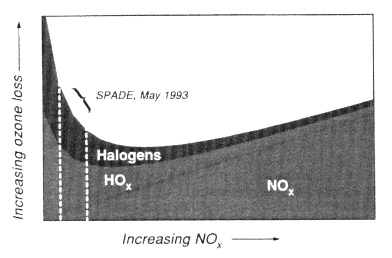
Figure 2.1 Removal rate of O3 versus NOx concentration. Because of the coupling that exists between radical families, the response of the total O3 removal rate to changes in NOx concentration is highly nonlinear. At sufficiently low NOx levels, such as observed during the NASA mission, the removal rates are inversely correlated with NOx concentration. Source: P.O. Wennberg, R.C. Cohen, R.M. Stimpfle, J.P. Koplow, J.G. Anderson, R.J. Salawitch, D.W. Fahey, E.L. Woodbridge, E.R. Keim, R.S. Gao, C.R. Webster, R.D. May, D.W. Toohey, L.M. Avallone, M.H. Proffitt, M. Loewenstein, J.R. Podolske, K.R. Chain, and S.C. Wofsy, "Removal of Stratospheric O3 by Radicals: In Situ Measurements of OH, HO2, NO, NO2, ClO, and BrO," Science 266:398-404, 1994.
aircraft. The civil transport industry in the United States will attempt to mitigate this risk by asking the federal government to resolve the environmental uncertainties associated with the HSCT. Anticipating this request, NASA developed an R&DA program to examine the response of ozone to injections of HSCT combustion products.
A fundamental premise of the perceived environmental threat from HSCTs has been that the rate of ozone removal in the stratosphere is limited by the NO2 free radical and that a significant fleet of supersonic transports would add appreciably to the concentrations of NOx (x = 1,2,3) in the lower stratosphere. R&DA projects have made two key discoveries that challenge the universality of this premise.
The first discovery emerged from an ER-2 aircraft mission over the Arctic, which demonstrated that aerosols (minute liquid droplets) have a dramatic impact on the fraction of reactive nitrogen tied up as free radicals (i.e., as NO or NO2) in the lower stratosphere. These free radicals were being converted through a catalytic process involving the aerosols to a less-reactive nitrogen oxide, thereby providing a natural "sink" for reactive nitrogen compounds such as those found in the combustion effluent of the proposed HSCT.2
|
2 |
D.W. Fahey, S.R. Kawa, et al., "In Situ Measurements Constraining the Role of Sulphate Aerosols in Mid-Latitude Ozone Depletion," Nature 363(6429):509-514, June 10, 1993. Additional information on the Airborne Arctic Stratospheric Expedition (AASE) can be found on the official NASA Web page for the AASE experiment, which is maintained by the Earth Science Division Project Office at NASA Ames Research Center, at <http://cloudl.arc.nasa.gov/aase/index.html>. In addition, the results of the AASE were published in a special issue of Geophysical Research Letters (see vol. 17, no. 4, 1990). |
The second discovery emerged from the NASA Stratospheric Photochemistry, Aerosol and Dynamics Expedition (SPADE) mission in May 1993. Data from this ER-2 mission demonstrated that under certain conditions, the rate of catalytic ozone destruction is inversely correlated with total NOx loading.3 The relationship between ozone loss rates and added NOx is clearly captured in Figure 2.1.
These two discoveries changed the scientific community's judgment with respect to the expected impact of the NOx component of the HSCT effluent. Specifically, if there is a region of the stratosphere in which the addition of NOx would actually decrease the rate of ozone catalytic destruction, it becomes plausible, contingent on the aircraft design and the dynamic and chemical characteristics of the stratosphere at higher altitudes, that the addition of NOx to the lower stratosphere could leave the ozone column virtually unaffected.
3. New Understanding Of The Linkage Between El Niño-Southern Oscillation (Enso) And Seasonal-To-Interannual Climate Influences Farming And Business Strategies.
Although NASA has not been a principal contributor in the investigation of ENSO, as have the National Science Foundation (NSF) and the National Oceanic and Atmospheric Administration (NOAA), the exciting advances in understanding ENSO illustrate how well-conceived R&DA projects enhance capabilities to address global-scale problems.
The occurrence of large year-to-year variations in the weather patterns of Earth is well known to everyone. They are a motive force behind major disruptions in agricultural output, fishery yields, industrial production, tourism, and international trade balances. In the western tropical Pacific, the sea surface is warm, there is extensive precipitation, and the pressure at sea level is low. In contrast, the eastern tropical Pacific is characterized by cool surface waters, limited precipitation, and high sea-level pressure. The phenomenon labeled El Niño manifests as an episodic warming of the eastern tropical Pacific. Occasionally, the warm pool in the western tropical Pacific migrates eastward, and the rainy low-pressure domain moves with it. This El Niño typically lasts three or more seasons.
The Southern Oscillation is an interannual oscillation in sea level atmospheric pressure between a region over northern Australia and a site in the central Pacific. The El Niño and the Southern Oscillation are correlated in time. The occurrence of this tropical ocean warming is correlated with dramatic changes in the fishing yields off the west coast of Peru, the character and intensity of storms along the west coast of the United States and Mexico, the propensity for hurricanes, the timing and strength of monsoons, the amount and timing of rainfall in the eastern part of Africa, and crop yields in the semiarid region of northeastern Brazil.
By the early 1980s, the link between the occurrence of ENSO and the weather patterns of the Northern Hemisphere was beginning to emerge, as were discriminating explanations of the sequence of events during oscillations between the warm and cold phases of ENSO. The massive El Niño of 1982 catalyzed scientists in two ways: (1) it irreversibly joined the oceanic and atmospheric communities in the research effort and (2) it focused the character of the scientific question and forced a level of scientific scrutiny and vitality that had not been possible before.
NASA, through its R&DA programs, provided many of the sensor technologies and satellite observing strategies that were used by NOAA, NSF, and others to identify the linkages between ENSO events
|
3 |
P.O. Wennberg et al., "Removal of Stratospheric O3 by Radicals: In Situ Measurements of OH, HO2, NO, NO2, ClO, and BrO," Science 266:398-404, 1994. Additional information on SPADE can be found on the official NASA Web page for the experiment, which is maintained by the Earth Science Division Project Office at NASA Ames Research Center, at <http://cloud1.arc.nasa.gov/spade.index.html>. In addition, results from the SPADE experiment were published in a special issue of Geophysical Research Letters (see vol. 21, no. 23, November 15, 1994). |
and North American weather. Satellite observations such as these, when assimilated within predictive models by NOAA's National Centers for Environmental Prediction (NCEP),4,5 are emerging as some of the most powerful examples of developing predictive ability through the balanced application of observation and theory.
2.2 BREAKTHROUGHS THAT CHANGE SCIENTIFIC UNDERSTANDING
Some scientific research alters paradigms that have been long assumed—sometimes affecting our understanding of our place in the universe. The following four examples belong to this class. Box 2.2 gives additional examples of breakthroughs in this area.
1. Chemical, Structural, And Isotopic Analyses Of Meteorites May Indicate Past Life On Mars.
Among the most fundamental scientific questions is whether or not life exists or existed in the past on other planets or moons within our solar system. R&DA programs provide the primary funding for research that will eventually answer this question. The likely approach to a definitive answer will be extensive laboratory analyses of samples that have been returned from the planets and their moons, but until our technologies allow low-cost sample return or elaborate in situ analyses, the alternative is to examine meteorites found on Earth that have their origin on other planets. A number of meteorites have been identified as martian, based on their unique isotopic compositions that have been observed only on Mars's surface. Analyses of the structure and composition of these meteorites tell us something about Mars's surface at the time the material was ejected.
Two techniques have proven to be particularly powerful. The first, high-resolution transmission electron microscopy (HRTEM), reveals the structure and shape of very small inclusions within a meteorite; the second, microprobe two-step laser mass spectrometry, probes these inclusions for their composition, with a special focus on hydrocarbons. These were among the techniques recently used to find the carbonate globules and identify the polycyclic aromatic hydrocarbons (PAHs) in the Mars meteorite ALH84001 (Figure 2.2). The carbonate globules and PAHs have been interpreted as the fossil remains of life that existed on Mars more than 3.6 billion years ago—a monumental hypothesis.6
|
4 |
For further reading, see R. Atlas, S.C. Bloom, R.N. Hoffman, E. Brin, J. Ardizzone, J. Terry, D. Bungato, and J.C. Jusem, "Geophysical Validation of NSCAT Winds Using Atmospheric Data and Analyses," Journal of Geophysical Research, 1998, in press; Robert Atlas, "Atmospheric Observations and Experiments to Assess Their Usefulness in Data Assimilation," Journal of the Meteorological Society of Japan 75 (1B):111-130, 1997; Robert Atlas, "Preliminary Evaluation of NASA Scatterometer Data and Its Application to Ocean Surface Analysis and Numerical Weather Prediction," reprinted from Earth Observing Systems II, Proceedings of the International Society for Optical Engineering, 28-29 July 1997, San Diego, California, Vol. 3117, pp. 90-97. Additional information can be found on the home page for the NASA Seasonal to Interannual Prediction Project (NSIPP) at <http://nsipp.gsfc.nasa.gov>. |
|
5 |
The NSIPP has been established at the Goddard Space Flight Center to develop an experimental short-term climate prediction capability for the Seasonal-to-Interannual (s-I) Climate Variability and Prediction Program in NASA's Earth Science Division. The NSIPP will serve as a central focus for this S-I program and as the primary mechanism for NASA's S-I contributions to the U.S. Global Change Research Program. The overall objective is to demonstrate the utility of satellite observations in predictions of short-term climate variations, to establish the cost-effective blend of remote surface observations and subsurface data necessary for a seasonal-to-interannual climate prediction capability, and to establish the assimilation and coupled-model systems that will provide the most reliable prediction of El Niño-Southern Oscillation (ENSO) events, other significant S-I variations, and their global teleconnections. One of the project goals is to transition the NSIPP capability and experience to the operational community, in this case the Environmental Modeling Center of NOAA and NCEP. To date, informal connections with this group and with the Climate Prediction Center have been established. |
|
6 |
For further reading, see D.S. McKay, E.K. Gibson, Jr., K.L. Thomas-Keprta, H. Vali, C.S. Romaneck, S.J. Clemett, X.D.F. Chillier, C.R. Maechling, and R.N. Zare, "Search for Past Life on Mars: Possible Relic Biogenic Activity in Martian Meteorite ALH84001," Science 273:924-930, 1996. |
|
Box 2.2 Other Examples of Breakthroughs That Change Scientific Understanding
|
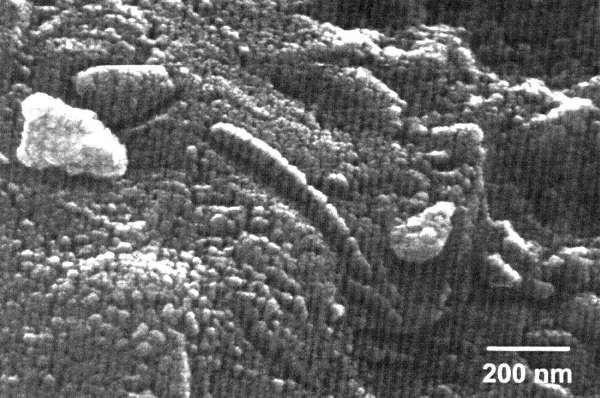
Figure 2.2 Mars meteorite ALH84001. Image courtesy of NASA.
Although this interpretation remains a source of debate among experts, the possibility has captured the imagination of the public and invigorated interest in exobiology within the science community. Without any doubt, this hypothesis will substantially influence plans for future Mars missions, stimulate new R&DA-funded investigations on the current catalog of meteorites, and suggest experiments to explore processes by which life itself may have been transported from one planet to another.7
2. The Hubble Space Telescope Data Analysis Has Opened A New Window On The Universe.
The Hubble Space Telescope (HST)—developed over a period of more than two decades, launched by the shuttle in 1990, and brought into full operation at its specified spatial resolution with the refurbishment mission of 1993—has revolutionized observational astronomy with crisp images of objects ranging from protoplanetary disks and exploding stars to images of the most distant galaxies ever observed. The general public appears fascinated by the strangeness and beauty of the HST images even without understanding their content.
In late 1995, the HST director, on advice from a panel of distinguished astronomers, used his discretionary observing time to obtain the most sensitive high-resolution optical image yet obtained, the Hubble deep-field image (Plate 2.2).8 Nearly 200 orbits of spacecraft time were used to obtain images through four filters. Perhaps the most remarkable part of the experiment was the decision to place the data in the public domain as soon as the pipeline processing was complete. Not only did this generate substantial good will among astronomers, but it also produced a host of new insights about the early epoch of galaxy evolution as diverse groups analyzed the data and shared their results rapidly—often over the Internet.
The HST Guest Observer Program is administered by the Space Telescope Science Institute at the Johns Hopkins University to support design of observing strategies, analysis of data, development of models that test hypotheses, or the publication of results. These are the intellectual elements of space-based astronomy, and they are part of an R&DA program. The HST Guest Observer Program has become one of the most productive of NASA's R&DA programs, rivaling the NSF grants program in its importance to the astronomy community. This example of world-class science based on high-quality space data conducted in full view of an interested public is an excellent model for the NASA science enterprise.9
3. Recognition That Microorganisms Carry "Molecular Fingerprints" Is Providing A New Understanding Of The Diversity And Evolution Of Life On Earth.
Current excitement about the possibility of life elsewhere in the solar system has encouraged scientists to reconsider the question of how well we understand life on Earth. Recent breakthroughs in microbiology, made possible in part by support from NASA's exobiology program, are providing unexpected answers to this question—answers that necessitate a new view of evolution and ecology.
All organisms carry molecular fingerprints in the form of chemical information stored in genes. Like true fingerprints, these genetic signatures uniquely identify the species that harbor them. Unlike conventional fingerprints, however, the information in these genetic signatures allows us to reconstruct the evolutionary relationships among all living organisms—the family tree of life. Research in this area has led to the recognition of a major branch of the tree of life that no one even suspected 20 years ago—
the Archaea (Figure 2.3). Archaea look like bacteria but have different genes for managing and reading their DNA. Some Archaea are able to thrive at temperatures near the boiling point of water and at acidity levels that would etch metal. Because the Archaea branch is near the base of the tree of life, the biology of Archaea provides clues to the nature of early life on our planet. The molecular fingerprints of these and other organisms also enable microbiologists to understand for the first time the true composition of microbial communities—revealing among other things that most of the bacteria and Archaea that cycle materials in soil and water have never been cultured and remain essentially unknown.
Coupled with NASA-sponsored paleontological investigations of Earth's oldest sedimentary rocks, these studies are providing a revolutionary new perspective on early life on Earth, an understanding that will help guide future exploration of Mars and other bodies in the solar system. Because they contain enzymes capable of carrying out molecular functions under extreme conditions, Archaea and other microorganisms that thrive in unusual environments are also of growing interest in the emerging fields of biomolecular technology. Thus, these simple microorganisms hold important keys to understanding both our evolutionary past and our technological future. Research funded by the R&DA program on molecular sequences and their use in understanding the evolutionary relationships of microbial life laid the foundation for recent insights on Archaea.10
4. Exposure To Microgravity Produces Synaptic Plasticity In The Peripheral Vestibular Gravity Receptors.
Human and animal responses to low-gravity environments are most noticeable in balance, orientation, and movement. These neurological processes are controlled by the vestibular system, a major component of the inner ear that helps control movement by its connections with reflex pathways in the central nervous system. Vestibular maculae on each side of the head act as gravity sensors. Research conducted on the Spacelab for Life Sciences (SLS) missions SLS-1 and SLS-2 indicated that maculae possess the property of neuronal plasticity.11 Specifically, it was demonstrated that synapses in the hair cells of rat vestibular maculae increase significantly in number in microgravity. Other new results indicate that macular systems are sensitive to stress. The magnitude of the increments in synapses in these gravity-sensitive hair cells makes them interesting for studying the molecular basis of synaptic plasticity wherever it occurs in the nervous system. The new insights into gravity sensor capability for synaptic change should be clinically relevant to rehabilitative training and/or pharmacological treatments for vestibular disease.
Aside from having scientific and clinical value, ultrastructural findings on these sensory cells led directly to the need to visualize the complex macular microcircuitry in three dimensions, based on serial section transmission electron microscopy (TEM). This was necessary to establish the topographic relationship between nerve fibers and hair cells in the maculae and to determine precisely where synaptic changes occur in altered gravity. The ensuing work was directed toward ultrastructural analysis of synapses in hair cells exposed to microgravity and computer-based, three-dimensional visualization. The visualization software has been provided to more than 30 laboratory investigators around the country for their use. Additionally, the software produced originally for scientific research has now been adapted for medical applications. The new software has been used to produce high-fidelity three-dimensional reconstructions of the face and skull (Plate 2.3) and of the lungs and heart directly from
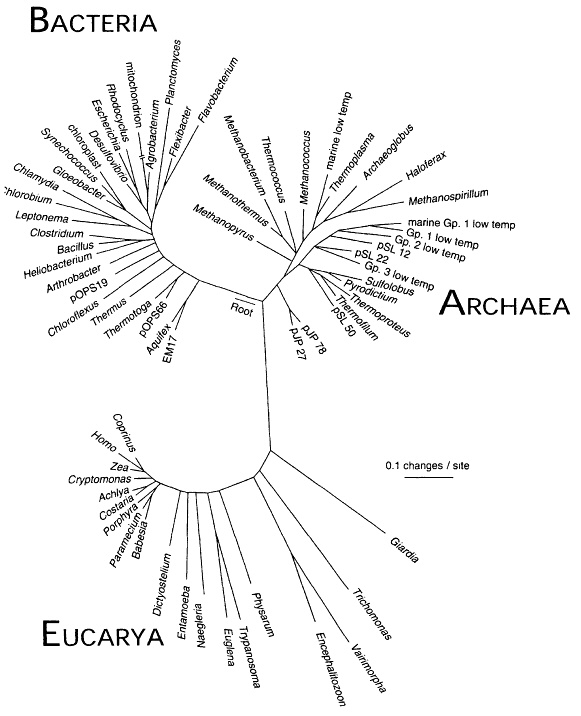
Figure 2.3 Universal phylogenetic tree based on small-subunit ribosomal RNA sequences. Sixty-four rRNA sequences representative of all known phylogenetic domains were aligned and a tree was produced using FASTDNAML. That tree was modified to the composite one shown by trimming lineages and adjusting branchpoints to incorporate results of other analyses. The scale-bar corresponds to 0.1 changes per nucleotide. SOURCE: N.R. Pace, "A Molecular View of Microbial Diversity and the Biosphere," Science 276:734-740, 1997.
computed tomography (CT) scans of patients, and of a breast with tumor in situ from a magnetic resonance (MR) scan, among other applications.
These studies illustrate how asking simple, basic research questions can lead an investigator down paths unanticipated at the initial stage. In this example, the investigation moved from synaptic changes in gravity sensors to technology transfer by NASA that will benefit the health of the nation.
2.3 TECHNOLOGIES THAT ENABLE NEW OBSERVATIONS
NASA's goal of smaller, faster, cheaper missions means achieving the most science for the dollar. Several ways in which this might be done are discussed below. The first example describes a new technology for ground-based astronomy that was developed with R&DA funds. Critics might question whether ground-based technologies are an appropriate product for NASA. In this case, NASA had a compelling interest in the science that the new technology enabled.
The second example is one of many cases in which R&DA investments in technology have led to a new class of instruments. Although x-ray telescopes using grazing optics have become the norm, we often forget that the underlying technology has evolved since Apollo.
The third example describes the development of new technologies for flight projects with R&DA funds as a way to control mission development costs. Only large flight projects have been able to afford the time or expense of developing new technologies as part of the project. Ironically, these large projects can least afford a delay in schedule when a technology is not ready, or the loss of a mission when a new technology fails. Even after new technologies have been proven in space, managers of the more costly flight projects may be reluctant to use them because their records of successful flights are short. Additional examples of enabling technologies are given in Box 2.3.
The lower cost of smaller, faster, cheaper missions encourages project managers to take greater risks with more capable, but often less proven, technologies that are intended to compensate, to some extent, for the lower mission caps. "Faster" characteristically means 3 years between flight approval and launch rather than the 7 years that had become the norm for large flight projects. Although some
|
Box 2.3 Other Examples of Technologies That Enable New Observations
|
technology development could be accomplished within the more generous development period and budget of a larger flight project, new technologies for a smaller, faster, cheaper mission must be brought to flight readiness through an R&DA program prior to initiation of the flight project. The more ambitious of these new technologies might even require validation on a technology demonstration mission prior to assignment on a science mission.12
1. Precision Doppler Measurements Reveal Evidence Of Planetary Mass Companions Associated With Other Stars.
If many of the hundreds of thousands of stars visible from Earth are like our Sun, what is the likelihood that any have planets orbiting them? If so, what kinds of planets might they be?
The motions of orbiting planets induce minute Doppler shifts in the emission spectra of solar-type stars. The technology needed to detect these very small Doppler shifts was, in part, a product of NASA's Innovative Research Program—an R&DA program that has been terminated. 13 Once available, astronomers quickly used the new technology to discover substellar planetary mass companions to eight solar-type stars. The rate of occurrence of planetary systems is a central issue of one of NASA's principal science themes.
2. The Evolution Of Grazing X-Ray Optics Has Been The Key Enabling Technology For X-Ray Astronomy.
The disciplines of x-ray astronomy, extreme-ultraviolet (EUV) astronomy, and gamma-ray astronomy would not have developed without the first discoveries of astronomical sources by instruments on suborbital flights funded by R&DA programs. In particular, the discovery of solar x rays motivated R&DA-funded research on the x-ray optics that produced the first images of a celestial x-ray source, the Sun. The Skylab x-ray telescope, the discovery of celestial x-ray sources, and the Einstein Observatory each gave x-ray optical technologies a substantial boost, but it was the continuing R&DA support that led to the maturation of the grazing x-ray optics used, for example, in the Advanced X-ray Astrophysics Facility (AXAF).14
3. The Descent Imager Spectral Radiometer Will Measure The Composition Of Saturn's Atmosphere.
The Planetary Instrument Definition and Development Program (PIDDP) has been an R&DA-funded incubator of instruments for planetary missions. PIDDP investigators develop proof-of-concept instruments or instrument components for use in future flight projects. For example, gas-sampling instruments on Venus atmospheric probes were known to become so badly clogged by materials from Venus's clouds that they could not accurately measure atmospheric composition. To avoid the problem on future missions, PIDDP investigators developed an instrument using optical technologies that measured radiative balance, cloud density, and atmospheric composition without drawing gas samples into the probe. A laboratory proof-of-concept demonstration of the technology led to the Descent Imager Spectral Radiometer (Figure 2.4) for the Huygens entry probe on NASA's Cassini mission launched in
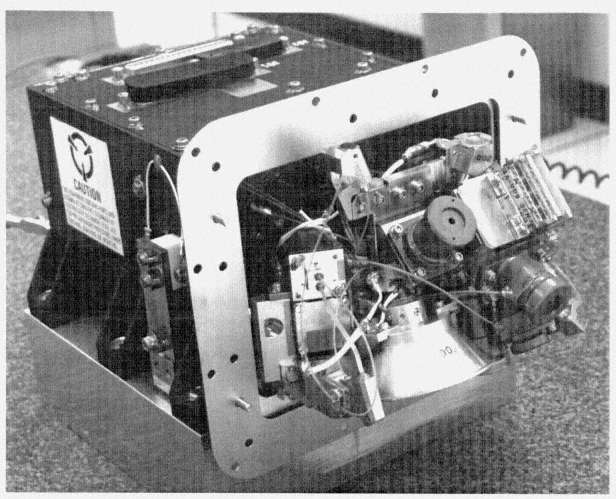
Figure 2.4 The Descent Imager Spectral Radiometer sensor head with front cover assembly removed to show the infrared upward- and downward-looking optics, the two-inch-diameter surface science lamp reflector, sun sensor optics, upward-looking visible spectrometer and violet detector optics, solar aureole camera, down-looking high-resolution imager optics (partially hidden by the reflector), down-looking medium-resolution imager optics, side-looking imager optics, and the various optical fibers throughout providing on-board calibration light. SOURCE: Courtesy of M.G. Tomasko, University of Arizona.
1997.15 The Huygens probe, developed by the European Space Agency (ESA), will enter the cloudy atmosphere of Saturn's moon Titan in 2004.
|
15 |
For additional information, see "Descent Imager/Spectral Radiometer Images and Spectra," prepared by M.G. Tomasko, University of Arizona, available on the European Space Agency's Huygens Probe home page at <http://www.estec.esa.n1/spdwww/huygens/html/disr.html>. Also see M.G. Tomasko, L.R. Doose, P.H. Smith, R.A. West, L.A. Soderblom, M. Combes, B. Bézard, A. Coustenis, C. deBergh, E. Lellouch, J. Rosenqvist, O. Saint-Pé, B. Schmitt, H.U. Keller, N. Thomas, and F. Gliem, "The Descent Imager/Spectral Radiometer (DISR) Aboard Huygens" pp. 109-138 in Huygens Science, Payload and Mission, SP-1177, European Space Agency, Noordwijk, The Netherlands, August 1997. Also see, M.G. Tomasko, L.R. Doose, P.H. Smith, C. Fellows, B. Rizk, C. See, M. Bushroe, E. McFarlane, E. Wegryn, E. Frans, R. Clark, M. Prout, and S. Clapp, "The Descent Imager/Spectral Radiometer (DISR) Instrument Aboard the Huygens Probe of Titan," reprinted from Cassini/Huygens: A Mission to the Saturnian Systems, Proceedings from the International Society for Optical Engineering, August 5-6, 1996, Denver, Colo., Vol. 2803, pp. 64-74. |
2.4 INFORMATION THAT IMPROVES MISSION DESIGN
Every flight project is the culmination of an investment in research on the ground. Effective missions could not be designed without this research funded by R&DA programs. Earth-based telescopic observations have helped in the selection of landing sites on the Moon and Mars and entry sites for atmospheric probes (Example 1); atmospheric models were essential in designing aeroshells and parachutes for the Pioneer Venus, Galileo, and Cassini-Huygens programs; cosmic dust collected on aerogel in the stratosphere by U2 aircraft earned the proposed Stardust comet flyby credibility as a comet-sampling mission; ground-based, airborne, and rocket-borne solar astronomy evolved to become the sophisticated Solar and Heliospheric Observatory (SOHO) mission; and modeling, theory, and field investigations of the microwave brightness of the oceans led to operational instruments, such as the Special Sensor Microwave/Imager (SSM/I), for estimating ocean-surface winds (Example 2). Other examples are given in Box 2.4.
1. Earth-Based Observations of Planets Are Used To Plan New Missions and Provide the Scientific Context For Data Returned By Probes.
Mission planners for a planetary probe must anticipate atmospheric and, for a lander, surface conditions that the spacecraft will encounter. Scientists who interpret data returned from the spacecraft also want to know how representative the landing or entry site is of the entire planet and whether the environmental conditions are subject to change. Investigations that provide the pre-mission estimates of expected conditions are funded by R&DA programs.
Infrared images and spectra have been crucial for inferring temperatures, pressures, and compositions to relatively great depths in the atmospheres of the jovian planets (Jupiter, Saturn, Uranus, and Neptune) and for monitoring martian surface conditions. Primary sources of these data have been the Hubble Space Telescope; the R&DA-supported Infrared Telescope Facility (IRTF) at Mauna Kea, Hawaii (Plate 2.4); and the R&DA-supported Kuiper Airborne Observatory. The Mars Pathfinder (Mars rover) mission and the highly successful Galileo probe, which performed the first in situ measurements of Jupiter's atmosphere, were absolutely dependent on R&DA-funded, ground-based observations for their mission designs and for placing flight data in a larger scientific context. 16
2. Satellite Measurements of Ocean-Surface Winds Improve Global Weather Forecasts.
Remote sensing science and the technologies that permit retrieval of ocean-surface winds from active and passive microwave data are largely products of R&DA programs. Ocean-surface winds are operationally assimilated in the ocean-atmosphere energy-and moisture-exchange models that are coupled with atmospheric models to predict weather. Before satellite data became available, the surface-wind measurements for the models were from scattered ships of opportunity and sparse networks of weather buoys. R&DA-funded research established the relationship between microwave brightness and ocean roughness and contributed to our understanding of the relationship between ocean roughness and wind speed. The combination of these two relationships translates microwave brightness into an estimate of wind speed. The reliability of the combined relationship was demonstrated with brightness data from NASA's Scanning Multichannel Microwave Radiometer (SMMR) on NOAA's Nimbus 7 satellite.
With a successful heritage from SMMR, the Defense Meteorological Satellite Program began including the SSM/I on its satellites in 1987. These represent the first generation of operational, global,
|
Box 2.4 Other Examples of Information That Improves Mission Design
|
ocean-surface-wind mappers. Global, near-daily image data from these satellites are routinely available through NOAA and the National Snow and Ice Data Center in Boulder, Colorado.
Initial attempts to use these surface-wind estimates in numerical weather-forecasting models were not successful because of inaccuracies in retrieved wind direction and in the relationship between surface winds and winds higher in the boundary layer. Further R&DA-funded research led to a more reliable wind-retrieval algorithm and to better modeling of surface and higher-level winds. Validation tests of the new retrieval algorithm showed rms (root-mean-square) accuracies better than 3 knots.17 The new algorithm was used to generate a 9-year, global, ocean-surface wind data set that has become a significant resource for climate research.
More recent R&DA-funded research contributed to development of the scatterometer-based retrieval of ocean-surface winds that is used operationally by NOAA to estimate surface winds from ERS-1 scatterometer data. It also led to the development of the NASA Scatterometer (NSCAT). 18 Aircraft validation of NSCAT data has shown as little as a 1-knot rms error in estimates of wind speed. NSCAT was a key instrument on the failed Advanced Earth Observing Satellite (ADEOS) mission. A follow on scatterometer, Seawinds, will fly on NASA's Quickscat mission and a second SeaWinds instrument will fly on ADEOS II.19
2.5 INVESTMENTS THAT INCREASE THE PRODUCTIVITY OF FLIGHT PROJECTS
Flight projects generally support a specific set of activities that are limited in time and scope. R&DA programs maximize the scientific return from flight projects through preparatory research prior to the initiation of flight projects, supporting research during missions, post-mission analyses after flight projects end, and synthesis research using data from more than one flight. Example 1 shows laboratory measurements funded by R&DA programs being used to extract information about planetary atmospheres from routine spacecraft radio signals. Examples 2 and 3 illustrate R&DA-funded research continuing to extract significant scientific results from space data long after the missions ended.
1. Laboratory Measurements of Microwave Absorption in Simulated Planetary Atmospheres Are Used To Recover Information About Planetary Atmospheres from the Signal Strengths and Frequency Distortion of Communications Signals from Spacecraft.
Nearly all planetary spacecraft transmit science and operations data to Earth by radio. As a spacecraft that is transmitting to Earth passes behind the limb of a planet or moon that has an atmosphere, the radio signal transits increasingly deeper paths in the atmosphere until it is lost by absorption and scattering in the atmosphere or blocked by liquids and solids that lie below the atmosphere. During periods when the signal transits the atmosphere, spectral components of the signal may be absorbed by atmospheric gases or distorted by Doppler shifts in frequency when scattered by gas molecules moving coherently (wind) or randomly (temperature). If the dielectric properties of the candidate atmospheric gases are known, radioabsorption data can be interpreted as vertical profiles of temperatures and gas abundances in the extraterrestrial atmosphere.
The relevant dielectric data for each of the candidate atmospheric gases must be measured in a laboratory under realistic atmospheric conditions. R&DA funds have been used to develop a simulation chamber and then to build the library of measurements. This ''radio science" approach to probing planetary atmospheres was used on the Voyager, Pioneer-Venus, Magellan, Galileo, and Mariner missions to derive profiles for the abundances of the atmospheric gases H2SO4, SO2, SO3, H2O, NH3, H2S, PH3, and CH4. These profiles are used to constrain models of chemical and dynamical processes that govern the atmospheric systems.20
2. Synthesis of Data from Sun-Earth Connection Explorer Missions Yields Key Discoveries After These Missions End.
The International Sun-Earth Explorer (ISEE) mission consisted of three spacecraft: ISEE-1 and 2, launched into the same highly elliptic Earth orbit in October 1977, were designed to observe the dynamic near-Earth space; ISEE-3, launched in August 1978, was stationed in front of Earth to observe the solar wind destined to strike Earth's magnetic field. Although the prime mission of the ISEE spacecraft spanned 3 years—from 1977 to 1980—the ISEE-1 and 2 spacecraft were operated for 7 more years as extended missions before they reentered Earth's upper atmosphere. During these extended missions, data analysis funds were available for studying all of the data collected by ISEE. Many of these analysis projects focused on data from the first several years of flight, leaving much of the later data unanalyzed. After the missions ended, grants to analyze ISEE data could be sought from the R&DA program and such grants are still being funded.
The prime mission, 1977-1980, was not the time of greatest ISEE-related scientific activity (Figures 2.5 and 2.6). The number of publications from the magnetospheric data peaked in 1984 (with a second, lower peak in 1993) and has decreased slowly since then (Figure 2.5). Although the prime and extended
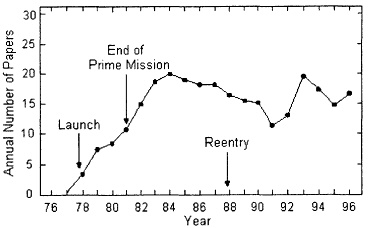
Figure 2.5 Papers in journals and books analyzing the International Sun-Earth Explorer magnetic field data. SOURCE: Courtesy of C.T. Russell, University of California, Los Angeles.
missions eventually spanned nearly an entire 11-year solar cycle, it was the extended mission that captured the disturbances at the height of the solar activity. In fact, some of the most significant results were obtained in the 1990s when coronal mass ejections were recognized as the origin of major "space weather" storms experienced in the vicinity of Earth. This discovery revolutionized the Sun-Earth connection approach to studying geomagnetic activity and its consequences and became the basis for National Space Weather Program forecasts about the effects of solar disturbances.
The ISEE record illustrates that mission-funded data analysis during an extended mission and R&DA-funded data analysis after the extended mission were essential in the continuing discovery of fundamental aspects of the behavior of the magnetospheric plasma.21 These grants maintained the community's access to the data and brought into the program students, postdoctoral researchers, and guest investigators with new ideas. The ISEE program repeatedly demonstrated that it is not always possible to recognize the ultimate importance of data as they are being collected. Many of the important scientific results were considered controversial when first presented because they defied conventional wisdom.22
3. Seasat Continues To Provide Excellent Examples of Synthetic Aperture Radar Images 20 Years After the "Failed" Mission.
SEASAT was launched into a polar Earth orbit on June 28, 1978. On October 10, 1978, the satellite suffered a massive short circuit in its electrical system and stopped functioning. The satellite carried four microwave sensors: (1) a radar altimeter, (2) a microwave scatterometer, (3) an L-band synthetic aperture radar (SAR), and the Scanning Multichannel Microwave Radiometer. SEASAT objectives were to collect data on sea-surface winds and temperatures, wave heights, internal waves, atmospheric water vapor, sea-ice features, and ocean topography.
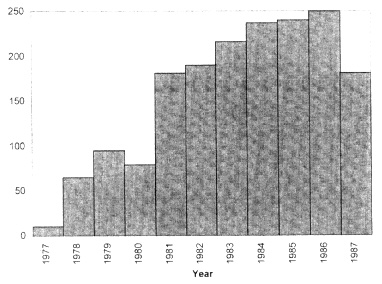
Figure 2.6 Number of International Sun-Earth Explorer published papers, 1977-1987.
Source: Adapted from data provided by K. Olgilvie, NASA Goddard Space Flight Center.
Despite the brevity of SEASAT's 100-day lifetime, SEASAT data have been employed by various R&DA programs over the past 20 years with impressive results. The topographic data were processed to make the world's first gravity map of seafloor features based on satellite altimetry. Although the map had low resolution, it did show trenches, midoceanic ridges, fracture zones, and other tectonic features, and it served the community for a decade until measurements from ESA's ERS-1 were made public in 1995 and the Navy declassified Geosat data.
Although the sensors were designed for measurements over water, the SEASAT radar altimeter acquired more than 600,000 useful altimeter range measurements over the continental ice sheets of Greenland and Antarctica.23 These data now serve as an important baseline for temporal comparisons with data from current sensors such as NSCAT. There has been nearly complete SEASAT SAR coverage of the continental United States, and these data continue to provide a base map for detecting geologic structure and changes in land cover (Figure 2.7).
SEASAT data were used widely to familiarize the planetary science community with the strengths and weaknesses of photographic interpretation of geologic features with SAR data in anticipation of the Magellan images of Venus. SEASAT data allowed planetary geologists to become familiar with radar image distortion and the competing effects on radar backscatter of roughness, dielectric contrast, incidence angle, and subsurface scattering. Even after the Magellan data were in hand, comparisons with SEASAT data continued to be used in analyses.
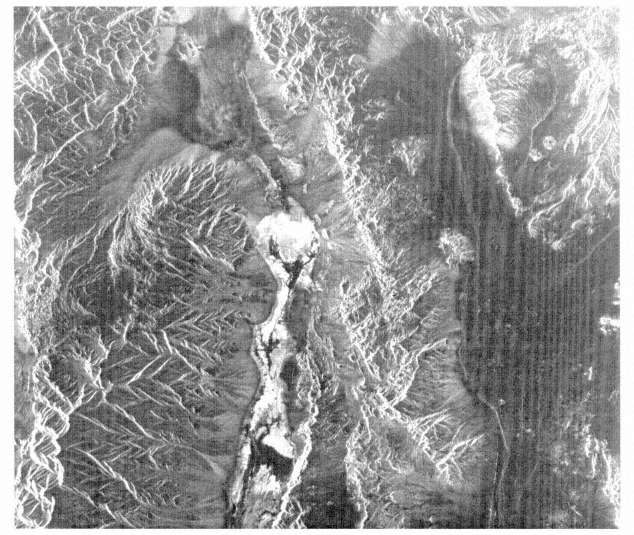
Figure 2.7 Image of the Death Valley, California, region acquired on September 14, 1978, by the SEASAT synthetic aperture radar (SAR). West is at the top of the scene, which is dominated by the mountains of the Panamint Range. Alluvial fans flow eastward from the mountains into the valley. The valley floor is characterized by very rough salt deposits that appear bright, and smooth playas appearing dark. The valley is bordered on the east by the Amargosa Range. The flat area east of the Amargosa Range is the Amargosa Desert. The Amargosa River and the low mountain ranges of western Nevada are in the bottom portion of the image. Source: Courtesy of the Jet Propulsion Laboratory Radar Data Center.
Interferometric synthetic aperture radar, a new technology for performing high-resolution topographic mapping, has stimulated recent interest in the SEASAT SAR data. Retrospective use of these data provides some of the best examples available on which scientists can test results of interferometric processing algorithms. The continuing exploitation of SEASAT's data set for planetary, oceanographic, and land-surface research is a testament to the importance of R&DA funds for continued data analysis in select cases where the data are unique.
2.6 RESEARCH THAT COMPLEMENTS THE WORK OF OTHER FEDERAL AGENCIES
The interests of NASA and other federal agencies often appear to overlap in the areas of space science, but because of the different focus and expertise of various agencies, the efforts are in fact complementary. Complementarity is further ensured by external advisory committees that span the interests of both agencies. In instances where the divisions of effort are not clear, agencies often coordinate their efforts with joint research announcements. Recent examples include programs jointly funded by NASA and NSF for studies of the Shoemaker-Levy 9 comet and its impact on Jupiter, and studies of the ALH84001 meteorite from NSF's antarctic collection and of great importance to NASA's Mars exploration program. Other examples of complementarity and cooperation can be found in joint efforts with the National Institutes of Health (NIH) in space medicine, with NOAA in terrestrial and space weather, with the Environmental Protection Agency (EPA) in ecosystem studies, and with the Department of Defense in weather and oceanic studies. Yet another example of collaborative efforts is described briefly in Box 2.5.
1. Cooperation Between the National Institute of Standards and Technology (Nist) and Nasa May Lead To Improved Manufacturing Processes For Metals.
Dendrites are tiny crystalline structures that form inside molten metals and metal alloys when they freeze. Nearly all industrially important metals solidify dendritically from the molten state. An understanding of how these dendrites form can lead to improvement in alloy strength and ductility and/or to a reduction in production costs.
The morphology and growth kinetics of dendrites are sensitive to gravity-driven convective flows in melts. The R&DA program for microgravity research has been supporting comprehensive experimental investigations of dendritic growth in the absence of gravity. For example, an investigation that began at the Naval Research Laboratory evolved into shuttle-based experiments by a team of researchers from Rensselaer Polytechnic Institute to test the generally accepted, approximate Ivantsov model's prediction that the shapes of dendrite tips were paraboloids of revolution. Results from the space-based experiments are in conflict with the prediction and invite a reexamination of the underlying physical processes.24 The academic investigators are working with theoreticians at NIST to develop a dendrite-growth model that is consistent with the new data.25
2. the U.S. Department of Agriculture's (Usda's) Space-Based Crop-Monitoring Programs Began with Nasa Collaboration.
After launch in the early 1970s of the first of the series of multispectral scanners on Sun-synchronous satellites that was to become the Landsat program, NASA and the USDA began collaborative research that used data from these sensors to estimate crop yield and crop condition. Through their joint efforts, the technology evolved that enabled USDA's current operational programs to, for example, monitor rice, cotton, and soybeans in the Mississippi Delta, corn in the Midwest, and
|
Box 2.5 Another Example of Research That Complements the Work of Other Federal Agencies NASA joins the NSF, NOAA, and DOE in the U.S. Global Change Research Program through participation in projects such as the Global Energy and Water Cycle Experiment (GEWEX).1 To date, most of NASA's participation has been through R&DA-funded field experiments and the development of the tools of remote sensing science. Eventually, these R&DA investments will enable regional and global investigations of Earth's climate systems.
|
wheat on the Prairie. The USDA's Foreign Agricultural Service, whose concern is the world productivity of economically important crops, has become the largest user of Landsat data. Its Landsat-based analyses are used by Congress, agribusiness, the State Department, the Agency for International Development, and the United Nations.
Collaboration between the USDA and NASA was initiated with several programs: first the Large Area Crop Inventory Experiment (LACIE) and then the Agriculture and Resources Inventory Surveys Through Aerospace Remote Sensing (AgRISTARS). The technologies for land-cover classification developed under LACIE were the foundation for the operational USDA program. Crop-yield and crop-condition estimation was developed under AgRISTARS.26
2.7 SCIENCE-DRIVEN ADVENTURE THAT STIMULATES INTEREST IN MATH, SCIENCE, OR ENGINEERING EDUCATION
As Example 1 on Mars meteorites in Section 2.2 suggests, small R&DA grants can attract broad (even worldwide) public attention, much like the attention given major flight projects. Normally, these grants represent a quiet activity that nevertheless serves as the primary link between NASA and academic research in most universities most of the time. Opportunities for participation in flight projects are more rare and highly competitive.
R&DA grants provide the support base for NASA-funded academic research, the primary means for training graduate students in space-related disciplines, and opportunities for exposing undergraduates to aerospace science and engineering. R&DA-funded suborbital programs (i.e., balloon, aircraft, and sounding rocket investigations) offer students and young investigators training opportunities that prepare them for greater responsibilities on later spaceflight projects. The relatively low cost and rapid turnaround of suborbital flights are better suited to doctoral research than are most spaceflight projects in which predoctoral students are unlikely to be given significant responsibilities and project duration often exceeds student Ph.D. tenures. Furthermore, the potentially high frequency of suborbital flights permits the young investigator to build a record of successful experiments.
In addition to the educational function of R&DA grants to academia, NASA sponsors a series of outreach opportunities that use the dramatic nature of space-related research to stimulate the interest of students in kindergarten through college in science and math. The frequent links to academic research are illustrated in three examples.
1. the Nasa Space Grant College and Fellowship Program Exposes K-16 Students To Space Science and Technology.
The NASA Space Grant College and Fellowship Program, established in 1989, administers awards to state-based consortia in three areas: research, education, and public service.27 The NASA contribution is approximately doubled through matching funds from consortia members. The funds are used to build stronger educational elements where research in space science and technology exists and to introduce space science and technology where they have not been established.
For example, Space Grant funds for the South Dakota Space Grant Consortium have been used largely for educational outreach for K-12 programs. 28 Highlights of the Space Grant Consortium's educational components include the following:
-
University student design, development, and launch of scientific payloads on high-altitude balloons and analysis of data from these flights;
-
South Dakota Space Day, which attracted more than 5,000 K-12 students from across the state; · A summer aerospace workshop for K-12 teachers;
-
Student scholarships in science, which have expanded the educational opportunities for under-represented groups including women, American Indians, and African Americans; and
-
Summer fellowship awards, which have allowed faculty to focus on space-related science each summer.
This has been accomplished with a NASA annual commitment of less than $200,000.
2. Nasa's Minority University Research and Education Division (Mured) Works with Historically Black Colleges and Universities and Other Minority Universities To Expand Contributions To Nasa's Science and Technology Base.
NASA outreach to these minority institutions increases diversity among science and engineering students and encourages early involvement of minority faculty in NASA-related research. These MURED grants are competitively selected, peer-reviewed R&DA-type awards.
The first MURED program created university research centers (URCs) at minority institutions in 1991.29 Each URC, although established by NASA Headquarters, is managed by a designated NASA field center. The URCs are intended to increase the competitive capabilities among minority colleges and universities in aerospace research, expand the nation's pool of aerospace research and development institutions, increase minority institutions' faculty and student involvement in research, and increase the number of students from underrepresented groups with advanced degrees in NASA-related disciplines.30
University Research Centers at minority institutions include the following:
-
Alabama A&M University (Center for Hydrology, Soil Climatology and Remote Sensing),
|
27 |
For a brief description of this program, see "A Guide to NASA Education Programs" available on NASA's Education Resources home page at <http://www.hq.nasa.gov/office/codef/education/html.index>. |
|
28 |
For additional information, see the South Dakota Space Grant Consortium home page at <http://www.sdsmt.edu/space/space.html>. |
|
29 |
For additional information, see NASA's Minority University Research and Education Division's University Research Centers at Minority Institution's home page at <http://mured.alliedtech.com/pub/www/awards/urc>. |
|
30 |
For more information, see <http://www.hq.nasa.gov/office/codee/mured.html> on the World Wide Web. |
-
Clark Atlanta University (High Performance Polymers and Composites Center),
-
Fisk University (Center for Photonic Materials and Devices),
-
Florida A&M University (Center for Nonlinear and Nonequilibrium Aeroscience),
-
Hampton University (Center for Optical Physics),
-
Howard University (Center for the Study of Terrestrial and Extraterrestrial Atmospheres),
-
Morehouse School of Medicine (Space Medicine and Life Sciences Research Center),
-
North Carolina A&T State University (Center for Aerospace Research),
-
Prairie View A&M University (Center for Applied Radiation Research),
-
Tennessee State University (Center for Automated Space Science),
-
Tuskegee University (Center for Food and Environmental Systems for Human Exploration of Space),
-
University of New Mexico (Center for Autonomous Control Engineering),
-
University of Puerto Rico at Mayagüez (Tropical Center for Earth and Space Studies), and
-
University of Texas at El Paso (Center for Earth and Environmental Studies).
URCs received $4.1 million in FY 1996 and $2.1 million in FY 1997.
3. the Global Learning and Observations To Benefit the Environment (Globe) Program Brings the Experiences of Environmental Research To the K-12 Classroom.
NASA, NOAA, and NSF have teamed up to create an international program, GLOBE, that will encourage environmental scientists and teachers to share the experience of discovery with K-12 students. GLOBE projects are intended to increase the following:
-
Students' scientific understanding of Earth,
-
Their achievements in science and mathematics, and
-
Their environmental awareness.
GLOBE currently enlists students in 1,500 schools to make environmental observations following established research protocols. These students report their data via the Internet/World Wide Web to the GLOBE Student Data Archive where the data are publicly available. An additional 2,000 schools have committed to follow these same protocols and begin similar observations.
GLOBE offers training and online information for teachers who wish to participate in the program. It also maintains an online forum where students from all over the world can discuss environmental observations and issues.31
2.8 SUMMARY COMMENTS
These notable examples of the contributions of the R&DA programs help explain why the programs are important to the nation, to science, to the advancement of technology, and to education. Recognizing the difficulty in communicating the value of R&DA to those both inside and outside NASA, the task group chose what it considered to be successful examples of R&DA. It believes that this is one of the first summaries of the accomplishments of NASA's R&DA programs.
|
31 |
For further reading, see "GLOBE: A Worldwide Environmental Science and Education Partnership," Journal of Science Education and Technology, Vol. 7, No. 1, 1998; information is also available on the GLOBE Web site at <http://www.globe.gov>. |


