
CHAPTER THREE
What Does TIMSS Say about the Mathematics and Science Curriculum?
Many factors determine what a student learns in school, but TIMSS clearly demonstrated that one important factor is the curriculum to which students are exposed. For example, each nation performed more and less well in particular areas of mathematics and science emphasized in that country. U.S. 13 year olds scored second among TIMSS countries in the area of ''life cycle and genetics''—topics that tend to be highlighted in middle school and junior high school curricula. But they scored near the bottom of TIMSS countries in the area of "physical changes," reflecting the lower emphasis in U.S. curricula on the physical sciences (Schmidt and McKnight, 1998; Schmidt et al., 1999, p. 124).
The TIMSS framework defines "curriculum" very broadly. TIMSS considered the "intended" curriculum set forth in guidelines and by texts, the "implemented" curriculum actually delivered by a teacher, and the "achieved"
curriculum measured by the results of assessments (Beaton et al., 1996a, p. A-1). This chapter takes a more restricted view of curriculum, focusing largely on the content that is taught and the organization of that content.
The content specified by a curriculum forms one of many sets of expectations that affect student learning. These expectations come from many different sources. Official documents such as curriculum guides and standardized tests specify knowledge and skills for students to master. Teachers expect certain levels of student performance and use formal and informal assessments to determine if those levels have been achieved. Parents, peers, and the broader culture exert important influences on student behaviors.
Educational standards at the national, state, and local levels also establish sets of expectations for student learning in mathematics and science. National standards and benchmarks in mathematics and science (National Council of Teachers of Mathematics, 1989, 1998; American Association for the Advancement of Science, 1993; National Research Council, 1996) outline in broad terms what students should know, understand, and be able to do in each subject. State and local standards vary widely in specificity, format, and links to assessments, but they, too, create frameworks of expectations for students to meet.
Most standards documents emphasize the need for all students to achieve high levels of mathematics and science literacy, yet different groups of students often are subject to different sets of expectations. Sometimes these expectations are set deliberately, as when a student takes an advanced placement course or undergoes some form of educational tracking. Other differentiated expectations may be more subtle or even inadvertent but can still have a major influence on students. For example, community norms might be different for boys than for girls, or low-performing students might be put in classes or student groupings where only lowlevel skills are expected.
In considering how a curriculum in mathematics or science is related to student learning, it is critically important to think explicitly about the expectations embodied in that curriculum. To what extent are expectations embodied in instructional materials, in course requirements, or in tests and grades? How are expectations conveyed to students, and do those messages conflict with others that students receive inside or outside school? Are students provided with the means necessary to achieve the demands made of them?
This chapter begins by examining how much time students spend studying mathematics and science, the subjects introduced at different grade levels, and the curricular tracks into which students are divided. The remainder of the chapter investigates the structure of mathematics and science curricula along two related dimensions: focus and coherence.
At the beginning of each of the major sections of this and the following two chapters are questions like the ones in the accompanying box. These questions suggest ways for teachers, administrators, policymakers, parents, textbook writers, curriculum developers, and others to examine local aspects of schooling in light of the results from TIMSS.
|
QUESTIONS RELATED TO CURRICULAR EXPECTATIONS
|
TIME AND TRACKING
Perhaps the most general characteristic of mathematics and science curricula is the amount of time given to these subjects in schools. Despite a widespread belief that students in other countries spend more time studying mathematics and science than do U.S. students, the results from TIMSS indicate otherwise—at least in elementary school and early secondary school. According to the questionnaires distributed as part of TIMSS, time spent on mathematics and science instruction is higher for populations 1 and 2 in U.S. classrooms than in many other TIMSS countries (U.S. Department of Education, 1996, p. 39; 1997b, p. 40). U.S. fourth graders, for example, spend more time in class each week studying mathematics and science than do their average international counterparts (Figure 3-1). U.S. eighth graders spend more hours per year in mathematics classes than do students in Japan and Germany (Figure 3-2), even though the U.S. school year is only about 180 days, compared with 188 days in Germany and 220 in Japan.
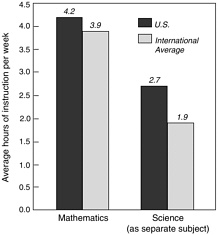
Figure 3-1 Reports from the upper grade of population 1 teachers on the average number of hours of mathematics and science instruction per week.
Source: U.S. Department of Education, 1997b, p. 40.
The amount of time devoted to mathematics and science in populations 1 and 2 varies somewhat from student to student in the
|
QUESTIONS RELATED TO TIME AND TRACKING
|
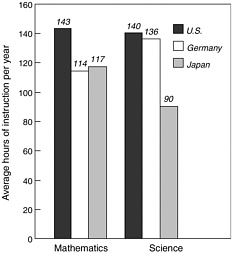
Figure 3-2 Number of hours of mathematics and science instruction per year for eighth graders.
Source: U.S. Department of Education, 1996, p. 39.
United States, partly because of tracking designed to address differing abilities (Schmidt et al., 1999, pp. 57–59). However, the greater impact of tracking appears to be on the content and skills to which different groups of school children are exposed, not on the total amount of time spent on the subjects (Schmidt et al., 1999, p. 24).
In the final year of secondary school, exposure to mathematics and science among U.S. students is more variable. While 66 percent of graduating students in the United States were currently taking mathematics, the average in all the countries participating in the general assessment of mathematics and science knowledge was 79 percent. In science, 53 percent of U.S. students were taking a science course, compared with 67 percent for all TIMSS countries. In fact, the United States is unique in the high percentage of students taking either no or only one science course (93 percent) in their final year of secondary school (Mullis et al., 1998, p. 89). It should be noted, however, that Norway, which has an even greater percentage of students taking no science course in their final year, scored well above the international average in the population 3 science literacy test.
Among the TIMSS countries, mathematics curricula tend to be more similar than science curricula. Most countries roughly agree on the progression of topics to introduce at different grades, even when they do not place the topics
TABLE 3-1 Mathematics Topics Intended for Introduction at Various Grades
|
Grade Group |
Topics that Half the Countries Intended for Introduction in Grade Group |
|
|
1 through 3 |
Whole number: meaning |
Measurements: units |
|
|
Whole number: operations |
Measurement: perimeter, area, and volume |
|
|
Whole number: properties of operations |
2-D geometry: basics |
|
|
Common fractions |
2-D geometry: polygons and circles |
|
|
Estimating quantity and size |
Data representations and analysis |
|
4 through 6 |
Decimal fractions |
2-D geometry: coordinate geometry |
|
|
Relationships of common and decimal fractions |
3-D geometry |
|
|
Percentages |
Geometry: transformations |
|
|
Properties of common and decimal fractions |
Constructions using straightedge and compass |
|
|
Negative numbers, integers and their properties |
Proportionality concepts |
|
|
Number theory |
Proportionality problems |
|
|
Rounding and significant figures |
Equations and formulas |
|
7 and 8 |
Rational numbers and their properties |
Measurement: estimation and errors |
|
|
Real numbers, their subsets, and their properties |
Geometry: congruence and similarity |
|
|
Exponents, roots, and radicals |
Proportionality: slope and trigonometry |
|
|
Exponents and orders of magnitude |
Patterns, relations, and functions |
|
9 through 12 |
Complex numbers and their properties |
Infinite processesy |
|
|
Counting (permutations and combinations) |
Change |
|
|
Vectors |
Validation and justification |
|
|
Uncertainty and probability |
Structuring and abstracting |
|
Source: Schmidt et al., 1997a, p. 66. |
||
in exactly the same grade or treat them the same way (Table 3-1). In addition, almost all countries introduce many more mathematics topics in the earlier grades than in later grades (Schmidt et al., 1997a, p. 66).
In U.S. high schools, certain topics in mathematics traditionally have been reserved for specific grades. Though integrated mathematics courses have become more common, in many schools algebra often is still reserved for grades 9 and 11 and geometry for grade 10. In contrast, a common pattern in European countries and Japan is to combine algebra and geometry in a single class and to introduce them at an earlier age.
Curricular approaches to science are more varied than for mathematics. For example, many countries teach little or no formal science until grade three or later (Schmidt et al., 1997b, pp. 82–86). These include Argentina, Belgium (Flemish and French), Bulgaria, China, the Czech Republic, Hungary, Japan, the Netherlands, the Philippines, Romania, Singapore, and Spain.
Beginning in lower secondary school, about 60 percent of the countries require that students take more than one science course simultaneously (Schmidt et al., 1997b, pp. 36–38). For example, in the Russian Federation, students have separate courses in biology and earth
science in lower secondary school, to which are added courses in physics and chemistry in upper secondary school.
The average numbers of topics introduced in science remain roughly comparable across grade levels (Table 3-2). However, the U.S. science curriculum contrasts with that of many other countries by eliminating rather than adding topics in each grade of upper secondary school (Schmidt et al., 1997b, pp. 82–85). In fact, the majority of countries intend that more topics be covered per year in the upper-secondary grades than does the United States. This probably results from the "layer cake" approach to the U.S. science curriculum, where students focus on just a single disciplinary area each year.
Countries also vary with respect to the different curriculum streams through which science courses are offered (Schmidt et al., 1997b, p. 32). There is only one stream in Japan (though there is tracking with respect to the rigor of the curriculum in upper secondary school). In the Netherlands, in contrast, there are four streams (some of which are considered harder than others), though all four require combined physics and chemistry, biology, and geography and earth science in grades 9 through 11.
The order of the topics introduced in science and mathematics does not reveal the depth or rigor with which those subjects are taught. However, many U.S. mathematics and science classes appear to cover topics at a more elementary level than is the case in other countries. For example, in the videotapes made of 231 eighth-grade classes in the United States, Germany, and Japan, the content of each lesson was compared to the average grade level across all TIMSS countries in which particular topics received the most attention. By this measure, the mathematics content of U.S. lessons was, on average, at a mid-seventh-grade level, whereas German and Japanese lessons were at the high eighth-grade and beginning ninth-grade levels, respectively (Stigler et al., 1999, p. 43–44). At least in eighth-grade mathematics—and quite likely in science and at other grade levels as well—U.S. instruction is not at the world-class level established as a goal by national, state, and local standards in mathematics and science.
One interesting aspect of the TIMSS data is that they do not reveal any obvious advantages to having a nationally set curriculum—at least not in mathematics, where the data from TIMSS are more plentiful. For example, when countries are sorted by whether control over the curriculum is focused on national, regional, or local authorities, no obvious performance patterns emerge in mathematics. Countries with centralized curricula appear at both the top and bottom of the list. The results of TIMSS therefore do not indicate whether adopting a national curriculum will or will not improve student achievement.
Focus and Coherence
The TIMSS data have been used to support a wide variety of observations about U.S. mathematics and science curricula—for example, that these curricula are "a mile wide and an inch deep" or that mathematics and science curricula suffer from a "splintered vision." A particularly useful way to assess the validity of these observations is to analyze the
TABLE 3-2 Science Topics Intended for Introduction at Different Grade Levels
|
Grade Group |
Topics That Half the Countries Intended for Introduction |
|
|
1 through 3 |
||
|
|
Bodies of water |
Reproduction of organisms |
|
|
Weather and climate |
Animal behavior |
|
|
Plants and fungi |
Nutrition |
|
|
Animals |
Disease |
|
|
Organs and tissues |
Physical properties of matter |
|
|
Life cycles of organisms |
Conservation of land, water, and sea resources |
|
4 through 6 |
||
|
|
Composition |
Interdependence of life |
|
|
Landforms |
Classification of matter |
|
|
Atmosphere |
Energy types, sources and conversions |
|
|
Rock and soil |
Heat and temperature |
|
|
Physical cycles |
Sound and vibration |
|
|
Building and breaking |
Light |
|
|
Earth's history |
Electricity |
|
|
Earth and the solar system |
Magnetism |
|
|
Other organisms |
Physical changes |
|
|
Cells |
Time, space, and motion |
|
|
Energy handling |
Pollution |
|
|
Biomes and ecosystems |
Conservation of material and energy resources |
|
|
Habitats and niches |
Effects of natural disasters |
|
7 and 8 |
||
|
|
Ice forms |
Chemical changes |
|
|
Beyond the solar system |
Types of forces |
|
|
Sensing and responding |
Dynamics of motion |
|
|
Variation and inheritances in organisms |
Nature or conceptions of technology |
|
|
Evolution, speciation, and diversity |
Applications of science in mathematics and technology |
|
|
Chemical properties of matter |
|
|
|
Atoms, ions, and molecules |
History of science and technology |
|
|
Subatomic particles |
World population |
|
|
Explanations of physical changes |
Food production and storage |
|
|
|
Nature of scientific knowledge |
|
9 through 12 |
||
|
|
Evolution of the universe |
Organic and biochemical changes |
|
|
Biochemical processes in cells |
Nuclear chemistry |
|
|
Biochemistry of genetics |
Electrochemistry |
|
|
Macromolecules and crystals |
Relativity theory |
|
|
Wave phenomena |
Fluid behavior |
|
|
Kinetic theory |
Influence of mathematics and technology in science |
|
|
Quantum theory and fundamental particles |
Influence of science and technology on society |
|
|
Explanations of chemical changes |
Influence of society on science and technology |
|
|
Rate of chemical change and equilibrium |
Science and mathematics |
|
|
Energy and chemical change |
|
|
Source: Schmidt et al., 1997b, pp. 69–70. |
||
|
QUESTIONS RELATED TO CURRICULAR FOCUS AND COHERENCE
|
structure of the curriculum along two interrelated dimensions: focus and coherence.
Focus
Focus in a curriculum measures the attention given to single topics either within single class sessions or across class sessions. (For a discussion of how topics were defined in TIMSS, see Schmidt et al., 1997c, pp. 127–130.) For example, in the draft Principles and Standards for School Mathematics developed by the National Council of Teachers of Mathematics (1998), the standards in each grade band are organized into discrete focus areas, such as "understanding the meaning of operations and how they relate to each other" under the number and operations standard, or "expressing mathematical ideas coherently and clearly to peers, teachers, and others" in the communication standard. The Benchmarks for Science Literacy produced by Project 2061 of the American Association for the Advancement of Science (1993) are organized into broad themes that emphasize "the common core of learning that contributes to the science literacy of all students." Similarly, the National Science Education Standards (National Research Council, 1996) are organized into particular topics within content categories and grade bands, such as ''position and movement of objects" within the physical science standard, or "science as a human endeavor'' within the history and nature of science standard.
A strong impression conveyed by the TIMSS data is that other countries teach fewer content areas in any given year than does the United States (Schmidt et al., 1997c, pp. 1–11). At the same time, other countries appear to teach these subjects with greater depth and, as students progress through school, with greater rigor.
In the United States, in contrast, students cover more topics, but they seem to do so quickly and with a lack of higher levels of understanding. The potential disadvantage of teaching mathematics and science this way is the concept conveyed by the statement "more is less;" implying that students exposed to a large number of disconnected topics tend to learn less overall than if the curriculum were more focused.
TIMSS offers several lines of evidence that point toward less focus in U.S. mathematics and science instruction compared to other countries. One involves the number of topics covered in U.S. mathematics and science textbooks. For populations 1 and 2, mathematics textbooks average 30 to 35 topics, compared with a median of 25 or fewer in other TIMSS countries (Figure 3-3). U.S. science textbooks contain even more topics—between 50 and 70 at the three student groupings studied in TIMSS, compared with an international median of between 20 and 30 (Figure 3-4). In fact, the number of topics in population 3 science and mathematics textbooks remains high despite the disciplinary orientation of curricula in high school.
The reasons for the large number of topics in mathematics and science textbooks differ somewhat between the two subjects. In science the number stems in part from the fact that there is no accepted sequence for the U.S. curriculum. State curriculum guides have relatively limited overlap, which causes publishers—trying to gain maximum market share—to include many more topics in their textbooks than can be covered, much less learned.
In U.S. mathematics, on the other hand, there is a steady addition of topics according to well-accepted curriculum sequences, but—unlike elsewhere—few of the earlier topics are eliminated in later grades. This steady accumulation of topics is related to the emphasis on repetition and review in U.S. mathematics classes. U.S. textbooks tend to include many more review exercises and repeat more topics covered in earlier grades. Yet these texts offer little guidance on how or why to choose or eliminate topics, reflecting the absence of shared goals for mathematics learning (Schmidt et al., 1999, pp. 194–195).
Another measure of focus in textbooks involves the distribution of attention given to topics. Analyses of representative textbooks
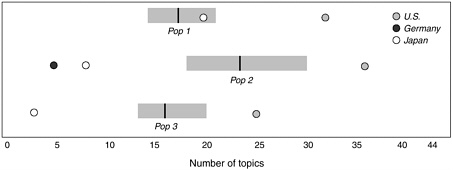
Figure 3-3 Number of topics in mathematics textbooks. The gray bars extend from the 25th percentile to the 75th percentile for the number of topics among countries studied in the TIMSS curriculum analysis. The black line within each gray bar indicates the median number of topics for each population. German textbook data were not available for populations 1 and 3.
Source: Schmidt et al., 1997c, p. 55.
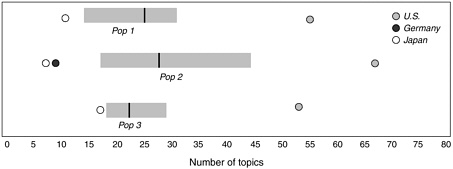
Figure 3-4 Number of topics in science textbooks. The gray bars extend from the 25th percentile to the 75th percentile for the number of topics among countries studied in the TIMSS curriculum analysis. The black line within each gray bar indicates the median number of topics for each population. German textbook data were not available for populations 1 and 3.
Source: Schmidt et al., 1997c, p. 55.
found that the five topics emphasized most heavily in U.S. fourth-grade science textbooks accounted for just over 25 percent of the total material covered. In Japan the five most heavily emphasized topics accounted for 70 to 75 percent of the material (Figure 3-5).
The single-area textbooks commonly used in U.S. secondary schools would seem to offer greater focus. Here, too, however, the most emphasized five topics took up about 50 percent of the content, compared with an international average of 60 percent (Schmidt et al., 1997c, p. 61).
The number and organization of topics within textbooks are not necessarily related to the number of topics taught in a particular lesson or over the course of a year. Teachers can select topics from textbooks, or they can select textbooks that are more focused (the TIMSS curriculum analysis looked at the broad range of textbooks available in different countries without trying to calculate their popularity or market share). The composite curriculum represented in textbooks may appear to be unfocused without implying that a given student's curriculum is unfocused.
However, other data collected during TIMSS similarly point toward a comparatively superficial treatment of a large number of topics in U.S. mathematics and science classrooms. For example, when eighth-grade U.S. mathematics and science teachers were asked in questionnaires to identify which topics they taught over the course of a year, far more reported teaching a large number of topics than was the case in Japan or Germany (Schmidt et al., 1997c, pp. 69–72). They also reported devoting less than half their time to the five most highly covered topics, indicating that teachers' instructional time is as inclusive and unfocused as the structure of typical U.S. textbooks.
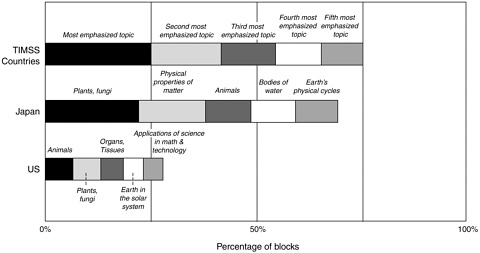
Figure 3-5 The five topics emphasized most in population 1 science textbooks.
Source: Schmidt et al., 1997c, p. 58.
Coherence
Closely related to the number of topics in mathematics and science classes is the relationship of topics to each other within and across classes—a quality referred to in this report by the term "coherence." Coherence is a measure of the connectedness of the mathematics and science ideas and skills presented to students over an extended period of time. A coherent curriculum can be thought of as a smoothly developing story in science and mathematics. In a coherent curriculum, new or more complex ideas and skills build on previous learning, applications are used to reinforce prior learning, and extensive repetition is avoided.
The national standards in both mathematics and science emphasize the need for coherence. In the draft Principles and Standards for School Mathematics (National Council of Teachers of Mathematics, 1998), the same standards and focus areas extend across all grades, from pre-kindergarten through twelfth grade, providing a potential coherence across a student's schooling. The broad content standards of the National Science Education Standards (National Research Council, 1996) and Benchmarks for Science Literacy (American Association for the Advancement of Science, 1993) also extend across all grades, allowing teachers at each level to build on previously learned knowledge and skills.
Furthermore, both sets of standards emphasize the need for coherence between the two disciplines. The science standards list as one of the program standards that: "The science program should be coordinated with the mathematics program to enhance student use and understanding of mathematics in the study of science and to improve student understanding of mathematics" (National Research Council, 1996, p. 214). The draft mathematics
standards state, "Of all disciplines, science probably has the most obvious connections with mathematics. The link between mathematics and science is not only through content, but also through process. The processes and content of science can inspire an approach to solving problems that applies to the study of mathematics" (National Council of Teachers of Mathematics, 1998, p. 93).
Several observations made by TIMSS demonstrate serious threats to coherence in U.S. mathematics and science curricula. First, the organization of topics within texts suggests that they are not well connected (though it does not prove that they are not well connected). Consider, for example, a schematic portrait of a Japanese versus a U.S. mathematics textbook (Figure 3-6). In the Japanese textbook, eight topics are organized into long sequences. The U.S. textbook has many more topics widely scattered across class sessions.
The videotapes of eighth-grade mathematics also point to a lack of coherence in U.S. lessons (Stigler et al., 1999, pp. 46–47). The videotape studies showed that U.S. lessons contained significantly more topics than did Japanese lessons and that U.S. teachers made significantly more switches from topic to topic than did German or Japanese teachers (Figure 3-7).
One way to help students perceive the coherence of ideas is explicitly to point out the connections among them. In the video study of eighth-grade mathematics, a number of lessons (15 from geometry and 15 from algebra) were randomly chosen from each country and all of the verbal statements made by the teachers were coded. Those lessons that contained at least one concrete statement that connected the current idea to ideas or events in another part of the lesson or to ideas in another lesson were identified. The majority of teachers in all countries made explicit links from one lesson to another. Only about 40 percent of German and U.S. teachers made links between parts of a lesson, compared with 96 percent of Japanese teachers (Stigler et al., 1999, pp. 117–118).
Some judgments about coherence, such as the flow of mathematical connections, require a good deal of sophistication about teaching mathematics. The videotape study of TIMSS therefore had a group of four university mathematics teachers (the Math Group) analyze a sample of the videotaped lessons. The Math Group worked from written descriptions of the lessons, with references to specific countries disguised, so that they did not know the origin of a particular lesson.
Using the same 15 geometry and 15 algebra lessons from each country used for coding the teachers' verbal behavior, the Math Group devised a means of systematically describing the mathematical content of each lesson along dimensions they thought were relevant for student learning. (This method is described in detail in Stigler et al., 1999, pp. 58–61.) The group isolated the lesson segments, the connections among those segments, and the kinds of relationships that characterized the connections. They then measured the coherence of lessons by determining which segments were connected through at least one appropriate mathematical relationship, such as one segment was helpful for the next or two segments were similar. Of the 30 lessons analyzed from each country, 45 percent of the U.S. lessons, 76 percent of the German lessons, and 92 percent of the Japanese lessons fit this criterion of coherence.
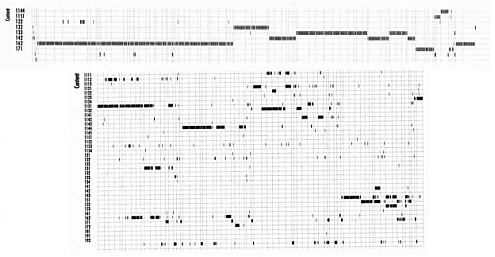
Figure 3-6 Schematic overview of population 2 mathematics textbooks from Japan and the United States. Each small vertical dash represents a single unit of analysis within the textbook, such as a single discussion, problem, or task. The dashes are organized into rows corresponding to the TIMSS mathematics curriculum framework (the numbers labeled "content" refer to specific topic areas). Thus, columns refer to units of analysis and rows to topic areas. The Japanese textbook covers a limited number of topics with infrequent switches among topics. The U.S. textbook, in contrast, covers many more topics than does the Japanese text (indicated by the greater number of content areas) and does so in a less continuous fashion. The analysis shown here for the U.S. text covers only about one quarter of the entire book, which is why some content areas are not covered.
Source: Schmidt et al., 1997c, pp. 99–101.
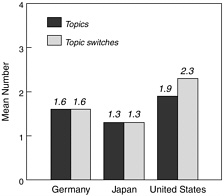
Figure 3-7 Average number of topics and topic switches per videotaped lesson in Germany, Japan, and the United States.
Source: Stigler et al., 1999, p. 47.
Lesson coherence is about more than just telling a single story because single mathematical stories can be told simply by working through a series of similar problems. Rich coherence comes from artfully piecing together segments, creating tensions and dilemmas, and building toward a conclusion. The Math Group tried to capture this distinction by looking for a variety of mathematical relationships among segments of lessons. By adding all of the ways segments were mathematically related, they produced an estimate of how richly a lesson was connected. Using this measure, U.S. lessons were much less coherent than those in Germany and Japan.
Finally, in addition to analyzing specific features of the lessons, the Math Group assessed the overall quality of the mathematics in each lesson with regard to its potential for helping students understand important mathematics. This subjective judgment was, of course, related to coherence, but it also took into account other aspects of mathematics, such as the level of challenge and how the content was developed. Using these subjective measures, the Math Group sorted the lessons into three content quality categories: low, medium, and high. In the judgment of these experienced mathematics teachers, U.S. students were at a clear disadvantage in their opportunities to learn, at least as indicated by the content to which they were exposed (Figure 3-8).
The lack of coherence in U.S. eighth-grade mathematics classes reinforces the conclusions made earlier in this chapter about the unfocused nature of U.S. curricula in mathematics and science. Without a clear set of goals that can establish connections among topics—goals such as those provided by national, state, and local standards in mathematics and science—it can be difficult to construct coherent mathematical and scientific stories in classes that cover a large number of topics.
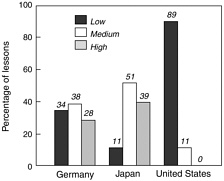
Figure 3-8 Percentage of lessons rated as having low, medium, and high quality of mathematical content. The total for Japan adds to more than 100 because of rounding.
Source: Stigler et al., 1999, p. 70.


